Factors Blog
Insights Across All Things B2B Account Intelligence & Analytics

Top LinkedIn Ads Agencies
LinkedIn has emerged as a crucial platform for B2B marketing, enabling businesses to reach a professional audience with targeted advertising. With the right strategy, LinkedIn ads can drive significant growth, leads, and conversions. To take advantage of LinkedIn's full potential, many businesses turn to something known as a LinkedIn ads agency.

The Importance of LinkedIn Agencies
LinkedIn has become a powerful tool for B2B marketing, offering unparalleled access to a professional audience. However, running successful LinkedIn ad campaigns requires a deep understanding of the platform, its targeting capabilities, and best ad creation and optimization practices. This is where LinkedIn ad agencies come in. These agencies specialize in maximizing the effectiveness of LinkedIn advertising, helping businesses to:
- Reach Targeted Audiences: Agencies leverage LinkedIn's advanced targeting features to ensure the most relevant audiences see ads.
- Optimize Ad Spend: By continuously monitoring and adjusting campaigns, agencies ensure that ad spend is used efficiently, maximizing ROI.
- Create Compelling Ads: Experienced agencies know how to create ads that capture attention and drive engagement.
- Analyze and Report: Agencies provide detailed analytics and reporting, allowing businesses to understand the impact of their campaigns and make informed decisions.

Here Are Some Of The Top LinkedIn Ads Agencies
1. HeyDigital

Overview:
HeyDigital is a leading LinkedIn ads agency known for its expertise driving growth for SaaS and B2B companies. They offer a comprehensive range of services including LinkedIn ad management, conversion rate optimization, and landing page design. Founded in 2019, HeyDigital has quickly built a reputation for delivering high-quality client results by focusing on data-driven strategies and creative ad development.
Key Features:
- Specialized in SaaS and B2B Companies: HeyDigital focuses on SaaS and B2B companies, providing tailored strategies that align with industry-specific goals.
- Comprehensive Ad Management and Optimization: They handle every aspect of LinkedIn ad campaigns, from initial setup to ongoing management and optimization.
- Conversion-Focused Landing Page Design: HeyDigital creates custom landing pages to maximize conversions and drive more leads.
- In-Depth Reporting and Analytics: They provide detailed reports and analytics to track campaign performance and inform strategic decisions.
Pros:
- Expertise in SaaS and B2B Sectors: Their specialization ensures a deep understanding of these industries' unique challenges and opportunities.
- Proven Track Record of Success: HeyDigital has a history of delivering impressive client results, and numerous case studies showcase its success.
- Detailed and Transparent Reporting: Clients appreciate HeyDigital's transparency and detail in reporting, which helps them understand their campaigns' ROI.
Cons:
- May Be Cost-Prohibitive for Smaller Businesses: HeyDigital's services are premium, which might be beyond the budget of smaller companies.
- Limited to Certain Industries: Their focus on SaaS and B2B sectors may not be the best fit for companies outside these areas.
Pricing:
- Custom pricing based on the scope of the project. HeyDigital tailors its pricing to match each client's specific needs and goals, ensuring a personalized approach.
2. Impactable

Overview:
Impactable is dedicated to helping businesses achieve their advertising goals through targeted LinkedIn campaigns. They provide full-service LinkedIn ad management, from strategy to execution and optimization. Impactable focuses on creating highly effective LinkedIn ads that drive meaningful engagement and conversions.
Key Features:
- Full-Service LinkedIn Ad Management: Impactable handles every aspect of LinkedIn advertising, ensuring a seamless and effective campaign from start to finish.
- Detailed Audience Targeting and Segmentation: They use advanced targeting techniques to reach the most relevant audiences for their clients.
- Advanced Analytics and Reporting: Impactable provides comprehensive analytics and reporting to track the performance and impact of LinkedIn ad campaigns.
- A/B Testing for Continuous Improvement: They regularly conduct A/B tests to refine ad strategies and improve results over time.
Pros:
- Focused Expertise on LinkedIn Ads: Impactable's sole focus on LinkedIn advertising ensures they stay up-to-date with the latest trends and best practices.
- Robust Targeting Capabilities: Their advanced targeting methods help clients reach the right audience more effectively.
- Strong Emphasis on Data-Driven Results: Impactable prioritizes data and analytics to drive decision-making and campaign improvements.
Cons:
- Services Can Be Expensive for Small Businesses: Like many specialized agencies, Impactable's services come at a premium.
Pricing:
- Custom pricing based on advertising spend and service requirements. Impactable works with clients to develop a pricing plan that aligns with their budget and advertising goals.
3. B2Linked

Overview:
B2Linked specializes in LinkedIn advertising and offers services designed to maximize ROI for its clients. Its focus is on high-precision targeting, campaign management, and continuous optimization. Founded by AJ Wilcox, a recognized expert in LinkedIn advertising, B2Linked brings a wealth of knowledge and experience to its clients.
Key Features:
- Precision Targeting and Segmentation: B2Linked uses LinkedIn's targeting capabilities to reach specific professional audiences.
- Comprehensive Campaign Management: They manage every aspect of LinkedIn ad campaigns, from setup to ongoing management and optimization.
- Continuous Optimization and A/B Testing: B2Linked conducts regular tests and optimizations to ensure the best possible performance.
- In-Depth Performance Tracking and Reporting: They provide detailed reports and analytics to help clients understand the impact of their campaigns.
Pros:
- Highly Specialized in LinkedIn Ads: B2Linked's focus on LinkedIn advertising allows them to develop deep expertise in this area.
- Excellent Targeting Capabilities: Their precise targeting methods help clients reach the most relevant audiences.
- Transparent and Detailed Reporting: Clients appreciate the detailed and transparent reporting provided by B2Linked.
Cons:
- May Not Offer Services Beyond LinkedIn: B2Linked's specialization means they do not provide broader digital marketing services.
- Pricing Can Be High for Startups: Their premium services might be out of reach for smaller companies or startups.
Pricing:
- B2Linked offers custom pricing based on client needs and campaign complexity. It works with clients to create a pricing structure that aligns with their goals and budget.
4. TripleDart

Overview:
TripleDart offers a holistic approach to LinkedIn advertising, focusing on creating compelling ads that drive engagement and conversions. They provide end-to-end LinkedIn ad management services tailored to meet specific business goals. TripleDart's team brings a wealth of experience in digital marketing, ensuring comprehensive support for LinkedIn campaigns.
Key Features:
- End-to-End LinkedIn Ad Management: TripleDart manages every aspect of LinkedIn ad campaigns, from strategy development to execution and optimization.
- Creative Ad Design and Development: They focus on creating visually appealing and engaging ads that capture attention and drive action.
- Data-Driven Targeting and Optimization: TripleDart uses data and analytics to refine targeting and optimize ad performance.
- Performance Analytics and Reporting: They provide detailed reports and insights to help clients understand campaign performance and ROI.
Pros:
- Comprehensive Service Offering: TripleDart offers a full range of LinkedIn ad services, from strategy to execution and optimization.
- Focus on Creative Ad Development: Their emphasis on creative ad design helps clients stand out on LinkedIn.
- Data-Driven Approach: TripleDart uses data and analytics to inform its strategies and optimize performance.
Cons:
- May Require Higher Budgets for Optimal Results: Their comprehensive services require a higher budget to achieve the best results.
- Some Services May Be Outsourced: Depending on the project's scope, some services might be outsourced to third-party providers.
Pricing:
- Custom pricing based on campaign scope and objectives. TripleDart works with clients to develop a pricing plan for their budgets and goals.
5. New North

Overview:
New North is a digital marketing agency that offers specialized LinkedIn advertising services. They focus on creating and managing LinkedIn campaigns that align with broader marketing strategies to drive business growth. New North combines strategic planning with creative execution to deliver impactful LinkedIn ads.
Key Features:
- Integrated Marketing Strategy: New North ensures LinkedIn ad campaigns are aligned with overall marketing strategies to maximize impact.
- Targeted LinkedIn Ad Campaigns: They create and manage campaigns that effectively reach and engage the target audience.
- Continuous Campaign Monitoring and Optimization: New North monitors and optimizes campaigns to ensure optimal performance.
- Comprehensive Reporting and Analysis: They provide detailed reports and analysis to track campaign performance and inform strategic decisions.
Pros:
- Strategic Integration with Overall Marketing Plans: Their approach ensures LinkedIn ads are part of a broader, cohesive marketing strategy.
- Expert Campaign Management: New North's team brings experience managing LinkedIn ad campaigns, ensuring high-quality execution and results.
- Emphasis on Continuous Improvement: Their focus on monitoring and optimizing ensures campaigns always perform at their best.
- Detailed Reporting and Insights: Clients receive comprehensive reports that provide valuable insights into campaign performance.
Cons:
- Potentially Higher Costs: Their integrated and comprehensive approach might come with higher costs than more specialized agencies.
- Broader Focus Might Mean Less Specialization: While their integrated approach is beneficial, they are less specialized in LinkedIn ads than agencies focusing solely on this platform.
Pricing:
- Custom pricing based on client needs and campaign scope. New North works with clients to develop a pricing structure that aligns with their marketing budgets and goals.
Criteria for Selecting the Right LinkedIn Ads Agency

Choosing the right LinkedIn ads agency is critical to the success of your campaigns. Here are some key factors to consider:
- Industry Experience
Look for agencies with experience in your specific industry. Specialized knowledge can significantly impact understanding your audience and crafting effective campaigns.
- Proven Track Record
Review case studies, client testimonials, and success stories to gauge an agency's effectiveness. A strong track record indicates their ability to deliver results.
- Service Offering
Ensure the agency offers your services, from strategy development to execution and optimization. Comprehensive services can simplify management and improve campaign cohesion.
- Customization
The best agencies tailor their services to meet your specific needs and goals. Avoid one-size-fits-all solutions.
- Budget
Understand the pricing structure and ensure it aligns with your budget. Consider the return on investment (ROI) potential rather than just the cost.
- Communication and Transparency
Effective communication and transparency are crucial for a successful partnership. Ensure the agency provides regular updates and detailed reports.
- Expertise and Innovation
Look for agencies that stay current with the latest LinkedIn trends and innovations. Their ability to adapt and innovate can keep your campaigns ahead of the competition.
- Cultural Fit
Ensure the agency's values and work style align with your own. A good cultural fit can enhance collaboration and overall satisfaction.
Step-by-Step Approach to Help You Choose the Perfect LinkedIn Ads Agency

Choosing the perfect LinkedIn ads agency involves a detailed evaluation of potential partners. Here’s a step-by-step guide to help you make the right choice:
- Define Your Goals
Clearly outline your advertising goals. Are you looking to increase brand awareness, generate leads, or drive conversions? Knowing your objectives will help you find an agency that aligns with your vision.
- Research and Shortlist
Conduct thorough research to identify potential agencies. Use directories, read reviews, and seek recommendations. Shortlist agencies that specialize in LinkedIn advertising and have a strong reputation.
- Evaluate Experience and Expertise
Look into the agency's experience with LinkedIn ads. Check their expertise in your industry and their understanding of your target audience.
- Request Case Studies and References
Ask for case studies demonstrating their success with similar campaigns. Contact references to get firsthand insights into their performance and client satisfaction.
- Assess Their Approach
Understand their strategy for LinkedIn advertising. Do they conduct thorough market research? How do they create and optimize ads? Ensure their approach aligns with your expectations.
- Analyze Reporting and Analytics
Effective reporting and analytics are crucial for tracking performance. Ensure the agency provides detailed, transparent reports that help you understand the impact of your campaigns.
- Discuss Pricing and ROI
Clarify the agency's pricing structure and ensure it fits your budget. Discuss the agency's approach to maximizing ROI and how it measures success.
- Test Communication and Responsiveness
Effective communication is key to a successful partnership. During the initial interactions, evaluate their responsiveness and willingness to address your concerns.
- Consider a Trial Period
Start with a smaller project or a trial period. This allows you to assess their performance and compatibility before committing to a long-term partnership.
Choosing the right LinkedIn ads agency can significantly impact your advertising success. Considering factors such as industry experience, service offerings, budget, and communication, you can find an agency that aligns with your goals and maximizes your LinkedIn advertising potential. The top agencies mentioned in this guide have proven track records and specialized expertise, making them excellent choices for businesses leveraging LinkedIn for growth and networking. Whether you choose HeyDigital, Impactable, B2Linked, TripleDart, or New North, you can be confident in their ability to deliver impactful LinkedIn ad campaigns that drive results.
However, managing LinkedIn ads efficiently also requires robust analytics and performance tracking.
Factors’ LinkedIn AdPilot
This is where our LinkedIn AdPilot comes into play. AdPilot enables marketers to double down on their LinkedIn ROI with capabilities such as Smart Reach, Audience Builder, Campaign Automation, View-Through Attribution, and Factors’ CAPI integration, enabling marketers to up their LinkedIn Ads game.
Make the most of your LinkedIn ad campaigns with the perfect combination of expert agency services and powerful analytics from Factors.ai.
Also Read: Top LinkedIn Agencies in North America
Also Read: Top LinkedIn Agencies in Middle East
%20(2).avif)
Top 5 Demandbase Alternatives to Boost ABM in 2024
When you think of an ABM platform, Demandbase naturally comes to mind. Demandbase (also known as Demandbase One) has been around since 2007 and has served 10,000+ customers after its launch.
But is it the right fit for your business? Get your answer as you scroll through our article and learn about the 5 Demandbase alternatives currently in the market ⬇️
Why look for a Demandbase alternative?
Demandbase offers a range of features such as:
- Account Identification: Identify high-potential accounts visiting your website or showing buying intent signals online.
- Account Targeting: Tailor marketing campaigns to specific accounts based on firmographics, technographics, and buying behaviors. (e.g., industry, technology used, website activity)
- Multiple Journeys: Create and manage personalized marketing journeys for different account segments based on product lines, business units, or other factors.
- Campaign Influence Metrics: Track and measure the impact of marketing campaigns on account progression within the sales funnel.
However, according to reviews across sites like G2, Capterra, and TrustRadius, users have stated that the setup process is tricky and the UI is outdated:


If you’re an SMB looking for an ABM platform, let’s examine what you must consider when making the purchase.
4 Factors to consider when looking for a Demandbase alternative
Cost-effective: Users have found that Demandbase's pricing is steep compared to other products that offer similar features. Find a tool that provides the best bang for your buck.
Easy to use: Choose a tool with an intuitive user interface that doesn’t have a deep learning curve. This will save you time and help you make the most of the tool.
Intent signals from relevant sources: Remember, there is such a thing as “too many signals.” make sure you have the right data from channels that most contribute to revenue impact.
LinkedIn ads ROI: If you’re running LinkedIn ads, you must ensure you’re making the most of your ad budget.
Top 5 Demandbase alternatives
Want to find the right tool and boost your marketing ROI? We’ve done the heavy lifting and compiled a list of the six best Demandbase alternatives you can consider:
- Factors.ai

Factors is a marketing attribution platform that helps marketers streamline their GTM efforts and optimize their marketing spend. We offer multiple features like:
- Factors can pull intent signals from LinkedIn and G2, which gives greater visibility into high-intent accounts considering your solution. Plus, you can unify all your account-level data from multiple sources.
- Our account and engagement scoring features allow you to assign a value to every interaction an ICP account has with your website. You can now prioritize accounts with high scores to close deals faster.
- Our segment insights feature lets you understand how different user segments resonate with your product.
- Factors can also help you personalize your cold outreach based on intent data, thereby taking your sales strategy to the next level.
- Use Factors to create custom workflow automations to simplify your business processes across multiple CRMs
- Our new AdPilot feature can improve the way you run LinkedIn ads and help you get 2x ROI from your ad campaigns
Why Factors is a good alternative to Demandbase
- Demandbase doesn’t have many features that showcase the impact of paid marketing compared to Factors.
- Our IP database includes 4.6 billion companies, whereas Demandbase has 3.6 billion.
- You cannot conduct segment-wise analysis on Demandbase
- LinkedIn AdPilot gives a complete overview of how LinkedIn plays a role in generating revenue, a feature currently missing in Demandbase
Limitations
- Factors doesn’t offer deanonymization at a contact level
Pricing

💡Learn more about our pricing here
- Albacross

Albacross is a well-established B2B marketing data platform that leverages advanced intent data to identify and capitalize on hidden opportunities from website traffic.
- Website Visitors: Turn website traffic into companies and capture accounts in the buying window
- IP Enrich API: Apply real-time buyer intelligence across your technology stack
- Account-Based Marketing: Target key accounts with customized ads on 90% of ad space globally
- Buying Signals: You can combine Bombora’s powerful intent signals with Albacross to uncover the buyer journey
Why Albacross is a good alternative to Demandbase
Albacross has contact enrichment within the same platform, so there would be no requirement to integrate with multiple enrichment tools
💡Also read: Top 10 Albacross Alternatives
Limitations
- Albacross doesn't allow custom engagement scoring
- The platform doesn’t include LinkedIn view-through attribution
Pricing

- Rollworks

RollWorks is an Account-Based Platform with ABM and advertising solutions that allow marketers to deeply understand their buyers and attribute revenue to marketing initiatives such as display ads, social ads, and triggered emails.
Why Rollworks is a good alternative to Demandbase
Users have reported that it is a far more feasible solution than Demandbase, with a cost of $975 per month.
Limitations
Customers have mentioned that running LinkedIn ad campaigns with Rollworks can get tedious, and they face issues when showing ads to the right accounts

Pricing
Rollworks doesn’t mention its pricing on its website. They have separate plans for Account-based marketing and Account-based advertising.
- Recotap

Recotap is an AI-driven Account-Based Marketing (ABM) platform that helps B2B Marketers run targeted ABM campaigns at scale. They break their offering into 3 categories:
- Data Hub: Account level, Contact level, Technographics, or Intent data. You'll find it all here
- Engagement Hub: Engage your accounts across multiple channels with personalized content
- Insights Hub: Let our AI crunch data from ads, emails, CRM, website visits & more to provide the right insights
Why Recotap is a good alternative to Demandbase
- Recotap is a better platform for brands aiming to leverage LinkedIn for ABM
- It is a cost-effective solution
Limitations
- Limited reporting options
- It doesn’t integrate with G2

Pricing
Recotap doesn’t have its pricing on its website, but they offer 3 pricing tiers (Starter, Growth, Enterprise)
- Common Room

Why Common Room is a good alternative to Demandbase
- Common Room focuses heavily on community management and engagement, a feature currently unavailable in Demandbase
- If you prioritize a seamless and intuitive user experience, Common Room might offer a more straightforward approach compared to Demandbase
- Common Room offers flexible pricing plans that might be more suitable for smaller businesses or startups compared to Demandbase
Limitations
- Common Room cannot derive intent signals from G2
- It’s a relatively newer product, so many features are still under development
- Engagement scoring feature isn’t as advanced as other tools on this list
Pricing

Choose the best Demandbase alternative
Streamlining sales and marketing alignment is a cakewalk when you have the right ABM platform. You must invest in a solution that helps you make the most of your marketing effort without burning a hole in your pockets.Sign up for a free trial today to understand how Factors allows you to leverage intent signals and accurately measure the impact of your marketing campaigns.
%20(1).avif)
Everything You Need to Know About SaaS Google Ads
If you’re building a SaaS company and haven’t invested in Google ads yet, you have no idea what you’re missing.
Over 80% of businesses use Google ads as a part of their marketing strategy and typically see a return of $2 for every $1 spent on Google ads. If you want to target in-market prospects and grow pipeline, this is the way to do it.
But how can SaaS companies leverage Google ads for revenue growth? Find your answer here, where we discuss the ABCs of SaaS google ads ⬇️
TL;DR
- Launch Google Ads only after achieving product-market fit and acquiring 10-15 customers.
- Set SMART goals, understand your audience, and conduct in-depth keyword research.
- Choose ad formats based on goals—Search for intent, Display for reach, and YouTube for engagement.
- Optimize landing pages, monitor performance, and adjust budgets to ensure ROI.
Firstly, when should SaaS companies run Google ads?
Ishaan Manchanda, the founder of GrowthSpree, has over 7 years of experience in PPC marketing, and he recommends that you begin running ads once you achieve product-market fit (PMF):
“Consider launching Google search ads only when you’ve achieved PMF and acquired at least 10-15 customers. If you’re still in the very early stages, paying for ads won’t make sense when you’re still making changes to your product.”
Running ads on Google has many benefits, the main one being that Google ads are intent-driven. Unlike other platforms, Google only shows your ads to folks looking for your solution. So, you only have to pay when a user clicks on your ad.
Your ad data also clarifies how you can modify your strategy for greater conversions. Now, let’s explore the types of ad formats you can leverage when launching Google ads.
Types of Google ads
Google Search Ads
These ads appear in search results above the organic results when people search for relevant keywords like "email marketing automation software." They are intent-based ads targeting existing demand.

Google Display Ads
These ads are shown on a vast collection of third-party websites that agreed to display Google ads. They can be in text, image, video, or rich media formats.

YouTube Ads
Video ads are an underrated method of generating leads for your business. SaaS companies can create video and display or text ads shown during or before YouTube videos or elsewhere on YouTube's platform. Video ads can be skippable or non-skippable.
App Campaigns
If the SaaS company has a mobile app, Google automatically creates ads by pulling the most relevant text, images, and ratings from the app store to drive mobile app installs and in-app conversions.
How to run Google ads for SaaS companies: a step-by-step guide
Here is a step-by-step guide for SaaS companies to launch effective Google Ads campaigns:
1. Define Your Campaign Objectives
When asked, “What is your campaign objective?” The most obvious answer is “to generate revenue.” However, you need to establish SMART goals to establish more clarity amongst the team, so that you can refine your ad strategy moving forward.
Example: Increase qualified leads from Google Ads by 30% in Q3 2024 by implementing targeted campaigns, optimized landing pages, and SMART Goals in Google Analytics.
2. Develop Audience Personas
Create detailed profiles of your ideal customers - their demographics, interests, pain points, etc.
Identify the keywords and search queries they will likely use when looking for a solution like yours. Determine the most relevant ad formats, landing pages, and offers for each persona.
3. Set Up Your Google Ads Account
Create a new Google Ads account or link an existing one to your SaaS business. Set your campaign objective to "Leads" to drive signups and demos. Choose the Search campaign type to reach people actively searching for your solution
4. Conduct Keyword Research
Use the Google Ads Keyword Planner to find relevant keywords and assess their potential.
Identify long-tail keywords that indicate high purchase intent. Group keywords into themed ad groups for more targeted ads
We’ve researched what keyword themes work best and have analyzed the following keyword types:
- Branded keywords
- Competitor keywords
- Pricing keywords
- Product/Feature keywords
💡Find out how to use these keywords in your Google ads strategy.
5. Optimize Landing Pages
Create dedicated landing pages for each ad group with a clear value proposition and call-to-action. For instance, if you’re creating a competitor landing page, you need to ensure
Ensure pages load quickly and are mobile-friendly. A/B test different page elements to improve conversion rates.
Tas Bober, a paid ads landing page expert and founder at Delphinium Solutions, recommends placing your form fields and displaying your product in the first fold of the landing page
“Create landing pages that:
1/ Deliver on the promise of the ads
2/ Showcase your product
3/ Call out who you're for
4/ Use clear language (think 5th grade)
5/ Bucket features into themes
6/ Save the company awards for the About page
7/ Use *relevant* social proof
8/ Tell the user what to expect after reaching out”
At Factors, we highlight the core value propositions in the first fold to drive consideration and engage prospects

6. Set Your Bids and Budget
Set a daily budget that allows you to get sufficient data to assess performance. Adjust bids and budgets over time based on the cost per click and conversion rates. You should also keep these metrics in mind when setting a Google ads budget:
- Calculate your Customer Acquisition Cost (CAC) and ensure your budget allows you to acquire customers at or below this cost.
- Determine your Customer Lifetime Value (LTV) and set a budget that reflects this value to ensure profitability.
Distribute your budget across different campaigns and ad types to test and find the most effective strategies. To optimize your budget allocation, you can also employ automated bidding strategies like Target CPA.
7. Monitor and Optimize
Regularly check your Google Ads dashboard to analyze key metrics like CTR, conversion rate, CPC, and ROAS. Use the Search Terms report to identify negative keywords to add to your campaigns. Make ongoing optimizations to bids, budgets, ads, and landing pages to improve performance.
Measure your Google ads performance with Factors
Google ads are critical to your overall GTM strategy. If you want to make the most of Google ads, Factors is the tool you need!
You can use our “Account Identification” feature to deanonymize visitors who visit your site and also identify which campaign brought them to the website:

With our advanced attribution and analytics features, you can visualize how they engage with your ads and how your ad campaigns contribute to generating pipeline:

You can also leverage our Segment Insights features to understand how paid search is performing in comparison to other performance marketing initiatives (e.g. LinkedIn ads), thereby allowing you to strategize and change your approach to generate maximum ROI.

You can also connect Factors with G2 to understand how many accounts visit G2 product pages, competitor pages, and category pages after viewing your ads.
Well, we aren’t going to reveal it all here! Contact our sales team to learn more about how you can leverage Factors to make the most of your Google ad spend.
How SaaS Companies Can Maximize Growth with Google Ads
For SaaS companies, Google Ads can be a powerful growth lever when used strategically. Companies should wait until they achieve product-market fit and have at least 10-15 customers before investing in ads. This ensures the product is stable and ready for a broader audience.
Clear campaign objectives aligned with revenue goals are critical. Defining SMART goals helps track progress and refine ad strategies. Understanding your target audience and conducting detailed keyword research covering branded, competitor, pricing, and product-related terms ensures ads reach high-intent prospects.
Choosing the right ad format is essential. Search ads target active demand, while display and YouTube ads expand brand visibility. App campaigns promote mobile apps if applicable. High-performing ads direct users to optimized landing pages that match the ad’s message, highlight product value and include a clear call to action.
Budgeting should align with customer acquisition cost (CAC) and lifetime value (LTV). Automated bidding strategies like Target CPA help improve cost efficiency. Continuous monitoring and optimization, like adjusting bids, refining keywords, and improving landing pages, ensures sustained performance and ROI.
A thoughtful, data-driven approach helps SaaS companies turn Google Ads into a scalable pipeline growth engine.

Top 11 RB2B Alternatives
Success in B2B marketing hinges on the right tools and platforms. That said, platforms such as RB2B have become indispensable for businesses looking to enhance their strategies, streamline lead management, and strengthen connections with target accounts. They offer a wide range of features—from automated marketing and integrated CRM systems to advanced analytics and AI insights—all aimed at boosting growth and efficiency.
Choosing the right B2B platform can be overwhelming with so many options out there. Each platform has its strengths, weaknesses, and pricing models, so businesses must assess their needs and budgets carefully before deciding. To help navigate this complexity, we've put together a list of the top 10 alternatives to RB2B. Each option is detailed with an overview, key features, pros, cons, and pricing, along with our insights.
Whether you're a small business looking for scalable solutions or a large enterprise needing advanced personalization and integration capabilities, this blog will give you the clarity to choose the perfect platform.
TL;DR
- RB2B is a popular B2B marketing and sales platform, offering AI-driven analytics, CRM integration, lead scoring, and automation tools.
- However, it may not meet all business needs due to cost, complexity, or limited functionality for some users.
- Reasons to consider alternatives include changing business needs, better cost efficiency, enhanced functionality, improved user experience, superior customer support, and quicker innovation.
- When selecting an alternative, consider business goals, essential features, ease of use, scalability, system integration, customer support, pricing, security, and user reviews.
- Compare features, pros, cons, and pricing for Factors, Clearbit, Kwanzoo, Lead Forensics, Hubspot Sales Hub, 6sense Revenue AI for Marketing, Constant Contact Advance automation and CRM platform, Apollo AI, Dealfront, 6sense Revenue AI™ for Sales, ZoomInfo Sales, to see what best fits your business needs.
- Free trials and demos are recommended to test usability and ensure the platform meets your needs.
Let’s Learn More About RB2B
Overview:
RB2B is a comprehensive B2B sales and marketing platform designed to enhance lead management and account-based marketing (ABM). Leveraging advanced AI, it offers real-time analytics, CRM integration, and powerful automation tools to streamline workflows and improve customer engagement. The platform is ideal for businesses seeking to optimize their sales strategies and boost ROI through data-driven decisions.
Key Features:
- AI-Powered Analytics: Advanced insights for data-driven decisions.
- CRM Integration: Seamless connection with existing systems.
- Lead Scoring: Prioritizes high-value prospects.
- Account-Based Marketing (ABM): Tailored strategies for target accounts.
- Automation Tools: Streamlines marketing and sales processes.
Pros:
- Comprehensive Analytics: Deep insights into customer behavior and trends.
- Strong CRM Integration: Enhances data management and customer tracking.
- Effective ABM: Personalized marketing strategies improve engagement.
- Automation: Reduces manual tasks, saving time and resources.
Cons:
- Complex Setup: Initial setup can be time-consuming and requires expertise.
- Learning Curve: Some users may find the platform challenging to master.
- Cost: Premium features may be costly for small businesses.
Pricing:
RB2B offers customized pricing plans based on business size and needs. Detailed pricing information is available upon request from the RB2B website.
Here’s Why You Need An RB2B Alternative
While RB2B may be a popular choice among businesses for their B2B needs, there are several reasons why you might consider exploring alternatives:
- Evolving Business Needs:
As businesses grow, their needs often evolve, and they may require different or more advanced tools than those provided by a single platform like RB2B.
- Cost Efficiency:
Some B2B platforms can be expensive, and if a company isn’t using all the features, they might seek a more affordable option. Alternative platforms might indeed offer more tailored features at a lower cost.
- Enhanced Functionality:
B2B platforms vary widely in the features they offer. If a business needs specific tools or enhanced capabilities that RB2B lacks, seeking alternatives is logical.
- User Experience:
User experience is crucial in the effectiveness of any software. If RB2B is difficult to use, switching to a more user-friendly platform could indeed boost productivity.
- Better Customer Support:
Customer support quality can differ significantly between platforms. If RB2B’s support is lacking, moving to a platform with better support is a reasonable consideration.
- Innovation and Updates:
Some platforms are quicker to adopt new technologies and features. If RB2B is slow to innovate, businesses might look for alternatives that offer more up-to-date solutions.
Exploring RB2B alternatives allows you to find a solution that better fits your current and future needs, ensuring your business stays agile, cost-efficient, and ahead of the competition.
Things to Keep in Mind While Choosing the Perfect RB2B Alternative
- Business Needs and Objectives:
Clearly define your business goals and what you need from a B2B platform. Whether it's lead generation, customer relationship management, or advanced analytics, ensure the platform aligns with your objectives.
- Features and Capabilities:
Compare the features offered by different platforms. Look for features that are essential to your operations, such as CRM integration, automated marketing, AI-driven insights, and customization options.
- Ease of Use:
The platform should have an intuitive interface that your team can quickly learn and navigate. A steep learning curve can lead to reduced productivity and increased training costs.
- Scalability:
Choose a platform that can grow with your business. It should be able to handle increasing amounts of data and users without compromising performance.
- Integration with Existing Systems:
Ensure the platform can seamlessly integrate with your current systems, such as CRM, ERP, and other marketing tools. This will help in creating a unified workflow and reduce data silos.
- Customer Support and Training:
Reliable customer support is crucial, especially during the initial setup and onboarding phase. Check if the platform offers comprehensive training resources and responsive support.
- Pricing and Budget:
Evaluate the pricing models of different platforms and ensure they fit within your budget. Consider not just the initial cost but also any ongoing expenses, such as subscription fees and additional charges for premium features.
- Security and Compliance:
Data security is paramount in B2B transactions. Ensure the platform complies with industry standards and regulations, such as GDPR, and offers robust security measures to protect your data.
- User Reviews and Case Studies:
Look for reviews from similar businesses. Case studies can provide insights into how the platform has helped other companies achieve their goals.
- Trial Periods and Demos:
Take advantage of free trials and demos to get a hands-on platform experience. This will help you assess its usability and fit for your business needs.
Whether you're a small business looking for scalable solutions or a large enterprise needing advanced personalization and integration capabilities, keeping these factors in mind will help you choose the perfect RB2B alternative.
Here are the best RB2B alternatives:
1. Factors.ai
Overview
Factors is a data-driven marketing analytics platform designed to help businesses optimize their marketing strategies and drive revenue growth. By leveraging advanced AI and machine learning algorithms, Factors enables marketers to analyze campaign performance, customer journeys, and conversion paths in real-time. The platform integrates seamlessly with various data sources, providing actionable insights that empower marketing teams to make informed decisions and maximize ROI.
Key Features
- Customer Journey Mapping: Visualizes customer journeys across different touchpoints to identify key conversion paths.
- Campaign Performance Analytics: Offers in-depth analysis of marketing campaigns, helping to optimize performance and ROI.
- Multi-Touch Attribution: Tracks and attributes conversions to multiple touchpoints in the customer journey, providing a holistic view of marketing effectiveness.
- Data Integration: Integrates with various data sources such as CRM, ad platforms, and analytics tools to provide a unified view of marketing performance.
- AI-Powered Insights: Utilizes AI to generate insights and recommendations for improving marketing strategies.
- Custom Dashboards: Allows users to create and customize dashboards for monitoring key metrics and KPIs.
Here’s why Factors is a strong RB2B alternative:
- Comprehensive Analytics: Provides detailed insights into customer behavior and campaign performance, enabling data-driven decision-making.
- User-Friendly Interface: The platform is intuitive and easy to navigate, making it accessible to marketers of all skill levels.
- Seamless Integrations: Easily integrates with a wide range of tools and platforms, ensuring smooth data flow and analysis.
- Actionable Insights: AI-driven recommendations help marketers quickly identify opportunities for improvement.
- Customizable Dashboards: Allows for flexibility in reporting, with dashboards tailored to specific business needs.
Cons
- Limited Customization: Some users find the customization options for reports and dashboards to be limited.
- Complex Setup: Initial setup and integration can be complex and may require technical support.
- Learning Curve: While the interface is user-friendly, fully understanding and utilizing all features may take some time.
- Pricing: The platform can be expensive for small businesses or startups with limited budgets.
Pricing
Factors offers custom pricing based on the needs of the business. Prospective customers can request a demo and a tailored pricing plan directly from Factors. For more details, visit Factors Pricing.
Concluding Statement
Factors is a powerful tool for businesses to enhance their marketing analytics and drive growth through data-driven insights. Its AI-powered capabilities and comprehensive analytics make it particularly well-suited for organizations seeking to optimize their marketing strategies and understand customer behavior in depth. While the platform may have a steep learning curve and require some technical setup, its robust features, and seamless integrations make it a valuable asset for marketers aiming to maximize ROI.
2. Clearbit
Overview
Clearbit Enrichment adds over 100 data points on a company, its technology, and its employees to every record in your database, helping you convert leads into customers faster. It integrates smoothly with HubSpot to streamline and enhance your workflows, ensuring you capture valuable leads by providing the context needed to score, route, and accelerate the buyer's journey. Clearbit allows for shorter forms by auto-filling known fields, thus boosting conversions. It leverages a reliable source of business data, optimized with machine learning and quality assurance, applicable to all companies with a web presence, not just the Fortune 500. Additionally, Clearbit Reveal identifies companies visiting your website and syncs this enriched information directly to HubSpot.
Key Features
- Data Availability
- Contact Data Availability: Extensive access to contact information.
- Company Data Availability: Comprehensive company data access.
- Industry Research Availability: Provides industry-specific research data.
- Data Accuracy
- Contact Data Accuracy: High level of accuracy in contact information.
- Company Data Accuracy: Reliable accuracy in company data.
- Features
- Lead Builder: Facilitates the creation of detailed lead profiles.
- Integration with CRM/Marketing Automation: Seamlessly integrates with CRM and marketing tools.
- Data Cleaning/Enrichment: Enhances and purifies existing data.
- Search: Advanced search capabilities.
- News/People Alerts: Alerts on relevant news and updates.
- Reporting: Comprehensive reporting features.
- Platform
- Internationalization: Supports global usage.
- Performance and Reliability: Ensures high performance and dependability.
- APIs: Provides robust APIs for integration.
- Lead Intelligence
- Lead Enrichment: Enriches lead data with extensive information.
Here’s why Clearbit is a good RB2B alternative:
- User-friendly interface.
- High accuracy in finding company owners' and senior executives' details.
- Enhances sales and marketing by identifying website visitors.
- Integrates effectively with HubSpot and Google Analytics.
- Provides additional channels for SDR teams to analyze outbound campaigns.
Cons
- Recent UX changes have made some features, like the visitor report, harder to use.
- Credit-based system can be confusing.
- Some data enrichment titles are not useful for all audiences.
Pricing
Pricing information for Clearbit is provided by the vendor or available from public sources. Final cost negotiations should be conducted directly with Clearbit.
Concluding Statement
Clearbit is a robust tool for lead enrichment and data integration, enhancing sales and marketing processes with accurate and comprehensive company and contact data. It is user-friendly and integrates well with platforms like HubSpot, despite some recent UX changes and the somewhat confusing credit system. Overall, Clearbit is a valuable asset for businesses looking to optimize lead generation and customer engagement.
3. Kwanzoo
Overview
Kwanzoo is a cutting-edge platform that offers comprehensive solutions for B2B marketers looking to streamline their account-based marketing (ABM) and demand generation efforts. Kwanzoo’s approach combines multichannel engagement, dynamic personalization, and advanced data analytics, helping businesses drive more meaningful interactions with their target accounts. With a robust suite of tools designed to enhance campaign performance and accelerate sales pipelines, Kwanzoo has positioned itself as a strong alternative to Factors for businesses aiming to optimize their B2B marketing strategies.
Key Features
- Account-Based Marketing (ABM)
- Focuses heavily on ABM strategies.
- Engages high-value accounts with personalized and targeted marketing efforts.
- Supports multichannel marketing for broader reach.
- Data-Driven Personalization
- Utilizes real-time data analytics.
- Helps craft highly personalized marketing content based on user behaviors.
- Improves engagement and conversion rates through tailored messaging.
- Omnichannel Support
- Integrates with multiple marketing channels like display ads, email, and mobile.
- Provides seamless interactions across different customer touchpoints.
- Ensures consistent messaging and engagement across platforms.
- Lead Nurturing
- Offers advanced lead nurturing capabilities.
- Ensures continuous engagement of leads throughout the sales funnel.
- Delivers relevant content to move leads closer to conversion.
- A/B Testing
- Allows A/B testing for creative content.
- Helps marketers optimize campaigns for better performance and results.
- Enables data-driven decisions on content effectiveness.
- CRM and Marketing Automation Integration
- Integrates with major CRM and marketing automation platforms, including Salesforce, Eloqua, and Marketo.
- Ensures smoother workflows and unified marketing efforts.
- Facilitates better collaboration between marketing and sales teams.
Here’s why Lead Forensics is a good RB2B alternative:
- Strong focus on ABM and personalized, data-driven marketing.
- Ensures consistent omnichannel engagement.
- Seamless integration with major CRMs and marketing automation platforms.
- Advanced A/B testing for continuous campaign optimization.
Cons
- Complex setup with a steep learning curve.
- Limited features for smaller businesses.
- Customization options for reporting and dashboards may be less flexible.
Pricing
Kwanzoo offers custom pricing plans based on the specific needs of businesses. The pricing varies depending on factors like the scale of ABM campaigns, the number of target accounts, and additional integrations. It’s best to contact Kwanzoo directly for a tailored quote that fits your marketing requirements.
Concluding StatementKwanzoo presents a powerful and feature-rich platform for B2B marketers who need to enhance their account-based marketing and lead nurturing efforts. Its advanced personalization and omnichannel engagement capabilities make it an excellent alternative to Factors, especially for companies targeting high-value accounts with customized campaigns. However, it’s important to consider the complexity of setup and that smaller businesses may not fully leverage all the platform’s functionalities. Overall, Kwanzoo remains a competitive option in the B2B marketing space, particularly for larger enterprises.
4. Lead Forensics
Overview
Lead Forensics empowers businesses to engage with B2B website visitors in real time, capitalizing on moments when visitors are most engaged. This tool identifies who your website visitors are, their origin, their interests, and their stage within your sales pipeline. It enables quick routing of opportunities to account managers, facilitating valuable and meaningful conversations. Established in 2009, Lead Forensics operates globally with over 60,000 users and more than 400 dedicated SaaS specialists. The platform boasts an extensive matched IP database, identifying millions of IP addresses and B2B contacts. This data undergoes rigorous cleansing and verification, ensuring the highest quality and volume of matched B2B website visitors, presented in an intuitive dashboard with detailed reporting.
Key Features
- Lead Intelligence
- Provides detailed insights on leads at the account level.
- Comprehensive lead analysis and management.
- Effective segmentation and account identification.
- Marketing Campaigns
- Supports media attribution and customization.
- Utilizes natural language processing (NLP) for advanced features.
- Offers real-time intent alerts.
- Data Availability
- Extensive contact data availability.
- Access to offline data.
- Platform Additional Functionality
- Integrations with other tools.
- Topic customization capabilities.
Here’s why Lead Forensics is a good RB2B alternative:
- Real-time visibility of website visits with detailed visitor information.
- Ability to categorize leads and add different statuses for efficient targeting.
- Trigger reports ensure appropriate team members follow up on relevant leads.
- Access to company data helps in creating highly targeted marketing campaigns.
- Excellent account management support with regular check-ins.
Cons
- Desire for further integration with Salesforce.
- Users feel there are many tools within the platform that they do not fully utilize due to time constraints.
Pricing
Lead Forensics offers two pricing plans. One is the Essential plan which is perfect for small and medium sized businesses, while the other is the Automate plan, perfect for enterprise businesses. You can get your free trial, expert advise, as well as custom quote from Lead Forensic’s website itself.
Concluding Statement
Lead Forensics is a powerful tool for B2B companies seeking to engage with website visitors in real time. Its ability to provide detailed insights into visitors and their behaviors, combined with robust lead management and segmentation features, makes it a valuable asset for optimizing marketing and sales efforts. Although there is room for improvement in integrations and tool utilization, the platform's comprehensive data quality and excellent support make it a reliable choice for enhancing B2B website visitor intelligence.
5. HubSpot Sales Hub
Overview
HubSpot Sales Hub is a comprehensive and user-friendly sales CRM that integrates sales engagement tools, CPQ functionality, and advanced sales analytics. Built on the HubSpot CRM platform, it unifies customer data, tools, and teams to create a single source of truth, enhancing sales rep efficiency. Utilizing the full CRM platform provides richer insights, warmer leads, and aligned enablement materials, allowing reps to operate at maximum efficiency. The platform's extensive ecosystem of app and solutions partners ensures an exceptional end-to-end customer experience. HubSpot Sales Hub is designed to scale your company without adding complexity, offering all the necessary tools for business growth.
Key Features
- Sales Force Automation
- Automates sales tasks to streamline processes.
- Contact & Account Management
- Manages customer and account information efficiently.
- Opportunity & Pipeline Management
- Tracks and manages sales opportunities and pipeline stages.
- Task / Activity Management
- Organizes and tracks sales tasks and activities.
- Territory & Quota Management
- Manages sales territories and quotas effectively.
- Desktop Integration
- Integrates with desktop applications for seamless workflow.
- Marketing Automation
- Automates marketing tasks to enhance lead generation.
- Email Marketing
- Facilitates email marketing campaigns.
- Campaign Management
- Manages and tracks marketing campaigns.
- Lead Management
- Tracks and nurtures leads throughout the sales cycle.
- Marketing ROI Analytics
- Analyzes marketing return on investment.
- Customer Support
- Provides robust case management for customer support.
- Mobile & Social
- Offers social collaboration features and mobile user support.
- Reporting & Analytics
- Provides detailed reporting, dashboards, and forecasting.
Here’s why HubSpot Sales Hub is a good RB2B alternative:
- HubSpot is user-friendly and intuitive, making it easy to manage pipelines and organize outbound processes.
- Seamless integration with other tools, such as Trellus, enhances workflow efficiency.
- Robust lead management features support effective tracking and nurturing of leads.
- Extensive training resources and responsive customer support help users get the most out of HubSpot.
- Highly customizable and quick to implement, offering flexibility to suit various business needs.
- Accessible for visually impaired users, with good compatibility with screen reading software.
Cons
- There is a steep learning curve for some users, particularly when adapting to new workflows.
- Certain features that might be essential for specific workflows are missing.
- Users have reported occasional email issues that need addressing.
- The cost is higher compared to some competitors, which may be a consideration for budget-conscious businesses.
- Adapting to account-based outreach approaches can be challenging with the current setup.
Pricing
There are two pricing plans available. The first one is the Sales Hub Professional plan which starts at $90/mo/seat. The second plan is the Sales Hub Enterprise plan which starts at $150/mo/seat. For detailed pricing information, please refer to the HubSpot Sales Hub pricing page.
Concluding Statement
HubSpot Sales Hub is a robust and flexible CRM solution that enhances sales processes with powerful tools and seamless integrations. While there may be a learning curve and higher costs, the platform's ease of use, extensive features, and excellent customer support make it a valuable investment for growing teams. HubSpot Sales Hub enables businesses to scale efficiently and effectively, providing a solid foundation for sustained growth.
6. 6sense Revenue AI for Marketing
Overview
6sense transforms how organizations manage and convert pipeline to revenue. Their Revenue AI captures anonymous buying signals, identifies optimal accounts, and recommends tailored channels and messages to enhance revenue performance. By eliminating guesswork and streamlining sales efforts, 6sense empowers teams to improve pipeline quality, accelerate sales velocity, increase conversion rates, and predictably grow revenue. Learn more at 6sense.com.
Key Features
- Lead Intelligence
- Provides detailed insights on leads and accounts.
- Enables predictive scoring and effective lead management.
- Marketing Distribution
- Facilitates personalized messaging and website personalization.
- Supports digital advertising and comprehensive campaign planning.
- Platform Additional Functionality
- Integrates with major platforms including ad networks, buyer intent data sources, marketing automation, and CRM systems.
Here’s why HubSpot Sales Hub is a good RB2B alternative:
- Utilizes powerful intent data for targeted marketing efforts.
- User-friendly interface for ease of use.
- Effective audience targeting and solution effectiveness.
- Strong customer support and extensive integrations.
Cons
- Potential for inaccuracies in data.
- Complexity in managing multiple creatives in campaigns.
- Issues with data quality and slow performance at times.
Pricing
Pricing information is customized and not publicly available. Interested parties must contact 6sense for detailed pricing.
Concluding Statement
6sense Revenue AI for Marketing stands out for its ability to leverage intent data effectively in driving account-based marketing strategies. It offers robust features for lead intelligence, personalized marketing campaigns, and seamless integrations with major platforms. While it commands a premium price and faces challenges with data accuracy and integration limitations, 6sense remains a leading choice for organizations aiming to implement successful account-based revenue strategies.
7. Constant Contact Advanced Automation & CRM Platform
Overview
Constant Contact offers powerful digital marketing tools tailored for small businesses, focusing on simplifying and enhancing digital marketing efforts. Whether it's driving sales, expanding customer bases, or engaging audiences, Constant Contact aims to foster strong connections and deliver impactful results.
- Grow your audience: Quickly build your email list using landing pages, social media lead ads, and more.
- Deepen customer relationships: Engage with customers via text, email, or social media—all from a single platform—to drive better engagement and outcomes.
- Simplify social media: Manage social posts and ads effortlessly to boost awareness, generate leads, and foster growth.
- Sync with existing apps: Seamlessly integrate with your current digital tools to accelerate business growth and online sales.
Key Features
- Reporting & Analytics: Provides basic reporting and web analytics.
- Email Marketing: Create, personalize, and send outbound emails, manage email deliverability, and automate responses.
- Online Marketing: Includes mobile-optimized landing pages, forms, and tools for lead management, segmentation, scoring, nurturing, and online behavior tracking.
- Automated Alerts and Tasks: Automate alerts and tasks to streamline workflows.
Here’s why Constant Contact is a good RB2B alternative:

- Easy to use interface, especially for email marketing.
- Excellent customer support.
- Robust automation features.
- Simplifies the creation of marketing materials.
Cons
- Some template issues were reported.
- Occasional missing or limited features.
- Initial learning curve for new users.
- Issues with email functionality.
Pricing
Constant Contact offers three pricing plans:
- Lite: Starting at ₹990/month (price varies based on number of contacts).
- Standard: Starting at ₹2,888/month (price varies based on number of contacts).
- Premium: Starting at ₹6,600/month (price varies based on number of contacts). For detailed pricing information, visit Constant Contact Pricing.
Concluding Statement
Constant Contact Advanced Automation & CRM Platform is an essential tool for small businesses looking to streamline and amplify their digital marketing efforts. It excels in simplifying email marketing, offering robust automation capabilities, and providing excellent customer support. While there are occasional template issues and a learning curve for new users, the platform's adaptability and integration with tools like Canva make it a versatile choice for enhancing marketing strategies and customer engagement.
8. Apollo.io

Overview
Apollo.io is a comprehensive sales intelligence platform designed to assist in prospecting, engaging, and driving revenue growth. It provides tools for discovering new customers, connecting with contacts, and establishing effective go-to-market strategies. With a robust B2B database containing over 275 million contacts and 73 million companies, Apollo.io ensures teams have access to accurate and extensive data. The platform also offers an Engagement Suite to scale outbound activities and sequences efficiently, along with an Intelligence Engine that provides recommendations and analytics to optimize sales processes.
Key Features
- Data Availability
- Extensive availability of contact, company, and industry research data.
- Data Accuracy
- Ensures high accuracy in both contact and company data.
- Features
- Comprehensive search capabilities.
- Tools for lead intelligence, validation, enrichment, and analysis.
- Browser extension for seamless integration.
- Integrated workflows and task management.
- Email tracking and automation.
- CRM integration for enhanced workflow management.
- AI-driven automation and lead prioritization.

Here’s why Apollo.io is a good RB2B alternative:
- Organizational tools and powerful filters facilitate precise audience targeting.
- Simplifies the creation of sequences and touchpoints across multiple channels.
- Offers a range of features that enhance overall sales effectiveness.
Cons
- Some inaccuracies in phone numbers were sourced from online data.
- Issues with email deliverability and occasional bans from email providers like MS Outlook.
Pricing
Apollo.io offers four pricing plans ranging from a free plan to $119 per month for the Organization plan, accommodating different user needs and budgets. A free trial option is also available.
Concluding Statement
Apollo.io stands out as a versatile sales intelligence platform that empowers businesses to streamline their sales efforts effectively. With its vast database, powerful engagement tools, and AI-driven insights, Apollo.io supports organizations of all sizes in maximizing their outreach and conversion efforts. While it excels in organizing and targeting leads, improvements in data accuracy and email deliverability would enhance its overall utility for sales and marketing professionals.
9. Dealfront (formerly Echobot & Leadfeeder)
Overview
Dealfront is a comprehensive Go-to-Market Platform designed to empower sales and marketing teams with the tools needed to attract leads and close deals effectively.
Born from the merger of Germany’s Echobot and Finland’s Leadfeeder, Dealfront leverages advanced algorithms and data insights that surpass traditional tools, all while adhering to Europe’s stringent regulations. By integrating sales and marketing processes into a unified platform, Dealfront creates a perpetual optimization cycle that enhances accuracy, provides real-time Ideal Customer Profiles (ICPs), and converts more leads into successful deals.
Key Features
- Data Availability
- Extensive availability of contact, company, and industry research data.
- Data Accuracy
- High accuracy in both contact and company data.
- Features
- Lead Builder: Constructs detailed lead profiles.
- Integration to CRM/Marketing Automation: Seamlessly integrates with existing systems.
- Data Cleaning/Enrichment: Enhances data quality.
- Data Segmentation/Filtering: Allows for precise data organization.
- Search: Advanced search functionalities.
- News/People Alerts: Provides timely alerts on relevant updates.
- Platform
- Internationalization: Supports global operations.
- User, Role, and Access Management: Ensures secure and efficient platform usage.
- Performance and Reliability: Offers robust performance and reliability.
- APIs: Facilitates extensive integration capabilities.
Here’s why Dealfront is a good RB2B alternative:
- Easy setup with valuable insights on website leads.
- Helps map user journeys and optimize website performance.
- Provides detailed source information on website visits.
- Useful filters and labeling for focused information.
- No additional costs for adding extra users, enhancing team collaboration.
Cons
- Lack of automatic integration with certain tools like Brevo.
- Manual setup for integrations can be time-consuming.
- Potential for errors in manual configurations.
Pricing
Dealfront offers flexible pricing packages tailored to specific business needs. For detailed pricing information, visit Dealfront Pricing.
Concluding Statement
Dealfront (formerly Echobot & Leadfeeder) stands out as a robust Go-to-Market Platform that integrates essential sales and marketing functionalities into a single, cohesive solution. Despite some limitations in automatic integrations, its strong API capabilities and comprehensive data insights make it a valuable asset for businesses looking to optimize their lead generation and conversion processes effectively.
Also Read: Leadfeeder (Dealfront) Vs. Factors: Compare Pricing and Features
10. 6sense Revenue AI™ for Sales
Overview
6sense Revenue AI™ for Sales provides a centralized digital platform where sellers can quickly gather account and buying team intelligence. It emphasizes insights into the “Dark Funnel,” where a significant portion of B2B research happens anonymously, ensuring sellers can capitalize on potential deals they might otherwise miss. The platform offers direct access to recommended actions, persona mapping, detailed people and company profiles, a Chrome extension, prioritization dashboards, and alerts.
Key Features
- Data Availability
- Comprehensive availability of contact and company data.
- Access to industry-specific research.
- Data Accuracy
- High accuracy in contact and company data.
- Features
- Lead Builder for creating detailed lead profiles.
- Seamless integration with CRM and marketing automation tools.
- Data cleaning, enrichment, and segmentation/filtering capabilities.
- Advanced search functionalities and real-time alerts.
- Robust reporting capabilities.
- Platform
- User, role, and access management features.
- Reliable performance with detailed reporting and dashboards.
Here’s why 6sense Revenue AI for Sales is a good RB2B alternative:
- Provides visibility into new accounts through 6QA.
- Offers detailed intelligence on each account.
- User-friendly UI with seamless implementation.
- Excellent customer support and training from dedicated CSMs.
Cons
- Persona Map functionality may sometimes lack accurate contact information.
- Issues with synchronization of sales activities, affecting reporting accuracy and adoption rates.
Pricing
6sense Revenue AI™ for Sales offers customized packages tailored to specific features and enterprise needs. It includes unlimited insights into technology, company, and leads, along with features like custom alerts, saved filters, CSV exports, Salesforce & HubSpot integration, and dedicated success management.
Concluding Statement
6sense Revenue AI™ for Sales stands out as a powerful tool for B2B sales teams aiming to enhance their prospecting and sales efforts with deep account and buying team intelligence. While it offers robust features and reliable performance, improvements in persona mapping accuracy and better enablement training for new interfaces would further elevate its effectiveness. Overall, it is a comprehensive solution suited for teams of all sizes looking to optimize their sales processes through advanced data insights and streamlined workflows.
Also Read: 6Sense+Factors Visitor Identification & Account Analytics
11. ZoomInfo Sales
Overview
ZoomInfo Sales is a comprehensive go-to-market platform designed for B2B companies. It features a vast, accurate, and frequently updated database of insights, intelligence, and purchasing intent data about companies and contacts. The platform enhances this intelligence with tools like conversation intelligence (Chorus), sales engagement (Engage), and data orchestration (RingLead), facilitating better prospect and customer engagement. By integrating these tools with your existing systems, ZoomInfo Sales equips your go-to-market teams to close more deals efficiently.
Key Features
- Data Availability
- Comprehensive access to contact and company data.
- Industry-specific research data availability.
- Data Accuracy
- High accuracy in contact and company data.
- Features
- Lead Builder for creating detailed lead profiles.
- Integration with CRM and marketing automation platforms.
- Data cleaning and enrichment capabilities.
- Advanced data segmentation and filtering.
- Powerful search functionalities.
- News and people alerts.
- Detailed reporting features.
- Platform
- High performance and reliability.
- Analytics for deeper insights.
- Import/export functionalities.
- Lead monitoring capabilities.
Here’s why ZoomInfo Sales is a good RB2B alternative:
- User-friendly interface with easy access and implementation.
- Seamless integration with centralized CRM platforms.
- Comprehensive filtering options and strategic filters.
- Regular updates with new and useful features.
Cons
- Inconsistent performance of the Chrome pop-out extension.
- Limited support and occasional delays in resolving issues.
- Data accuracy can vary, requiring verification.
- Limitations in mobile app functionalities.
Pricing
Custom pricing is available upon inquiry with ZoomInfo Sales.
Concluding Statement
ZoomInfo Sales stands out as a robust solution for B2B companies aiming to streamline their sales processes and improve customer engagement. With its extensive database and integrated tools, it empowers teams to access accurate data, enhance targeting capabilities, and achieve higher sales effectiveness. While facing challenges like occasional technical issues and data accuracy concerns, ZoomInfo Sales continues to innovate and provide valuable features that support business growth and efficiency.
How can Factors help?
Factors is an advanced B2B sales and marketing platform that leverages cutting-edge AI technology to provide actionable insights and optimize lead management. Here’s how Factors stands out:
- Advanced AI-Driven Insights
Factors uses artificial intelligence to analyze massive datasets, uncover hidden patterns, and predict future trends. This allows businesses to make data-driven decisions and refine their strategies based on actionable insights.
- Enhanced Lead Scoring
The platform offers sophisticated lead scoring algorithms that evaluate lead quality more accurately. By assessing various factors such as engagement, behavior, and fit, Factors helps prioritize high-value prospects, ensuring sales teams focus their efforts on the most promising opportunities.
- Integration and Automation
Factors seamlessly integrates with existing CRM systems and marketing tools, streamlining workflows and automating repetitive tasks. This integration enhances efficiency by reducing manual data entry and ensuring that all systems are aligned.
- Personalized Marketing Campaigns
The platform provides tools for creating highly personalized marketing campaigns based on deep customer insights. This personalization increases the effectiveness of marketing efforts and improves customer engagement.
- Real-Time Analytics
Factors delivers real-time analytics and reporting, enabling businesses to track the performance of their campaigns and make quick adjustments as needed. This ensures that marketing strategies remain effective and responsive to changing market conditions.
- Scalability
Whether you're a small business or a large enterprise, Factors scales to meet your needs. Its flexible features and robust infrastructure support businesses of all sizes, adapting to varying demands and complexities.
- LinkedIn AdPilot
Factors has launched LinkedIn AdPilot, a platform that enables marketers to double down on their LinkedIn ROI. AdPilot’s capabilities such as Smart Reach, Audience Builder, Campaign Automation, View-Through Attribution, and Factors’ CAPI integration enable markteres to up their LinkedIn Ads game.
- G2 Intent
With G2 Intent integration, Factors provides insights into potential customers' buying intent. This feature allows businesses to identify and target prospects actively researching similar solutions, enhancing the precision and timing of marketing efforts.
- Account Intelligence and Analytics
Factors offers comprehensive account intelligence and analytics, giving businesses a deeper insight into their target accounts. This includes insights into account behavior, engagement levels, and key decision-makers, enabling more effective account-based marketing strategies.
Find the best RB2B alternative today
Choosing the right RB2B alternative can significantly impact your business's ability to attract, engage, and convert leads. Each of the alternatives listed above offers unique features and benefits, catering to different business needs and budgets. By evaluating these options based on their key features, pros, cons, and pricing, you can make an informed decision that aligns with your company's goals and growth strategy. Whether you're looking for advanced ABM capabilities, robust marketing automation, or comprehensive sales intelligence, there's a solution out there that can help you succeed in the competitive B2B landscape.
Ready to transform your B2B sales and marketing strategy with cutting-edge technology? Request a demo today and see how Factors.ai can help!

Top LinkedIn Agencies in North America
LinkedIn is a cornerstone platform for professionals and businesses across North America. It offers unparalleled professional networking opportunities, facilitating connections with industry peers, potential employers, and thought leaders. LinkedIn showcases individuals’ skills, experiences, and achievements like a digital resume, bolstering their career prospects and professional growth.
With a user base exceeding 200 million in North America alone, LinkedIn is an invaluable hub where professionals and businesses converge to exchange insights, forge strategic alliances, and cultivate meaningful connections. Below, we highlight a selection of leading LinkedIn Agencies in North America:
- B2Linked in Lehi, Utah, USA
- LeadCookie in St. Louis, Missouri, USA
- 310 Creative in Los Angeles, USA
- Sculpt in Iowa City, IA, USA
- Cleverly in Los Angeles, CA, USA
- Hey Digital in Tallinn, Estonia
- New North in Frederick, Maryland, USA
What is LinkedIn Marketing?
LinkedIn Marketing involves leveraging the platform to engage with a professional audience, enhance brand visibility, generate leads, nurture business relationships, and drive website traffic. Capitalizing on LinkedIn's unique role as a professional networking site facilitates direct engagement between businesses and professionals.
Key Components of LinkedIn Marketing:
- Company Page:
A LinkedIn Company Page is the cornerstone of a business’s LinkedIn presence. It offers comprehensive information about the company, showcases products or services, and disseminates updates.
- Content Marketing:
Publishing relevant content such as articles, blog posts, videos, and infographics fosters audience engagement, establishes thought leadership, and stimulates meaningful interactions.
- LinkedIn Ads:
Paid advertising options like sponsored content, sponsored InMail, Text Ads, and Dynamic Ads enable businesses to target specific demographics and expand their reach effectively.
- LinkedIn Groups:
Participation in or creating groups focused on specific industries or interests fosters community building, facilitates knowledge sharing, and enhances brand visibility.
- Employee Advocacy:
Encouraging employees to share company content and professional achievements amplifies brand reach and credibility within their networks.
- Analytics:
Leveraging LinkedIn Analytics provides crucial insights into post performance and audience demographics and enables refined marketing strategies based on data-driven decisions.
Importance of LinkedIn in B2B Marketing and Professional Networking
A. B2B Marketing:
- Lead Generation: LinkedIn is a powerful tool for generating high-quality leads due to its professional user base and targeted advertising capabilities.
- Brand Awareness: By sharing valuable content and engaging with the audience, businesses can enhance their brand visibility and establish authority in their industry.
- Networking: LinkedIn facilitates connections with industry peers, potential clients, and business partners, fostering long-term professional relationships.
- Thought Leadership: Companies can position themselves as industry leaders by consistently sharing insightful content and participating in relevant discussions.
Trends in LinkedIn Usage in North America
- LinkedIn's user base in North America has seen consistent growth as of 2023.
- LinkedIn has approximately 220M+ members in North America.
- North America has the second-largest user base globally.
LinkedIn’s popularity among different industries and sectors
- Technology and IT:
LinkedIn is highly popular among professionals in the technology and IT sectors, who use it for networking, job hunting, and sharing industry insights.
- Healthcare:
The healthcare industry leverages LinkedIn for professional development, industry news, and connecting with peers.
- Finance:
Financial professionals use LinkedIn to network, stay updated on market trends, and explore career opportunities.
- Education:
Educators and academic institutions use LinkedIn to connect with alumni, share research, and recruit students and staff.
By understanding these aspects of LinkedIn Marketing and its significance, businesses can effectively leverage the platform for growth and professional networking, especially in the B2B space.
Criteria for Selecting Top LinkedIn Agencies
Here are some criteria to remember if you’re looking to onboard a LinkedIn agency:
- Experience and Expertise
Years in operation
- We should look at companies that have been operational for about 5 to 10 years. These companies will be reliable and up-to-date with the latest technology and LinkedIn marketing.
Specialization in LinkedIn marketing
- Select agencies that specialize in LinkedIn rather than those that offer generic social media marketing services. Agencies with focused expertise in LinkedIn will likely provide advanced strategies and insights tailored to LinkedIn’s professional audience.
- Client Portfolio
Types and sizes of clients served
- Review the agency’s client portfolio to see the diversity and scale of their clientele. Top agencies often work with clients across various industries, from small startups to large enterprises. This indicates their ability to adapt their strategies to different business needs.
Case studies and success stories
- Look for detailed case studies and success stories demonstrating the agency’s ability to achieve measurable results. Successful case studies often include specific metrics such as lead generation numbers, engagement rates, and ROI.
- Range of Services
Content creation
- Ensure the agency provides comprehensive content creation services, including article writing, post creation, and multimedia content like videos and infographics, tailored for LinkedIn’s professional audience.
Ad campaign management
- Top agencies should offer robust ad campaign management services, including creating, monitoring, and optimizing LinkedIn Ads. They should also be adept at targeting specific demographics and industries.
Profile optimization
- The agency should offer services to optimize LinkedIn profiles for businesses and individuals. This includes enhancing profile sections, effectively utilizing keywords, and making profiles more attractive to potential clients and employers.
Lead generation
- Effective lead-generation strategies are crucial. The agency should demonstrate a proven track record of generating high-quality leads through LinkedIn.
- Reputation and Reviews
Client testimonials
- Positive client testimonials and reviews strongly indicate an agency’s reliability and performance.
Industry awards and recognitions
- Awards and recognitions from reputable industry organizations can testify to the agency’s excellence and expertise.
List of Top LinkedIn Agencies
Location
- Los Angeles, USA
Background
- Founded in 2003, it evolved from a web design firm to a full-service marketing agency.
Key Services
- LinkedIn Marketing
- Inbound Marketing
- Content Marketing
- SEO
- PPC
- Web Development
Notable Clients and Case Studies/Accomplishments
- They have worked with clients like IBM, PayPal, and Xerox, delivering significant improvements in lead generation and online visibility.
USPs
- Their expertise creates highly targeted LinkedIn campaigns that drive quality leads and significant ROI. They combine data-driven strategies with creative content to maximize engagement.
Testimonials
- “310 Creative helped us redefine our LinkedIn strategy, resulting in a 200% increase in qualified leads within six months.” -
Marketing Director, IBM.
Best for
- Their SEO and HubSpot integration might be the best fit for businesses needing integrated marketing solutions.
Location
- Iowa City, IA, USA
Background
- Founded to help B2B marketing and business leaders acquire and delight customers, Sculpt uses social media to stay top-of-mind online. They emphasize building relationships with customers through robust analytics and targeted content.
Key Services
- Social media strategy and consulting
- Social media community management
- Paid social campaigns
Notable Clients and Case Studies/Accomplishments
- Sculpt has worked with Blend.com, helping distribute long-form content pieces effectively during various campaign ramp-ups. Their collaboration led to elevated campaigns outperforming baseline ones on CPC and CPL against ABM target accounts, achieving up to a 50% higher CTR.
USPs
- Sculpt is known for its ability to repurpose pillar content into high-production-value creative that results in impactful campaigns. It is designed for established enterprise B2B brands.
Testimonials
- “Sculpt’s ability to repurpose content and deliver high-quality creative for impactful campaigns is unmatched.”
- Blend.com
Best for
- Comprehensive LinkedIn advertising and tailored content strategies.
Location
- Los Angeles, CA, USA
Background
- Cleverly focuses on LinkedIn lead generation and paid advertising, catering to a diverse client base. They offer LinkedIn lead generation services, including content marketing, creation, paid advertising, and recruiting.
Key Services
- LinkedIn lead generation
- LinkedIn paid advertising
- LinkedIn candidate recruiting
- White-label lead generation
Notable Clients and Case Studies/Accomplishments
- Cleverly helped Bambee, a dedicated HR service provider, by crafting clear, persuasive messaging and using proprietary software to connect with thousands of LinkedIn users. This strategy generated 307 leads, 49 deals closed, and $100K in revenue in just 90 days.
USPs
- Cleverly is renowned for its personalized outreach campaigns, profile optimization, and data-driven strategies.
Testimonials
- “Cleverly’s strategy and execution resulted in many leads and deals closing quickly.”
- Bambee
Best for
- Offers strong lead-generation services with personalized approaches.
Location
- Tallinn, Estonia
Background
- Founded by Dylan Hey in 2019, Hey Digital focuses on helping B2B SaaS companies grow through paid media and conversion rate optimization.
Key Services
- Google Ads Management
- LinkedIn Ads Management
- Facebook Ads Management
- Conversion Rate Optimization (CRO)
- PPC Campaign Management
Notable Clients and Case Studies/Accomplishments
- With their tailored strategy, Hey Digital helped Swipesum achieve impressive results. Within three months, Hey Digital helped them save $5,400 from fraudulent clicks, increase conversions by 500%, and decrease ad spend by 17%. The company now benefits from more efficient ad campaigns and significantly improved conversion rates.
USPs
- Specialization in B2B SaaS companies
- Comprehensive paid media strategies
- Proven track record of significant ROI improvements
- Tailored CRO strategies to maximize conversions
Testimonials
- “The quantifiable ROI from working with Hey Digital for us was an enormous decrease in Cost Per Lead. It was 4x the amount before we hired Hey Digital.”
- Claire Peña, VP of Marketing at Stream.
- “I would definitely recommend Hey Digital to any SaaS marketers. They have a great understanding of metrics and can help with new campaigns and refreshing old ones.”
- Ellen Kraemer, Marketing Manager at Cord.
Location
- Frederick, Maryland, USA
Background
- New North was established to assist B2B technology companies in achieving their marketing goals through innovative strategies and personalized services.
Key Services
- Account-Based Marketing (ABM)
- Content Creation (blogs, podcasts, videos)
- Paid Media Campaigns (PPC, display ads, social media)
- Comprehensive Reporting and Analytics
Notable Clients and Case Studies/Accomplishments
- With their tailored strategy, New North helped Swipesum achieve impressive results. Within three months, New North helped them save $5,400 from fraudulent clicks, increase conversions by 500%, and decrease ad spend by 17%. The company now benefits from more efficient ad campaigns and significantly improved conversion rates.
USPs
- Focus on B2B tech marketing
- Customizable service mix to meet specific client needs
- Transparent and collaborative approach with 24/7 client portal access
- Experienced team with a blend of in-house and agency backgrounds
Testimonials
- “New North transformed our digital advertising and demand generation efforts, exceeding expectations with its clean processes and smart strategies.”
- Toby Phillips, VP at Kolbe Corp
Location
- Cape Coral, Florida
Background
- Impactable, founded in 2016, specializes in LinkedIn advertising. Known for its expertise in LinkedIn Ads, Impactable helps businesses optimize their LinkedIn advertising strategies to drive growth and improve ROI. The agency is recognized for its data-driven approach and innovative techniques in the LinkedIn Ads space.
Key Services
- LinkedIn Ads Account Management
- LinkedIn Ads Strategy and Consulting
- Advanced Bidding Techniques
- Audience Targeting and Segmentation
- A/B Testing and Optimization
- Ad Scheduling and Campaign Management
Notable Clients and Case Studies/Accomplishments
- Successfully improved lead generation and conversion rates for clients across various industries.
- Achieved significant cost efficiencies and high ROI for LinkedIn advertising campaigns.
- Known for scaling LinkedIn ad programs and enhancing overall campaign performance.
USPs
- Specialized focus on LinkedIn advertising
- Extensive experience with LinkedIn Ads campaigns
- Data-driven strategies and proprietary tools
- Proven track record of optimizing ad performance and achieving high ROI
Testimonials
- We were pleased with every facet of the services provided. - James Vetrano
Location
- Lehi, Utah, USA
Background
- Founded by AJ Wilcox in 2014, B2Linked specializes exclusively in LinkedIn advertising. AJ Wilcox has been recognized as a LinkedIn Ads expert and created the agency to help businesses leverage LinkedIn Ads effectively.
Key Services
- LinkedIn Ads Account Management
- Consulting
- Advanced bidding techniques
- Audience micro-segmentation
- A/B testing strategies
- Ad scheduling
Notable Clients and Case Studies/Accomplishments
- Improved user acquisition efficiency
- Achieved a 10X ROI through optimized campaigns
- Scaled LinkedIn ad programs effectively
USPs
- Exclusive focus on LinkedIn advertising
- LinkedIn Certified Partner
- Extensive experience managing large accounts
- Proprietary tools for ad management and scheduling
Testimonials
- “B2Linked is a really good investment. Acquiring their services made our business a lot more efficient.” - Bistra Angeuelova, Digital Marketing & User Acquisition at Hired.
- “The time invested upfront with the B2Linked team significantly cut down costs in the long run, resulting in a 10X ROI for our business” - Megan Nivens-Tannett, Founder & CEO at Flourish.
Best for
- Comprehensive LinkedIn advertising and tailored content strategies.
Location
- St. Louis, Missouri, USA
Background
- LeadCookie specializes in LinkedIn lead generation. Founded to help businesses generate quality leads through LinkedIn, it has developed a reputation for its systematic approach to outreach and engagement.
Key Services
- LinkedIn lead generation
- Profile optimization
- Personalized outreach strategies
- Email follow-up campaigns
Notable Clients and Case Studies/Accomplishments
- The agency has helped numerous B2B companies increase their lead generation by up to 300%.
USPs
- Systematic approach to LinkedIn lead generation
- Focus on building genuine connections and nurturing leads
- Proven methods to increase lead generation efficiency
Testimonials
- “Clients appreciate LeadCookie's thorough approach to lead generation and ability to deliver consistent results, highlighting significant increases in lead quality and quantity.”
Best for
- Offers strong lead-generation services with personalized approaches.
Comparative Analysis in a Snapshot
In a nutshell
Partnering with a specialized LinkedIn agency can significantly enhance your business’s presence and effectiveness on the platform. These agencies bring expertise, proven strategies, and a track record of success, making them valuable allies in achieving your LinkedIn marketing goals. Whether your objective is to increase brand visibility, generate leads, or recruit top talent, leveraging the services of a top LinkedIn agency can provide a competitive edge in the dynamic North American market.
While agencies can boost your LinkedIn presence, Factors introduces LinkedIn AdPilot—a revolutionary tool designed to harness data-driven insights for precise targeting and rapid ROI enhancement. Experience the transformation yourself by joining our beta program today and see how AdPilot can elevate your marketing strategy.

Top LinkedIn Agencies in Middle East
As the world's largest professional network, LinkedIn boasts over 830 million members globally, with a substantial and rapidly expanding user base in the Middle East. This platform transcends traditional social media by cultivating a professional environment where businesses and individuals can connect, network, and grow.
LinkedIn allows companies to maintain business continuity, engage with customers, and recruit talent despite physical constraints. It provides professionals opportunities to stay connected, share insights, and pursue career advancements in a rapidly changing job market.

Here’s why LinkedIn is a valued social media channel in the Middle East
LinkedIn's features, such as job postings, professional groups, and thought leadership content, align perfectly with the Middle East’s focus on economic diversification and innovation. As businesses and professionals navigate the new normal, LinkedIn stands out as a critical tool for sustaining and enhancing professional growth and business development in a digitally driven world.
In the Middle East, LinkedIn's importance is amplified due to the region's scale of economic activities and entrepreneurial spirit. The platform fosters knowledge sharing and collaboration across borders, contributing to a more integrated, growth-oriented, innovative business environment. Professionals in the UAE, Saudi Arabia, and other Gulf Cooperation Council (GCC) countries use LinkedIn to stay abreast of industry trends, engage in thought leadership, and explore new business opportunities. This regional vision is reflected in business partnerships, such as the India-GCC Business Partnership, which includes a database of over 1.8 billion people, offering both parties a vast customer base and market potential.
- Economic Growth:
The Middle East is experiencing rapid economic diversification and digital transformation, making LinkedIn an essential tool for business growth and professional networking.
- Professional Development:
Professionals in the UAE, Saudi Arabia, and other GCC countries use LinkedIn to stay ahead of industry trends, engage in thought leadership, and explore new business opportunities.
- Strategic Partnerships:
The platform facilitates knowledge sharing and collaboration across borders, fostering a more integrated and innovative business environment.
LinkedIn for Business
LinkedIn allows companies to establish a formidable online presence, share industry insights, and engage with a targeted audience. Through LinkedIn, businesses can showcase their products and services to an extensive professional network, boosting brand awareness and nurturing customer relationships. LinkedIn's advanced advertising solutions also allow precise targeting, ensuring marketing efforts reach the most relevant and high-value prospects.
TL;DR
LinkedIn is an indispensable platform for business growth and professional networking in the Middle East, mainly due to its alignment with the region's economic diversification and digital transformation goals. Professionals and businesses in the UAE, Saudi Arabia, and other GCC countries use LinkedIn for industry insights, networking, and exploring business opportunities. LinkedIn marketing strategically uses the platform for brand awareness, lead generation, and targeted advertising. Top LinkedIn marketing agencies in the Middle East, such as Nexa Digital, Ubrik Media, Prism Digital, Red Berries, and Spider Works, offer specialized services to enhance LinkedIn presence and engagement. Partnering with these agencies ensures businesses leverage LinkedIn’s full potential, driving growth and maximizing ROI.
But wait, what is LinkedIn Marketing?
LinkedIn marketing refers to the strategic use of LinkedIn as a platform for promoting a business, building brand awareness, and engaging with a professional audience. As a powerful tool in digital marketing, LinkedIn marketing includes a range of activities designed to exploit the platform's unique capabilities fully.
Key components of LinkedIn marketing through LinkedIn agencies in the Middle East:
- Profile Optimization
Ensuring personal and company profiles are professionally crafted to reflect brand identity and key messages. A well-optimized profile is a digital business card, making a solid first impression and enhancing credibility.
- Content Marketing
Creating and sharing valuable content, such as articles, posts, and videos, that engages the audience and establishes thought leadership. Consistent and relevant content keeps the audience engaged, drives traffic, and positions the business as an industry leader.
- Advertising Campaigns
Utilizing LinkedIn's targeted advertising options, including Sponsored Content, Sponsored InMail, and Text Ads, to reach specific professional demographics. These campaigns ensure that marketing efforts reach the right audience, maximizing ROI.
- Networking and Engagement
Building connections with industry professionals, participating in groups, and engaging with followers to foster relationships and drive business conversations. Active engagement helps build a robust professional network and opens doors for collaboration and business opportunities.
- Lead Generation
LinkedIn's tools and features, such as Lead Gen Forms and Sales Navigator, can be used to identify and connect with potential business leads. Effective lead generation strategies convert connections into customers, driving business growth.
LinkedIn’s popularity across different industries and sectors
- Technology & IT
Professionals and companies in IT and tech use LinkedIn to hire top talent, share innovations, and network with global tech communities.
Benefits: LinkedIn helps these companies stay at the forefront of industry developments and connect with key influencers.
- Oil & Gas
Given the Middle East's significant role in the oil and gas sector, LinkedIn is vital for networking opportunities, recruitment, and business development.
Benefits: Companies can engage with a global audience, highlight their contributions, and attract skilled professionals.
- Education
Universities and educational institutions use LinkedIn for outreach, alumni networking, and promoting educational programs.
Benefits: LinkedIn facilitates connections with prospective students, alumni, and academic peers, enhancing the institution's visibility and reputation.
- Healthcare and Pharmaceuticals
Professionals use LinkedIn to stay updated with industry advancements, share research, and connect with peers.
Benefits: The platform supports professional development and collaboration, driving innovation and sharing best practices.
- Finance and Banking
This sector utilizes LinkedIn for insights into market trends, recruitment, and establishing thought leadership through industry-related content.
Benefits: LinkedIn enables finance professionals to network with industry leaders, stay informed about financial news, and enhance their professional profiles.
Criteria for selecting top LinkedIn agencies in the Middle East
- Experience and Expertise
- Years in Operation
Agencies with a longer track record often possess extensive knowledge and experience in LinkedIn marketing. Longevity indicates stability and a proven ability to adapt to the dynamic media world.
- Specialization in LinkedIn Marketing
Agencies specializing in LinkedIn marketing demonstrate a deeper understanding of the platform's nuances. Unlike general digital marketing agencies, these specialists can provide more targeted and effective strategies.
- Client Portfolio
- Types and Sizes of Clients Served
A diverse client portfolio, including businesses of various sizes and industries, showcases the agency’s ability to cater to different needs. This versatility indicates adaptability and a broad skill set.
- Case Studies and Success Stories
Success stories and case studies provide evidence of an agency's impact and capabilities. They offer insights into the agency’s strategic approach, creativity, and effectiveness in achieving client goals.
- Range of Services
- Content Creation
Agencies proficient in content creation can develop engaging articles, posts, videos, and graphics tailored to the target audience. High-quality content is essential for building a strong LinkedIn presence and driving engagement.
- Ad Campaign Management
Effective LinkedIn ad campaigns require strategic planning, precise targeting, and continuous optimization. Agencies skilled in ad campaign management can maximize ROI and reach the desired audience.
- Profile Optimization
Ensuring client profiles are polished, professional, and optimized for visibility and engagement is crucial. Optimized profiles enhance credibility and attract more business opportunities.
- Lead Generation
Agencies with robust lead generation strategies and tools can help clients identify and nurture leads efficiently. Effective lead generation is critical for business growth and sales success.
- Reputation and Reviews
- Client Testimonials
Positive feedback from satisfied clients highlights an agency’s competence and reliability. Testimonials demonstrate the agency’s ability to deliver results and maintain strong client relationships.
- Industry Awards and Recognitions
Awards and recognitions validate an agency's capabilities and standing within the marketing community. These accolades are a testament to the agency’s excellence and industry leadership.
Why partner with a specialized LinkedIn marketing agency?
- Expertise and Experience: Specialized agencies deeply understand LinkedIn's unique features and can craft strategies specifically designed for professional networking and B2B marketing.
- Targeted Campaigns: These agencies can create highly targeted ad campaigns, ensuring your marketing efforts reach the most relevant and high-value prospects.
- Content Optimization: They provide expert content creation and profile optimization services that enhance your brand's visibility and credibility on LinkedIn.
- Lead Generation: With advanced tools and techniques, these agencies can effectively identify and nurture leads, driving business growth.
Here’s a list of the Top LinkedIn Agencies in the Middle East
- Location: Dubai, UAE
- Background: Established in 2005, Nexa is a leading digital marketing agency headquartered in Dubai, with additional offices in New York and Manchester. Nexa has gained recognition as a top provider of digital marketing solutions in the Middle East, particularly excelling in strategic LinkedIn marketing initiatives.
- Key Services
- LinkedIn Marketing
- Content Creation
- SEO and SEM
- Lead Generation
- Notable Clients and Case Studies: Nexa has collaborated with major brands such as Audi, Aramex, and Bosch. Their campaigns have significantly improved brand engagement and lead generation through targeted LinkedIn strategies.
- USPs:
- Nexa is a Diamond-tier HubSpot Partner, showcasing its proficiency in inbound marketing techniques, including LinkedIn marketing.
- It is also recognized as a Google Premier Partner, underscoring its expertise in Google Ads campaigns that complement LinkedIn's strategies.
- Nexa's LinkedIn marketing strategies are carefully data-driven, ensuring optimal results and ROI for clients.
- Industries: B2B Marketing, Education, Automotive, Healthcare, Hospitality, Real Estate, E-commerce.
- Location: Dubai, UAE
- Background: Ubrik Media was established to help businesses navigate the digital world effectively. The agency has grown to become a leader in digital marketing in Dubai, with a strong emphasis on results.
- Key Services:
- LinkedIn marketing and advertising
- Generation of traffic and leads
- Converting leads into customers
- Quantifying ROI for marketing activities
- Pacing with global market trends
- Increase in competition
- Retention of existing customers
- USP:
- Comprehensive digital marketing solutions with a focus on LinkedIn
- Proven track record of delivering high ROI by helping over 200+ brand
- Industries: Education & Direct Manufacturers.
- Location: Dubai, UAE
- Background: Founded over a decade ago, Prism Digital has consistently ranked among Dubai's top digital marketing agencies. They pride themselves on staying ahead of digital trends and delivering creative, result-driven campaigns.
- Key Services:
- LinkedIn marketing and advertising
- SEO and content marketing
- Social media marketing
- Web design and development
- Email marketing
- Notable Clients and Case Studies: Prism Digital has handled LinkedIn marketing for major UAE-based clients, significantly increasing their engagement and inquiries.
- USPs:
- Award-winning digital marketing strategies
- Expertise in leveraging LinkedIn for B2B marketing
- Strong focus on creative and innovative solutions
- Helps connect directly with industry decision-makers
- Industries: Hospitality, Real Estate, Pharmaceuticals.
- Location: Dubai, UAE
- Background: Red Berries was established in 2004 and has evolved from a creative agency into a full-service digital marketing firm. It is known for its customized and innovative digital marketing strategies.
- Key Services:
- LinkedIn marketing and advertising
- SEO and SEM
- Ad campaigns
- Content marketing
- Notable Clients and Case Studies: Red Berries has implemented successful LinkedIn campaigns for clients in multiple sectors, driving significant engagement and brand recognition improvements.
- USPs:
- Customized LinkedIn advertising plans
- Experts to help you
- Extensive experience in managing LinkedIn advertising campaigns
- Industries: Real Estate, Pharmaceuticals, Hospitality.
- Location: Dubai, UAE
- Background: SpiderWorks has established itself as a top LinkedIn marketing agency in Dubai. They focus on creating and managing effective LinkedIn marketing strategies that drive business growth.
- Key Services:
- LinkedIn marketing and advertising
- Content creation and management
- SEO strategy
- Analytics and optimization
- Notable Clients and Case Studies: SpiderWorks has successfully executed LinkedIn campaigns for clients in various sectors, leading to enhanced brand authority and increased lead generation.
- USPs:
- Precision targeting with LinkedIn marketing and outreach campaigns
- Expertise in crafting compelling LinkedIn content and building connections
- A data-driven approach to continuous improvement using consistent analysis and refinement
- Industries: Real Estate, Hospitality, Finance.
Selecting the right LinkedIn marketing agency can be crucial for businesses aiming to maximize their online presence and drive growth. That said, the necessity of partnering with a specialized LinkedIn marketing agency cannot be overstated. These agencies enable businesses and professionals to leverage LinkedIn's vast capabilities with precision and expertise. Companies can optimize outcomes and maximize return on investment (ROI) by prioritizing data-driven strategies.
Here’s how you can take a pick
Conducting thorough research into an agency's background, client portfolio, and industry recognition is the first step to making an informed decision. Here are some steps to consider:
- Review Client Portfolios: Look at the types and sizes of clients the agency has served. A diverse portfolio indicates the agency’s capability to cater to different needs.
- Examine Case Studies: Success stories and case studies provide insight into the agency’s strategies and their effectiveness in achieving client goals.
- Check Testimonials: Positive feedback from satisfied clients highlights the agency’s competence and reliability.
- Evaluate Industry Recognition: Awards and recognitions validate an agency's capabilities and standing within the marketing community.
Agencies specializing in LinkedIn marketing offer tailored services that maximize the platform's potential, from profile optimization to targeted advertising and lead generation.
LinkedIn remains a vital conduit for professional development and business innovation as the region participates in digital transformation.
While these agencies will help you up your LinkedIn game, we at Factors are launching LinkedIn AdPilot. This tool will help you unlock the power of data-driven insights to precisely target the correct accounts and rapidly enhance your LinkedIn ROI. Don’t just take our word for it; join our beta program today and discover how AdPilot can revolutionize your marketing strategy.

How to Use LinkedIn Ads for Customer Marketing
It’s no secret every company massively focuses on acquiring new customers. However, it’s equally important to focus on customer retention because acquiring new customers is five times more expensive than retaining existing ones.
But what’s the best way to drive customer retention and generate upselling opportunities? While most marketers would vouch for emails, we believe it’s LinkedIn ads 👀
Scroll ahead to learn how LinkedIn could be a valuable asset for your customer marketing initiatives ⬇️
Why use LinkedIn for customer marketing?
We know using LinkedIn ads might seem unusual, especially when it’s easier and more feasible just to send emails to your existing customer base. But we’ve identified a few shortcomings with this approach:
- For starters, your emails would only reach 1-2 contacts in an account instead of the entire buying committee. If you want to encourage your customer to consider upgrading their plan, targeting the relevant folks via your ads would be easier.
- Even when you do send emails to your customers, there’s a high chance your emails will remain unopened and they’ll be unaware of the content within.
LinkedIn is a surefire way to reach your stakeholders without cluttering their inboxes and ensuring they’re aware of your latest features. Now, let’s look at how you can use ads to reach them.
Measure product usage data
Every customer uses your product differently. While some see your tool as a holy grail in their tech stack, others might not be as dependent on it. You need to analyze product usage to understand how frequently customers use your product in their daily activities. You can also leverage NPS surveys to gauge their satisfaction with your tool.
We recommend running LinkedIn ads based on their probability of churn and the number of days to contract expiry. For example, if you notice low product usage for a specific set of accounts, you can increase the frequency at which you show them ads.
You can also prioritize showing ads to customers based on how they rate your tool on your NPS surveys. If customers rate your tool as 7 or below on NPS surveys, you can target these accounts with ads that showcase your product’s differentiators.
Phew, that sounds like a lot of conditions for running ads. Imagine manually creating multiple audience lists for each campaign goal and tracking their ROI. Seems exhausting 🥱
What if we told you that we have a solution that makes running and optimizing LinkedIn ads a breeze?
Presenting: AdPilot by Factors, your one-stop solution to supercharging LinkedIn ads ROI.
Here’s how you can use AdPilot to increase upselling opportunities:
Audience Builder can help you target the right customers with your preferred criteria. For example, if you want to target all accounts that have logged in less than five times you can create a segment on Factors and import it to Campaign Manager.

But remember, not all customers are equal – you’d naturally want to show more ads based on churn propensity. *sigh* If only you could control how your ads are shown, right?
Well, with Smart Reach you can!
Marketers can use Smart Reach, to control ad exposure across their target account list. You can show your ads based on the number of days till contract renewal and churn score, which is calculated by analyzing NPS scores and product usage. Here’s a visual explanation of the same:

Let’s dive deep into how we use Smart Reach at Factors to control exposure to our ad campaigns:
- Currently, all our customers are capped at 500 impressions per month
- For customers where renewal is less than 3 months but churn probability is low - we increase to 1000 impressions to keep them aware of our new product upgrades
- Regarding customers where renewal is less than 3 months and churn probability is medium, we raise the cap to 1500 impressions to further drive home the point about how our product is the ideal solution for all their pain points
- For customers whose renewal is less than 3 months and whose churn probability is high, we increase the cap to 3000 impressions and run ads based on our customers' success stories to boost credibility.
We follow a similar pattern when showing ads based on the number of days till contract expiry, wherein we increase the number of impressions for accounts as they get closer to their contract end date.
As we adjust the frequency cap for all these accounts, we ensure that ads are only shown to relevant customers without causing ad fatigue.
If you want to measure how customers take action after viewing your ads, you can use True ROI. With view-through attribution, you can clearly see how seeing an ad impacts their decision to use the product.
Here’s a report that shows how many people decided to log in after viewing an ad:


With our CAPI integration, you can optimize your ad efforts by only showing your ads to customers at churn risk or reaching contract expiry. Here’s how you can set up CAPI to target your ads to customers who have not logged in for more than a month:

When running ads for customers, we recommend showcasing your best testimonials and case studies case studies to boost credibility for your product. Here’s an example of how Gong uses customer reviews in their ads:

Wrapping up
Customer marketing should be a critical part of your marketing strategy, but many marketers neglect it or send a couple of emails occasionally. Leveraging LinkedIn ads is a great way to keep your customers aware about how they can make the most of your product. Speak to our team today to learn how AdPilot can 2x your LinkedIn ROI.

A 3-Step Demand Generation Framework to Drive More Revenue
George Coudounaris is the founder of The B2B Playbook and host of their top-rated B2B marketing podcast. Here’s his 3-step Demand Generation Framework to help marketers drive up to 80% more pipeline for their organization.
Demand Generation is often vaguely described and confused with brand marketing, lead generation, and performance marketing. It has become a buzzword that leads to tactics that rarely drive consistent results.
Demand Generation is a go-to-market strategy that builds an intense desire in a prospect to buy from you. It should do two things:
- Make your Dream Customer prioritize their problems in the way you solve it
- Lead them to the logical conclusion that you’re the perfect company to solve the problem for them
We show you how to do this with our 3-step Demand Generation Framework. It has taken companies from being largely sales-led to marketing, driving up to 80% of their pipeline.

Step 1 - BE Ready: Deeply understand your customers
Every organization is limited by budget, resources, and time. If we are going to go deep into a market, get them to trust us, and convince them to buy from us - we need to go deep into a segment of a market. If we go wide and shallow across the whole market, we won’t have enough touchpoints to build that trust and get them to buy. This is backed by data from Dreamdata, which shows that the average B2B customer journey has 62.4 touches across 3.6 channels and involves 6.3 contacts over 192 days.
That’s why step 1 of our Demand Generation framework starts with defining who your Ideal Customers are (your ICP). We recommend conducting an 80/20 analysis to identify who they are.
Ask yourself, who are the 20% of customers driving 80% of our revenue or profit? Which ones are the best fit for our business?
Identify their firmographics and demographics, with the goal of being able to find common traits. Once you identify who these best companies are, you should conduct customer interviews with them to understand:
- What great pains do you help solve for them
- How does it help with their jobs to be done (JTBD)
- What does their buying journey look like
- Who is the buying committee made up of
- What sources of information do they trust
- Where do they hang out online and offline
From here, you should have the information you need to identify your best customers, why they chose you over the competition, what you had to say to them to make them a customer, and where more customers (just like them) are hanging out.
Once you’ve done this, make sure that you document your ICP and the buying committee, and have noted what the typical buying journey looks like. This is your roadmap for winning new customers in the same segment as your ‘best’ customers.
Your next steps should then be to reposition your brand to make it obvious that you’re the ‘perfect fit’ for your future prospects in the segment that you’ve targeted. Then, of course, update your messaging across all your assets to reflect this (your website, LinkedIn, case studies, sales enablement content, etc.).
The comprehensive list of steps in stage 1: BE Ready are:
- Conduct 80/20 analysis
- Interview Dream Customers
- Document Ideal Customer Profiles (ICP)
- Update your Positioning and Messaging
- Map the Buying Journey
- Create your Dream 100 sources of influence
Step 2 - BE Helpful: Build relationships with helpful content
Once you’ve completed Stage 1 of our Demand Generation framework, you’ll have a deep understanding of the segment you’re targeting. You should also have gathered the information you need to build their trust and convert them from prospects to potential buyers.
Stage 2 is where we build the content that guides them through the buying journey. Our favorite framework for this is called ‘The 5 Stages of Awareness’. It takes a prospect from being ‘unaware’ that they even need your product or service to being led to the logical conclusion that you’re the perfect fit for them.

Your job is to create content that hits every stage of awareness. This should answer questions that they have at each stage and help them to progress to the next in their buying journey.
The 5 Stages of Awareness are:
Unaware: At this stage, potential customers are not even aware that they have a problem or a need that your product or service can address.
Problem Aware: Here, customers realize they have a problem but may not know the solutions available.
Solution Aware: Customers are aware of various solutions to their problem but may not be familiar with your specific product or service.
Product Aware: In this stage, customers know about your product or service but are still comparing it with other options in the market.
Most Aware: Finally, customers are fully aware of your product, including its benefits and how it compares to competitors. They are on the brink of making a purchase decision.
We highly recommend that you create this content in partnership with Subject Matter Experts. This will ensure that the content you create is of far higher quality than if you hired a freelancer with no industry or technical expertise to write it.
The complete list of steps in Stage 2 - ‘BE Helpful’ is:
- Understand how to help your ICP
- Create helpful content that educates and entertains
- Map your content to the 5 Stages of Awareness Framework
- Use Subject Matter Experts to create pillar content with on a regular schedule
- Repurpose this content to multiple channels for ease of consumption for your ICP
- Distribute your helpful content wherever it is your ICP is present
- Scale your content production
- Improve with quantitative and qualitative data
The process of repurposing content is important to help scale this content production engine. It allows you to create a high volume of extremely useful and relevant content while using as few resources as possible.
In my experience, most businesses don’t execute ‘Be Helpful’ properly because they miss one or several of these above key steps.
Many marketers also have their demand generation programs canceled because they don’t understand how to measure the leading and lagging indicators of success. It is going to take some time before your Demand Generation Engine is driving consistent pipeline, so you need to know how to prove to leadership that you’re on the right track and should not give up.
💡We give you our demand generation metrics to measure here.
Step 3 - BE Seen: Accelerate demand with paid media & ABM
I get very excited for marketers and teams when they have done the hard work in stages 1 and 2 and then reach Stage 3 - BE Seen. That’s because ‘BE Seen’ is all about distributing your content in front of your prospects that you’re targeting. You should have a great idea of who they are (i.e., the buying committee) and where they’re hanging both online and offline based on the research you’ve done.
There are 3 key ways that you can communicate with your future prospects:
- 1:Many (paid ads, organic social, YouTube, forums, etc.)
- 1:Few (conferences, round-tables, webinars, events, associations)
- 1:One (email, call, text)
The way I see it, marketing is typically equipped to handle 1:Many and 1:Few really well. Sales are normally best at 1:One. The content and messaging that you use across these, though, should largely be the same. You can just tailor the conversation further when you’re dealing with fewer people.
At this stage, you can also accelerate demand with Account Based Marketing (ABM). This is about identifying companies that are expressing interest in your product but haven’t actively raised their hand for a demo. By placing them into an ABM sequence, you have a series of orchestrated actions between sales and marketing to try to accelerate their demand and turn them into paying customers.
You can identify these companies based on their engagement in all of your different channels. We love using Factors.ai to help us get this information and then place these companies in an ABM motion.
The complete list of steps in stage 3 are:
- Use paid media to target the buying committee of key accounts
- Push educational content mapped to 5 Stages of Awareness
- Push product education content highlighting key benefits and features
- Focus on target accounts with low budget, high touch Account Based Marketing (ABM) pilot program
A word of advice
This Demand Generation Framework forces you to do the ‘hard work’ that so many skip. Demand is not generated by testing a bunch of different tactics and hoping something works. It’s built by deeply understanding your segment and helping your Dream Customers get to where they need to go.
This can be distilled into a plan to generate demand and a series of actions that the marketer must complete every week and commit to if they’re going to see results.
If you’d like the in-depth strategy, templates, and tools to execute our Demand Gen Framework in your business, check out our 12-week demand generation course.

How to use LinkedIn ads to Support SDR Outbound
B2B sales is a long and arduous process. Leading prospects from “Qualified Lead” to “Closed won” is a trying ordeal for even the best SDRs. So, what’s the best way to fast-track these deals?
Two words: LinkedIn ads.
Instead of having your sales reps constantly follow up with “just checking in” emails, you can leverage the power of your ad campaigns to drive consideration for your product as they’re talking to your sales team.
Let’s dive into how you can use LinkedIn ads to support your outbound efforts ⬇️
Streamline your ABM with account engagement data
As you know, ABM typically involves marketing and sales aligning on a target list of accounts and then reaching out to them parallelly via sales outbound and marketing campaigns. However, the way marketers implement this process leaves much to be desired.
For example, if someone replies to your sales email, they’d naturally have higher buyer intent than someone who simply leaves your emails unopened. Would it make sense to show ads to prospects that aren’t interested in your solution? Moreover, you have no control over how your ads are shown to accounts in this list. For instance, you’d naturally want to show more ads to accounts in the SQL stage rather than ones already in negotiations.
Rather than spreading your LinkedIn impressions uniformly across all accounts in the target account list, it is wiser to focus most of your ad spend on accounts showing more intent. You can use account engagement data to tailor your ads based on how far they’re along the sales funnel. To achieve this, you must invest in a tool that consolidates all your CRM data and turns it into actionable insights for your ad strategy.
Here’s how you can use Factors AdPilot to interpret your account data, optimize your LinkedIn ads, and move prospects across the funnel:
Show ads based on sales engagement
While your prospects engage with your sales rep, you can target the buying committee by adding them to a sequential ad campaign and showing how your features effectively solve their problems.
You can use Audience Builder to target the right accounts per your campaign objectives. For example, if you want to target all accounts that have completed a demo call, you can create a segment on our platform and import it to LinkedIn Campaign Manager.
However, you should also limit the number of times you show them ads to avoid ad fatigue. Unfortunately, LinkedIn doesn’t yet have a feature that allows you to control the ad frequency at an account level. Lucky for you, Smart Reach can make it happen!
Smart Reach allows you to cap the number of impressions shown to specific accounts. Find out how we use Smart Reach at Factors to control ad exposure:
- Every account in the target account list (agreed on by marketing and sales) gets 500 impressions per month.
- If the account replies to an email or starts showing website activity, we bump up the impressions for them to 1500
- If a deal is booked we increase the impression cap to 2500 and by 1000 for every stage in the deal funnel.
This approach results in better sales and marketing alignment and allows you to target your account list better.
If you want to know whether your ads are truly working, it’s True ROI to the rescue. Thanks to view-through attribution, you get a complete overview of how prospects interact with your ads and make buying decisions.
Here’s a report that shows how many prospects view your ads and visit your website after a demo call:

You can also use our CAPI integration to send your conversion data from your website and CRM to LinkedIn. For example, you can send data of users who respond to sales emails to optimize your campaigns better:
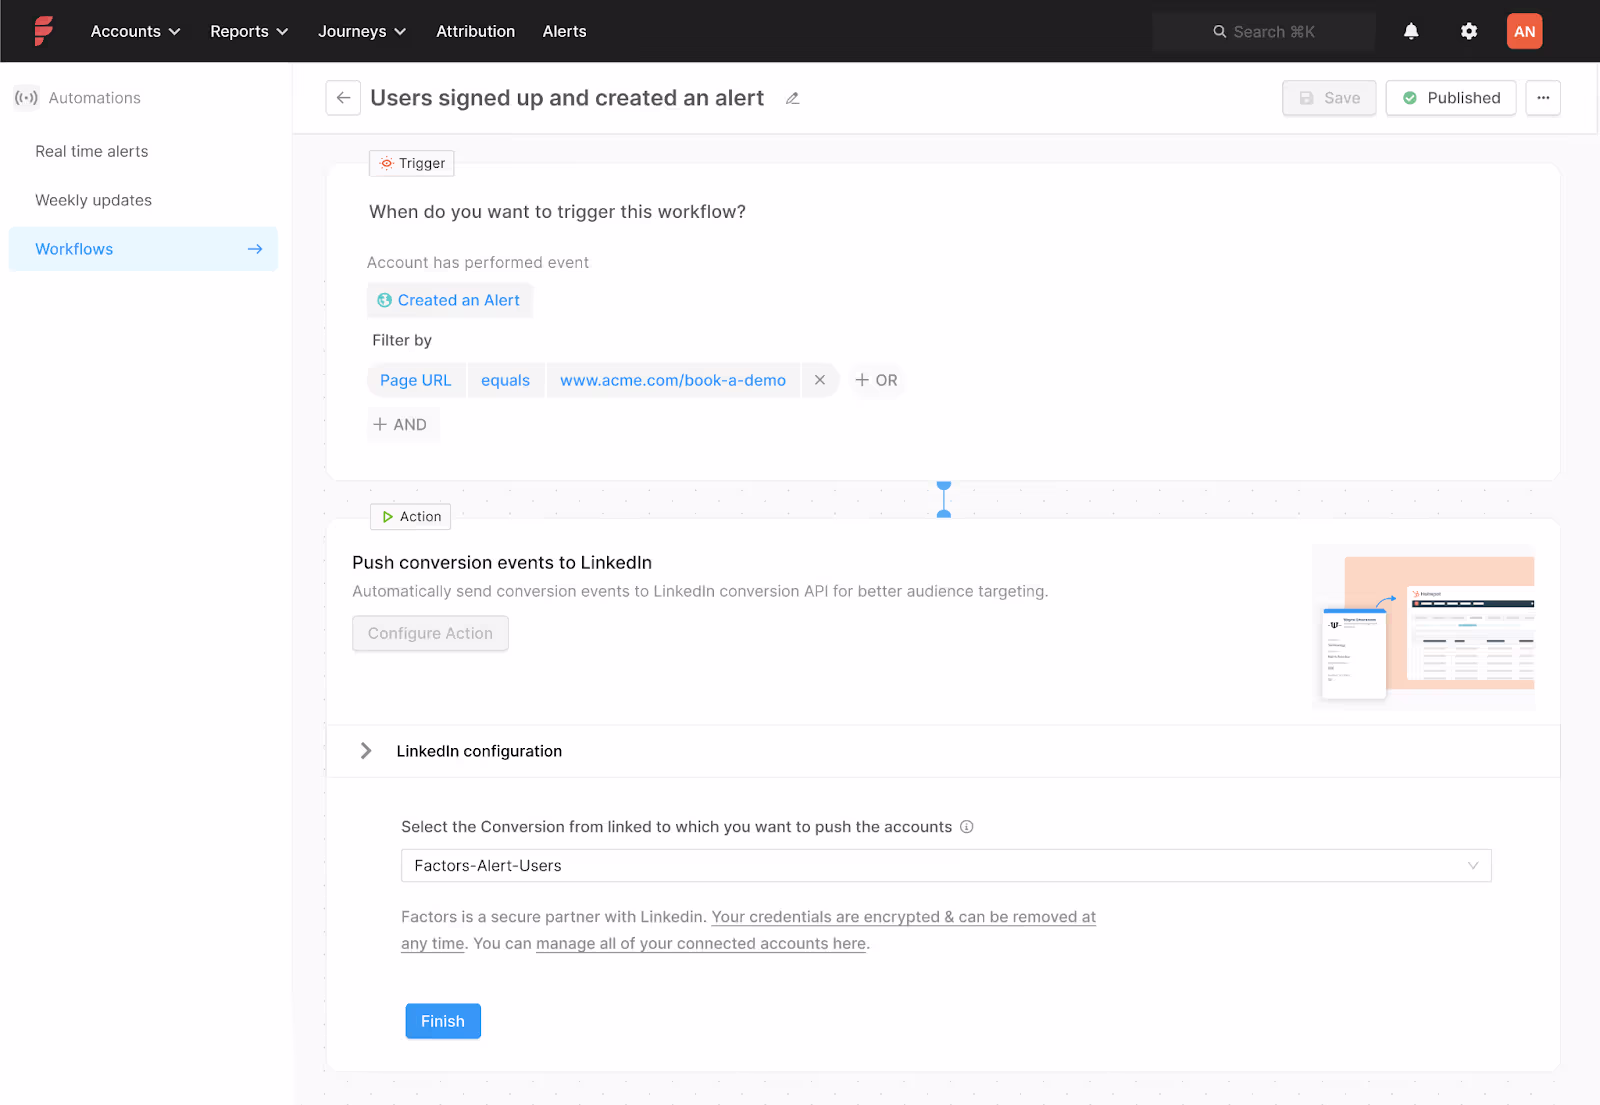
Wrapping up
Outbound Sales can be daunting, but simultaneously running LinkedIn ads makes it easier. When you target your ads to prospects according to how they’re engaged with sales, you can speed up your sales process without seeming pushy. Speak to our team today to learn how AdPilot can help you supercharge your ad campaigns and close deals in no time.

10 Marketing Automation Trends To Learn And Copy In 2025
Feeling overwhelmed by the constantly changing world of marketing automation? This article curates 10 cutting-edge marketing automation trends you can implement right away. These trends will help you enhance customer engagement, streamline operations, and boost your ROI.
By the end of this read, you’ll know which trends fit well with your business goals. You’ll have the actionable knowledge to implement them and stay ahead of the competition. Let’s get into it.
TL;DR
- AI-powered insights and predictive analytics optimize marketing funnels and reduce churn.
- Smart chatbots, voice shopping, and email drip campaigns enhance customer engagement.
- Personalization and omnichannel marketing improve user experience and conversions.
- Mobile-first and social media automation ensure consistent branding and outreach.
10 Proven Marketing Automation Trends To Follow In 2025

75% of marketers report increased ROI within a year of implementing automation. To understand how they do it, let’s dive into these 10 innovative trends.
1. Stay On Top Of The Funnel With AI Insights
Leveraging AI for sales funnel insights is one of the latest marketing automation trends. AI eliminates the need for manual pivot tables and labor-intensive data manipulation.
Today, you have tools like Factors.ai to deep dive into the buyer’s journey. These tools aggregate customer interactions with path analysis and timelines, helping you understand what works at each stage of the buyer's journey.
Moreover, you get weekly insights that highlight funnel performance and predict drop-offs. This approach increases your chances of converting leads into the pipeline.

2. Smarter Chatbots
Chatbots save time and reduce your annual customer service costs by up to $8 billion. Use chatbots on your websites, social media, and messaging apps for tasks like:
- Order tracking
- Answering FAQs
- Product recommendations
You can also use chatbots during high-traffic periods. Or when live support isn't available to provide 24/7 assistance. They are particularly effective in eCommerce to guide your users in the purchasing process.
Additionally, chatbots collect and analyze data from customer interactions. This gives valuable insights into customer preferences. So, consider integrating chatbots into marketing platforms, CRM systems, and social media channels. It will ensure a unified and automated customer experience across all touchpoints.

While you are using chatbots, make sure to have a customer service team to handle complex issues that require a human touch. Agents can handle sensitive situations, and offer personalized solutions that chatbots can't. Use platforms like Upwork or Genius to hire skilled professionals who can manage escalations, and build customer relationships over time.
3. Shop With Your Voice
71% of consumers use voice assistants to research products. With the use of smart devices like Amazon Echo, Google Home, and Apple's Siri, voice-based shopping is becoming more accessible. These devices integrate seamlessly with online shopping platforms. So that users can browse, compare, and purchase products using simple voice commands.
Voice-based shopping reduces the steps required to complete a transaction. Users can add items to their cart, check out, and confirm orders all through voice commands. This efficiency reduces friction in the buying process. It’s one of the reasons the voice shopping market is expected to reach $40 billion by 2024 in the U.S. alone.
You can implement voice shopping with these 5 strategies:
- Ensure your product listings and website content are optimized for voice search.
- Partner with platforms like Amazon Alexa, Google Assistant, and Apple's Siri for voice-based shopping.
- Use data from voice interactions to personalize recommendations and offers.
- Streamline the checkout process to make transactions via voice commands quickly.
- Leverage analytics tools to gain insights from voice interactions. It will help you refine your marketing strategies and better understand customer needs.
4. The Power Of Predictive Analytics
Gartner predicts that by 2024, 75% of businesses will use predictive analytics in their marketing strategies. When you analyze past behaviors and patterns, you can predict what products your customers will want. Then, you can tailor your marketing strategies accordingly.
Predictive analytics not only helps in acquiring new customers but retains existing ones. It helps you identify at-risk customers and understand the factors that contribute to churn like:
It provides insights into the factors contributing to customer churn, such as:
- Dissatisfaction with a product
- Lack of customer engagement
- Better offers from the competitors
- Poor customer service experiences
- Unmet expectations by your product or service.
With this information, you can take proactive measures to retain your customers like:
- Address product issues promptly to improve satisfaction.
- Implement strategies to re-engage customers through targeted campaigns.
- Create attractive offers to counter competitors' deals and retain your customers.
- Train your support team to provide excellent service and resolve issues efficiently.
- Ensure your marketing efforts set accurate expectations to prevent dissatisfaction.
5. From Data To Dialogue: Generative AI At Work
Generative AI can deliver 30% to 50% efficiency. It can create new content by learning from existing data. For instance, GPT-4 can generate blog posts, social media updates, and personalized emails that sound human-like. It mimics human creativity. You can produce large volumes of content quickly using AI tools. This process is also cost-effective.
Applications In Marketing:
- Generative AI can automate your content creation process. Create articles, product descriptions, and social media posts.
- Generative AI can create personalized content that resonates with individual preferences.
- You can tailor AI-generated ad copy to different audience segments.
- Tools like DALL-E, also by OpenAI, can generate unique images and graphics. It gives marketers fresh and innovative visual content.
6. Nurture Leads On Autopilot With Email Drip Campaigns
Businesses using automated email campaigns see a 320% increase in revenue. These pre-scheduled emails nurture leads, onboard new customers, and re-engage inactive subscribers.
Start by segmenting your audience based on behaviors, preferences, and purchase history. Then, personalize content so that it resonates with each segment. This increases open and click-through rates.
Drip campaigns are perfect for guiding potential customers through the sales funnel. They also keep your audience engaged with consistent, and relevant communication. For new customers, automate onboarding sequences to ensure a smooth brand introduction.
Additionally, use drip campaigns to re-engage inactive subscribers with targeted messages. The automation behind drip campaigns frees up your marketing team to focus on strategic initiatives.
A great example is Going’s highly personalized, automated emails. Each email contains the flight deals tailored to the subscriber’s preferred departure airports and destinations. This ensures better chances of relevance and high engagement.

7. Get Personal With Your Marketing
80% of consumers prefer to buy when brands offer personalized experiences. Moreover, personalized emails deliver 6x higher transaction rates compared to non-personalized emails. So, personalize your marketing content to make your emails, ads, and website experiences feel relevant.
This added relevance increases open rates, click-through rates, and ultimately, sales. For instance, personalized email subject lines can boost open rates by 26%.
To achieve this, leverage tools like CRM systems and marketing automation platforms like Hubspot. They offer segmentation and content capabilities to automate sending the right message to the right person, at the right time.
5 Creative Strategies To Get Personal With Your Marketing
- Use customer purchase history to send personalized product recommendations.
- Send personalized emails with special discounts on customers' birthdays.
- Create location-based offers like local events or weather-related products.
- Set up automated emails when a customer abandons carts, or sign up for newsletters.
- Use dynamic content in emails to display different images, text, or offers based on individual recipient preferences.
A prime example of this is website product recommendations. For example, if you’re browsing an online store and come across a tailored dress shirt. As you view this product, the website dynamically generates a "You May Also Like" section. This section features similar shirts in different colors or sizes.

This personalized approach increases the likelihood of additional purchases by presenting items that align with your buyers’ interests.
8. Automated Social Media Marketing
Businesses that automate their social media marketing see a 25% boost in sales conversions. That’s because automation maintains a consistent and engaging online presence. And that with minimal manual intervention. Here’s a step-by-step guide on how to implement automated social media marketing.
8.1 Plan & Schedule Content
Automate your content calendar by scheduling posts in advance.
- Create a content calendar to organize your posts for the week or month. This includes captions, images, and hashtags.
- Schedule posts using tools like Hootsuite or Buffer to schedule your content. These tools let you set specific times and dates for your posts. This ensures your posts go live when your audience is most active.
8.2 Automate Engagement
Automate routine interactions to keep your followers engaged.
- Use tools like ManyChat or Sprout Social to automate responses to common queries. You can also set up automated instant replies for common comments and direct messages.
8.3 Analyze Performance
Understand how your content performs to refine your strategy. Automated social media marketing tools come with analytics features that track performance metrics. For example, likes, shares, comments, and click-through rates.
- Use Sprout Social and Hootsuite to track key metrics like engagement rates and click-through rates.
- Use these tools to generate custom reports. They give insights into what’s working and what needs improvement.
8.4 Target Your Advertising
Automate your ad campaigns to reach the right audience with the right message at the right time.
- Use Facebook Ads Manager to create and manage ads, make sure to set targeting parameters, and optimize your ad spend.
- Use Google Ads to automate your search and display ads. This way you will target specific demographics and interests to maximize ROI.
8.5 Maintain Consistent Branding
Gen Z adults in the US are willing to shop on TikTok, YouTube, and Instagram. So, maintain a consistent brand image across all platforms for recognition. Automated tools ensure that your posts adhere to your brand guidelines. They also give a unified and professional appearance.
- Automate posting with tools like Later to keep your visual content consistent and aesthetic.
9. Full-funnel Omnichannel Marketing For A Unified Shopper Experience
Marketers who use three or more social marketing channels see a 287% higher purchase rate compared to those using single-channel campaigns.
Customers can interact with your brand across multiple channels and marketing funnel stages. While this variety offers incredible opportunities to expand your reach. It also gets challenging to give a unified experience across all touchpoints. That's why omnichannel marketing is a major marketing automation trend for 2025.
Creating a seamless experience across various channels and funnel stages to meet customer expectations. Given the complexity, automation is crucial for implementing omnichannel marketing successfully. Use tools like Factors.ai to get insights into every stage of your funnel, including impressions, clicks, and website traffic.
A great example of full-funnel omnichannel marketing is Transparent Labs. They use a mobile app that customers can download by scanning a QR code available on their website and packaging. This app provides personalized product recommendations and exclusive offers.

They also leverage social media marketing to share user-generated content and promote their products on Instagram, Facebook, and Twitter. They also use chatbots on their website to handle common customer queries. It gives instant customer support.
10. Optimize Campaigns With Mobile-Optimized Marketing
60% of global website traffic comes from mobile devices, and this number is only expected to grow. As consumers increasingly rely on their smartphones for shopping, you must optimize your marketing strategies to cater to this trend.
Deliver tailored messages and offers directly to users through mobile apps and push notifications. Personalized push notifications increase engagement by 9.6 times compared to generic messages. This level of personalization helps build stronger relationships with customers and boosts conversion rates.
Moreover, leverage Google Ads, Facebook Ads Manager, and mobile-specific platforms like AppsFlyer to create and manage projects for mobile-centric campaigns. These tools provide analytics to optimize your strategies for better results.
Besides tools, you can use a texting service like DialMyCalls to send promotional text messages in bulk. Select your specific niche from their catalog like eCommerce business texting, church texting, or school texting. Then, you can send SMS campaigns to your entire contact list in just minutes. Afterward, you'll receive a campaign performance report that tells you what happened with each text message that was sent.
Marketing Automation Tools You Should Use In 2025
Evaluate each tool based on your specific needs, goals, and budget. Make sure you take advantage of free trials to test the functionality and ease of use.
I. Factors.ai: Ideal For Data-Driven Marketing Optimization

Factors.ai identifies customer drop-offs and refines demand-generation strategies. Use it to aggregate customer interactions, perform path analysis, and optimize your marketing efforts with actionable data.
Key Features
- Optimize return on ad spend RoAS with AI-led insights.
- Re-engage with returning accounts to boost conversion rates.
- Funnel optimization to reduce customer acquisition costs (CAC).
- Target high-intent accounts to drive more effective marketing campaigns.
II. HubSpot: Comprehensive Marketing Automation

HubSpot continues to be a leader in the marketing automation software market. It helps manage your entire marketing funnel with an all-in-one platform. It integrates email marketing, social media management, CRM, and analytics seamlessly. Use HubSpot to centralize your marketing activities, enhance campaign tracking, and gain deeper customer insights.
Key Features
- Personalized email campaigns with advanced segmentation.
- Seamless integration with HubSpot CRM for better customer management.
- Detailed insights into marketing campaign performance and customer behavior.
- Schedule and manage social media posts across multiple platforms.
III. Marketo: Advanced Automation for Enterprise

Marketo, now a part of Adobe, is ideal for larger enterprises looking for advanced marketing automation solutions. It optimizes email marketing and personalized customer journeys. Use Marketo to automate complex workflows, and improve lead nurturing.
Key Features
- Comprehensive lead scoring and nurturing capabilities.
- Data-driven insights to optimize marketing strategies.
- Personalized marketing for key accounts.
- Advanced email personalization and automation features.
IV. ActiveCampaign: Perfect For Small To Mid-Sized Businesses

ActiveCampaign combines email marketing, sales automation, and CRM to personalize customer interactions. Its advanced segmentation and automation capabilities are standout features. Use ActiveCampaign to deliver tailored marketing messages and automate customer workflows.
Key Features
- Automated email sequences and personalized content.
- Integrated CRM to manage customer relationships and sales.
- Tools to enhance customer journey and engagement.
- Track and analyze campaign performance.
V. Mailchimp: User-friendly & Versatile

Mailchimp offers intuitive email marketing automation and social media ad management. It’s perfect for small to medium-sized businesses. It stands out for its ease of use and robust analytics. Use Mailchimp to design targeted campaigns, track engagement metrics, and enhance audience reach.
Key Features
- Easy-to-use email templates and automation workflows.
- Create and manage ads on various social media platforms.
- Design and launch landing pages without needing a developer.
- Track and analyze email and ad performance.
Staying Ahead in 2025: Key Marketing Automation Trends for Business Growth
Marketing automation is evolving rapidly, and businesses that embrace new trends can enhance customer engagement, streamline operations, and improve ROI. Staying ahead requires understanding the technologies driving this evolution and integrating them into your strategy.
AI-powered insights now play a crucial role in optimizing sales funnels, automating data analysis, and predicting performance. Smart chatbots offer 24/7 support while gathering customer behavior data. Predictive analytics helps businesses anticipate customer needs, reducing churn and improving retention. Generative AI automates content creation, boosting efficiency and personalization. Automated email drip campaigns nurture leads and re-engage customers with minimal effort.
Personalization remains essential, as tailored experiences increase conversion rates and customer loyalty. Mobile-optimized strategies meet growing consumer demand for on-the-go solutions.
Businesses should evaluate these trends based on their goals, customer behavior, and available resources. Implementing the right mix of automation tools can drive growth, improve efficiency, and position your business ahead of competitors.
Looking for an automation tool to enhance your marketing efforts? Factors.ai helps you monitor and optimize sales and marketing performance and KPIs. So, you can make data-driven decisions to streamline your campaigns, enhance customer engagement, and boost your ROI. Start your free trial with Factors.ai now and watch your business thrive.

How to use LinkedIn ads for Product-led Growth
Product-led growth (PLG) is all about letting your product do the talking. People no longer want to sit through multiple sales calls and lengthy onboarding processes —they prefer to quickly experience the product value and speed up their decision-making.
Of course, the best way to convey product value is to educate your prospects via the channels where they are most active, aka LinkedIn. Given that 4 out of 5 users on the platform are decision-makers, using LinkedIn ads is the ideal way to educate your target accounts about how your tool best solves their pain points.
Let’s dive into how you can leverage the power of LinkedIn ads in a PLG motion ⬇️
Leverage account engagement data the right way
Account engagement data is a treasure trove that offers crucial context on how your prospects make buying decisions. You can use it to tailor your ads based on how far they’re along the PLG funnel.
Unfortunately, companies struggle with effectively consolidating and leveraging this data for their ad campaigns. If you want to run personalized account-level campaigns on LinkedIn, you must invest in a tool that translates complex data into actionable insights to help refine your ad strategy.
Here are a few ways you can use Factors to interpret your account data, optimize your LinkedIn ads, and move prospects across the PLG funnel:
Show ads based on product engagement
Any time a user signs up, boom – they instantly get an email prompting them to schedule a demo. While there’s nothing wrong with this approach, it’s unlikely that every user who signs up is ready to talk to sales.
We suggest using LinkedIn ads to strategically target the buying committee and show them how your features effectively solve their problems. It is a subtle approach that showcases your product's USP without seeming pushy for a sales call.
You can use our Audience Builder feature to target the right accounts with your preferred criteria. For example, if you want to target all accounts who signed up for a free trial but haven’t booked a demo, you can create a segment on our platform and import it to LinkedIn Campaign Manager
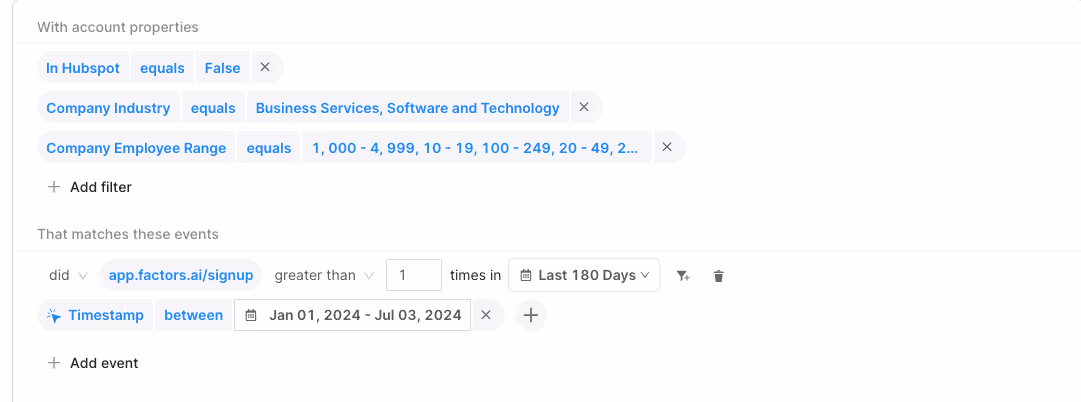
Now that you’ve begun showing ads to potential customers, it’s time to focus on “how” you show these ads.
It’s important to remember that not everyone who signs up for your product is a guaranteed customer. You shouldn’t bombard users with the same ad repeatedly, as this can cause a negative attitude toward your brand. Buuut, you still want to ensure your product is top of mind while they’re evaluating other solutions.
A tricky balance, isn’t it? 👀
Luckily, with Smart Reach, you can implement a cap for how many times you want to show your ads to specific accounts. Here’s an example of how we use Smart Reach at Factors to control exposure to our ad campaigns:
- For every account that signs up for our product, we initially set a cap of 500 impressions monthly.
- If they log in more than twice, it indicates they found value in our product but still need to truly understand the features. In this case, we bump it up to 750 impressions per month.
- When they hit certain product milestones, such as creating a dashboard or setting up alerts – it implies they’re aware of our features but still need a final nudge to move to the paid plan. At this stage, we double the frequency cap to 1500 impressions.
- Once they click the “upgrade” button, we set the cap to 3000 impressions.
As we’re increasing the frequency cap for all these accounts, we’re ensuring that ads are only shown to relevant accounts without causing ad fatigue.
If you want to know whether your target accounts are truly resonating with your ads, you can use True ROI. With view-through attribution, you get the complete picture of how LinkedIn plays a role in turning your free-trial users into paying customers.
Here’s a report that shows how many people signed up for a demo:
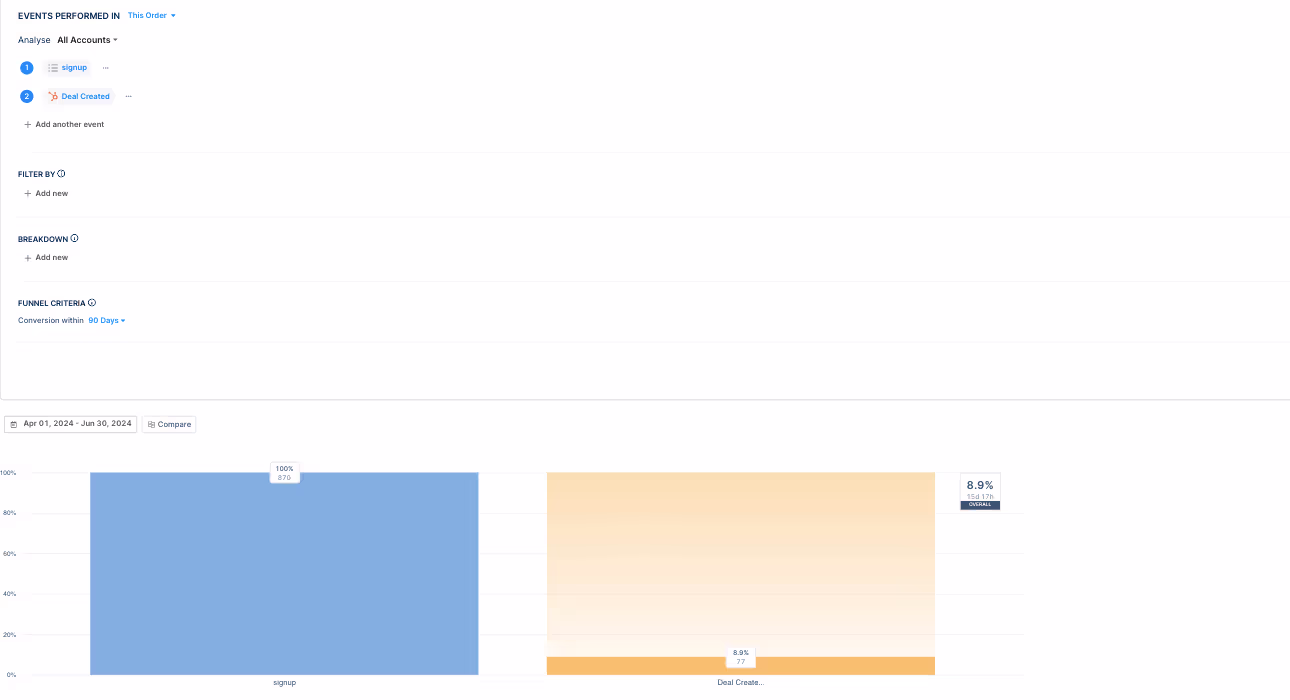
Once you add the event “LinkedIn ad viewed,” you can see how many users signed up after viewing your ads. This gives greater clarity on how your ad campaigns drive signups and revenue.
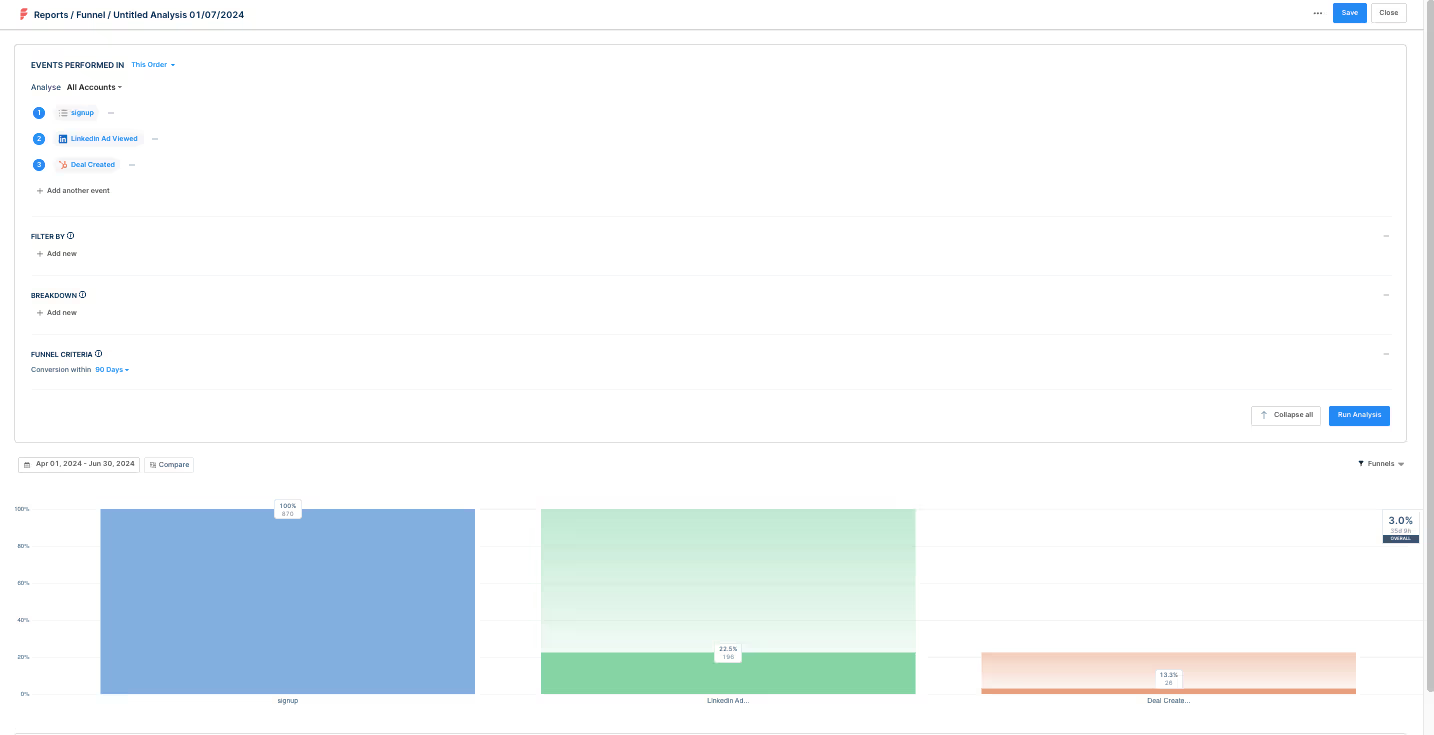
Plus, you can also leverage our CAPI integration to send your conversion data from your website and CRM to LinkedIn to better scale and optimize your ad campaigns. CAPI ensures that you show your ads only to accounts that fall under your ICP, thereby helping you massively save ad spend. Here’s how you can set up CAPI to target your ads to users who set up an alert:
Wrapping up
Showcasing the product front and center is the core of PLG. When you use LinkedIn ads the right way, you can drive consideration for signed up users and turn them into advocates in no time. Speak to our team today to find out how you can use AdPilot to boost your PLG motion.
.webp)
Streamline LinkedIn Ads Management: Campaign Automation
Managing LinkedIn campaigns manually can be daunting and inefficient. Traditional methods include loading audiences, approving budgets, and designing campaigns, which take time and effort. Our audit of multiple ads showed a need for better-balanced ad distribution, with marketers having limited control over this process. This lack of control can result in poorly optimized campaigns and less-than-ideal outcomes on LinkedIn.
Our new LinkedIn AdPilot's ‘Campaign Automation’ helps marketers regain some of this much-needed control. It streamlines LinkedIn ads management, ensuring precision, efficiency, and ROI. Factors’ automated, intent-based campaign management enhances LinkedIn ad performance by 20-30%.
The Challenge
Issues with Manual Campaign Management
Manually managing LinkedIn campaigns has several challenges. It consumes valuable time and organizational resources inefficiently.
Marketers spend hours uploading audiences, setting budgets, and designing campaigns, only to face challenges in optimally distributing ad impressions. This results in wasted budgets, as impressions may be concentrated on a few accounts or directed toward those not yet interested or prepared to convert.
These inefficiencies limit campaign potential, causing marketers to miss opportunities to engage high-intent prospects. Consequently, this leads to missed conversion opportunities and diminished overall performance.
Introducing LinkedIn Campaign Automation
Overview of AdPilot and Campaign Automation
Factors' AdPilot introduces Campaign Automation to tackle manual campaign management inefficiencies. It automates ad impression distribution based on intent, ensuring ads reach relevant audiences without a few companies monopolizing impressions.
This feature offers key benefits, including enhanced efficiency, precision targeting, and better budget allocation.
Campaign Automation is set to change the way LinkedIn ads are managed. It directs ad impressions to high-potential prospects actively seeking solutions. This reduces wasted impressions and ensures that every ad dollar is spent effectively.
Use-cases
Optimized Ad Impression Distribution
Campaign Automation directs ad impressions to high-intent, in-market buyers, minimizing wasted impressions. It enables precise targeting of prospects actively seeking solutions and optimizes ad budgets for maximum ROI by focusing spending on high-potential leads.

to high-intent and in-market buyers.


Frequency Capping Control
Our audit of over 100+ LinkedIn ad accounts found that the top 10% of companies in your target audience will likely take up 80% of the impressions. However, with the Campaign Automation feature’s intent-based ad distribution, our customers have seen lower CPMs, higher CPRs, and a lower cost per lead.
Sales and Marketing Alignment
This capability directs ad budgets towards high-intent accounts, increasing the sales team's success rate. As companies engage with sales, they automatically receive more impressions on LinkedIn, enhancing conversion potential. This capability ensures campaigns are optimized in tandem with sales efforts rather than operating in isolation.
Time and Resource Efficiency
Automating campaign management liberates marketers' time and helps them prioritize strategic tasks over manual adjustments. Campaign Automation handles routine tasks such as audience targeting and budget adjustments. It lets teams focus on crafting compelling content and refining overall strategy. This streamlined workflow boosts productivity and improves campaign effectiveness.
In a nutshell
Campaign Automation overcomes the challenges of manual ad management. It ensures optimized targeting, efficient budget allocation, and enhanced productivity. The use cases demonstrate the impact of this feature on LinkedIn ad campaigns
Ready to elevate your LinkedIn campaigns? Leverage Campaign Automation to ensure optimal performance and ROI. Contact us today to learn more about AdPilot and how our Campaign Automation feature can revolutionize your LinkedIn ad management.

