Factors Blog
Insights Across All Things B2B Account Intelligence & Analytics

Why did LinkedIn acquire Oribi? Top 4 Oribi Alternatives for 2023
Why did Linkedin acquire Oribi?
On March 31st 2022, Linkedin announced its acquisition of Oribi — an Israel-based marketing analytics company, for over $80 million. Oribi was a marketing analytics platform that offers seamless integration and automated event tracking for your website without the need for coding. They provide a user-friendly platform that combines several conversion rate optimization (CRO) features, including customer journey funnels and event correlations, making it easy for users to access and utilize these tools.
An agreement was reached with Oribi CEO, Iris Shoor, after several conversations about product and value alignment. Linkedin’s purchase of Oribi is part of a larger strategy to expand features across Linkedin Marketing Services (LMS). LMS includes a range of strategies, techniques and tools used to promote advertisements, profiles and other businesses on LinkedIn. This helps advertising firms and recruiters to get actionable insights into their posts and advertisements.
With this acquisition LinkedIn aims to position itself strongly in the advertising and marketing analytics domain. With a 43% growth in the marketing service revenue on yearly basis, LinkedIn wants to grab on to the momentum of the growth trajectory of the marketing revenue. It aims to provide its users with keen insights with more data analytics and attribution in order to stronghold itself as a competitor to Google Ads services.
But what are the implications of this acquisition? and how does this affect former-Oribi customers? Let’s find out.
“Understanding which channels and messages have the greatest impact on the decision to take a desired step, such as a buyer requesting a product demo or a job seeker applying to a job posting, is critical to the effectiveness of any marketing campaign. Through the integration of Oribi’s technology into our marketing solutions platform, our customers will benefit from enhanced campaign attribution to optimize the ROI of their advertising strategies” - Tomer Cohen, CPO, LinkedIn
How will Linkedin use Oribi’s technology?
As previously mentioned, Linkedin acquired Oribi with the intention of expanding its LMS portfolio with industry-leading marketing and web analytics software. In particular, Linkedin was expected to employ Oribi to improve LMS insights tag implementation, drive audience insights for retargeting and CRO, and create customer journey funnels for Linkedin campaigns. Campaign attribution and ROI reporting are other Oribi use-cases Linkedin seeks to leverage for LMS.
As part of the agreement, Linkedin opened its very first office in Tel Aviv. The majority of the Oribi team has already joined Linkedin’s LMS division as well. LinkedIn’s action also came with a series of layoffs. According to some reports, 17 Oribi employees working in customer facing verticals(sales, marketing etc) were fired post acquisition.
“Oribi’s team brings deep analytics expertise that will help us accelerate the capabilities of our attribution technology across our lines of business – from helping a marketer find better leads to a recruiter identifying the right candidates. The acquisition will expand our international presence so we can continue delivering products that meet the evolving needs of our global customers and members.” - Tomer Cohen, CPO, LinkedIn
What does Linkedin’s acquisition of Oribi mean for customer data?
A couple of things. First, any data captured following Oribi’s integration remains in the control of customers and adheres to all commitments set by Linkedin’s standard ads agreement. This means that LinkedIn will not use, edit or tarnish the data already captured by Oribi for its existing users. Second, Linkedin will not be combining legacy personal data between Oribi and Linkedin. This means that the data captured by Oribi prior to the acquisition will not be used by LinkedIn in any way, therefore, the existing customers data will not be scrutinized by LinkedIn post integration.
Finally, there are no plans for Linkedin to alter the data it currently collects from users — simply to enhance existing data using Oribi’s technology. This implies that LinkedIn will not change or update its data collection policy from its users post integration with Oribi. Therefore, LinkedIn users should not be worried about collection of additional data points to enhance Oribi’s functionality.
What does Linkedin’s acquisition of Oribi mean for former Oribi users?
According to several reports, Oribi shut down services and canceled customer contracts just weeks after the agreement was reached. Based on conversations with former Oribi-users, its revealed that Oribi has offered its customers a couple of options:
- Try out Oribi/LMS’s early-stage pilot program
- Switch to an alternate marketing/web analytics solution
The problem with the first option is that as a result of Linkedin’s acquisition, the pilot program is heavily limited. Integrations with third-party ad platforms like Google and Facebook look likely to be restricted as well. Therefore, the customers will not be able to get the ultimate benefit of marketing analytics, and integration features post acquisition. Accordingly, option 2 is the popular choice. Especially since historical data will not be preserved, now seems to be the best time to switch to an alternative solution for Oribi.
Best Oribi Alternatives in 2023
Since the acquisition of Oribi by LinkedIn, significant changes have taken place. Although it was anticipated that LinkedIn would leverage Oribi's capabilities to improve its marketing analytics, many users believe that the acquisition did not turn out to be favorable for Oribi.
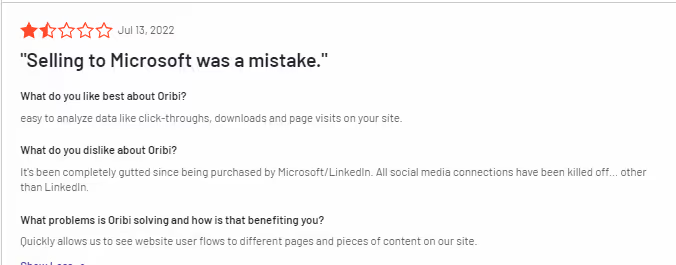
Many users were not happy with acquisition, as they anticipated a large number of Oribi features to be eliminated post acquisition. Therefore, many Oribi customers are out scouting for viable alternatives for their needs.
There are a host of platforms to consider for replacing Oribi including Factors, Heap (which is a powerful solution, but suited more for product analytics), Wicked Reports, and Plausible.
Let's compare some of the top alternatives to Oribi and see how they fare in terms of their features (pros and cons), pricing, integrations and user reviews.
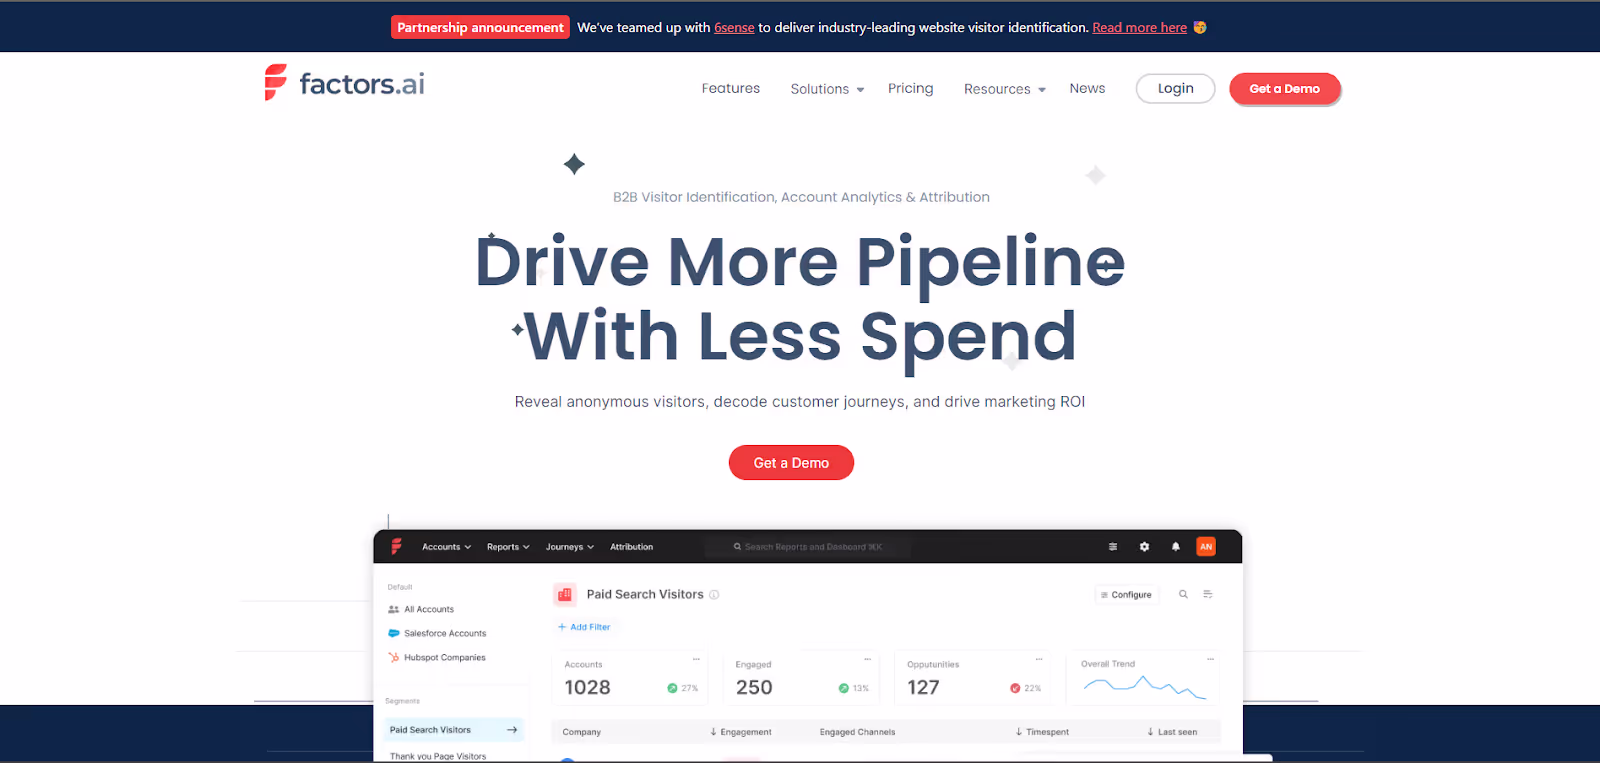
- Factors.ai
Fcators.ai is a marketing analytics tool which specializes in multi touch attribution with a focus on account based analytics and visitor identification.
Oribi does not offer the concept of dashboarding, making it difficult to group and visualize reports efficiently. Factors provides customizable dashboards where all reports are conveniently organized and displayed, simplifying the process of data grouping and visualization. It allows users to consolidate essential data in a single location, enabling easy tracking, analysis, and generation of insights to optimize marketing campaigns effectively.
Factors offers account-based analytics which includes campaign analytics, website analytics, and funnel analytics. With Factors, marketers can enhance their understanding and optimization of website conversions with automated tracking of buttons, detailed page analytics, access to unsampled data, and the ability to track custom domains. Factors provides end-to-end journey analysis with Funnels, letting the user add as many filters as they like to easily customize their data and dashboards.
What’s more is that Factors consolidates various metrics such as CPC, CTR, ROI, impressions, and more at different levels like channels, campaigns, ad groups, and keywords, enabling more detailed data-driven marketing strategies, this was not possible in Oribi.
Moreover, Oribi has limited integration with HubSpot, only allowing the push of web data into the CRM. In contrast, Factors integrates with both HubSpot and SalesForce, enabling the connection of campaign and web data with contact data, offline events, and revenue metrics from the CRM. This integration empowers comprehensive analysis and attribution throughout the customer journey.
Factors can be set up within 30 minutes and offers no-code integrations with ad platforms, CRMs, MAPs, and CDPs.
Both Oribi and Factors deliver intuitive web analytics, CRO, attribution, and funnels. On top of this, Factors also provides end-to-end customer journey mapping across campaigns, web, & CRMs. You can learn more about how Factors compares against Oribi here.
PROS:
- Unlike Oribi which only provided website attribution, Factors provide attribution at every relevant touchpoint from ads and website interaction to offline interaction using CRM integration. With customizable reports across channels, campaigns, and keywords, Factors can be moulded to any need which the user might have.
- Factors has an impeccable 64% visitor identification rate which is the highest in this category.. Along With its robust visitor identification feature complemented by multi-touch attribution, you can perform various attributions including offline touchpoints to identify the various sources from where visitors come to your website.
- Factors is now the official Marketing Partner of LinkedIn. With this collaboration, the users can get complete information about who is viewing Linkedin ads, clicking on them, and how this leads to conversions. With this partnership, users can optimize their campaigns with AI driven insights for all of their marketing efforts..
CONS:
- Factors cannot automatically send data back into Hubspot or Google Analytics like Oribi. Therefore, it may not be a good fit for you if you are looking for data orchestration rather than analytics.
- Factors does not support integration with ActiveCampaign, Mailchimp, and Klaviyo. Therefore, the user may miss out on the use cases relevant to these integrations
Integrations:
- Google Search Console
- Google Ads
- Facebook Ads
- LinkedIn Ads
- Hubspot
- Salesforce
- Clearbit
- Segment
Pricing:
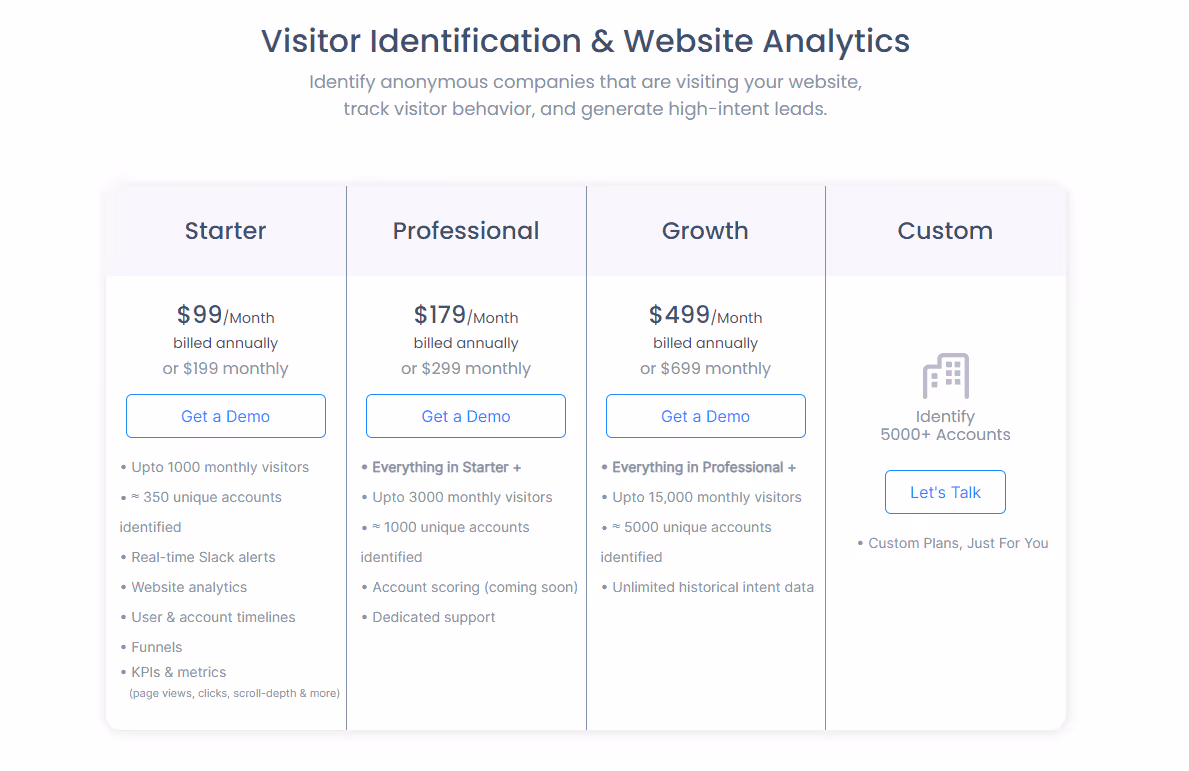
Factors offers a free 14 day trial with no credit card requirement. Visitor Identification and Website Analytics plans start at 99/month, while it has a separate pricing plan for Multi-Touch Attribution starting at $399/month.
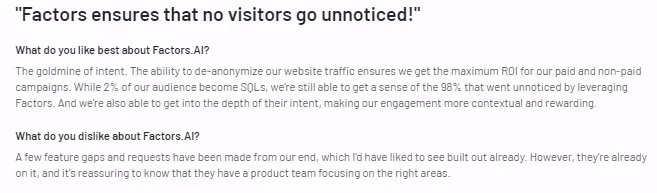
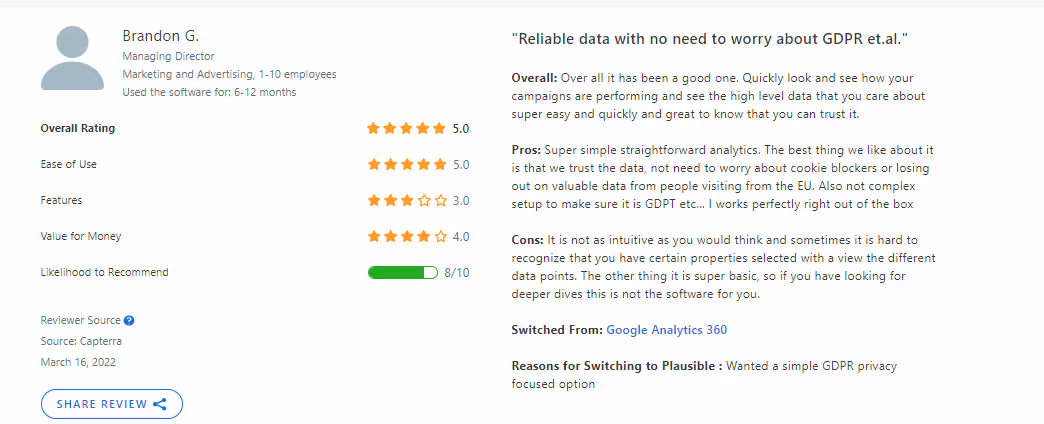
Reviews:
- Plausible Analytics
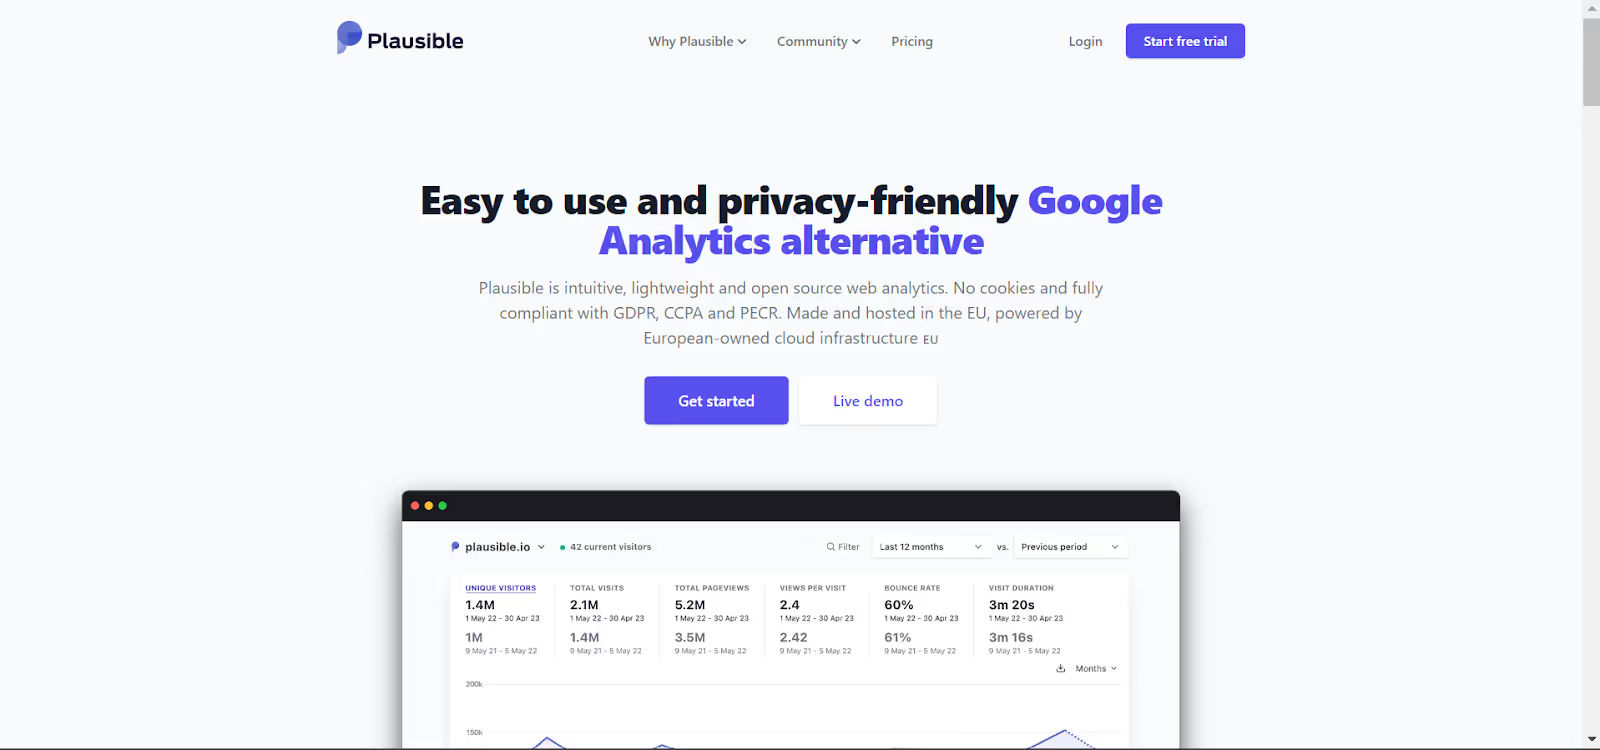
Plausible Analytics is a cookieless web analytics tool designed specifically for a wide range of businesses including small and medium-sized enterprises (SMEs), startups, content creators, bloggers, and e-commerce websites.. As an open-source tool, Plausible offers a transparent and customizable solution that empowers businesses to track website performance without compromising user privacy. It offers intuitive data analytics with traffic segmentation, shareable dashboard and real time notifications. Plausible aims to provide simple web analytics at a glance without any complex layering of data with menus, and complex reports. Instead of tracking every imaginable metric, Plausible focuses only on relevant and most important data points. Like Oribi, Plausible provides intuitive data analytics features which are compressed in a 1KB script.
Plausible’s script size is smaller than 1KB, ensuring that website loading time is reduced. With a script size which is 45 times smaller than Google analytics, plausible occupies less space and gets easily installed.
PROS:
- One of the standout features of Plausible Analytics is its incredibly lightweight script, clocking in at less than 1KB. This means that implementing the tool won't slow down your website's loading time, ensuring a seamless user experience for your visitors.
- Plausible complies with GDPR, CCPA, and PECR.. It offers real time slack and email updates which are customizable based on the user’s needs.
CONS:
- Plausible does not provide multi touch attribution but only last click attribution. This leaves you unsure of where the leads actually come from.
- Since Plausible Analytics does not collect or store personally identifiable information (PII) and avoids the use of cookies, it means they do not retain historical data beyond a 30-day period. This could pose a challenge if your tasks involve long-term data analysis or trend tracking, as the limited data retention may affect your ability to derive insights and perform comprehensive analysis
Integrations
- Bubble.io
- Carrd
- Hubspot
- Google Data Studio
- Google Search Console
- Notion
- Wordpress
Pricing
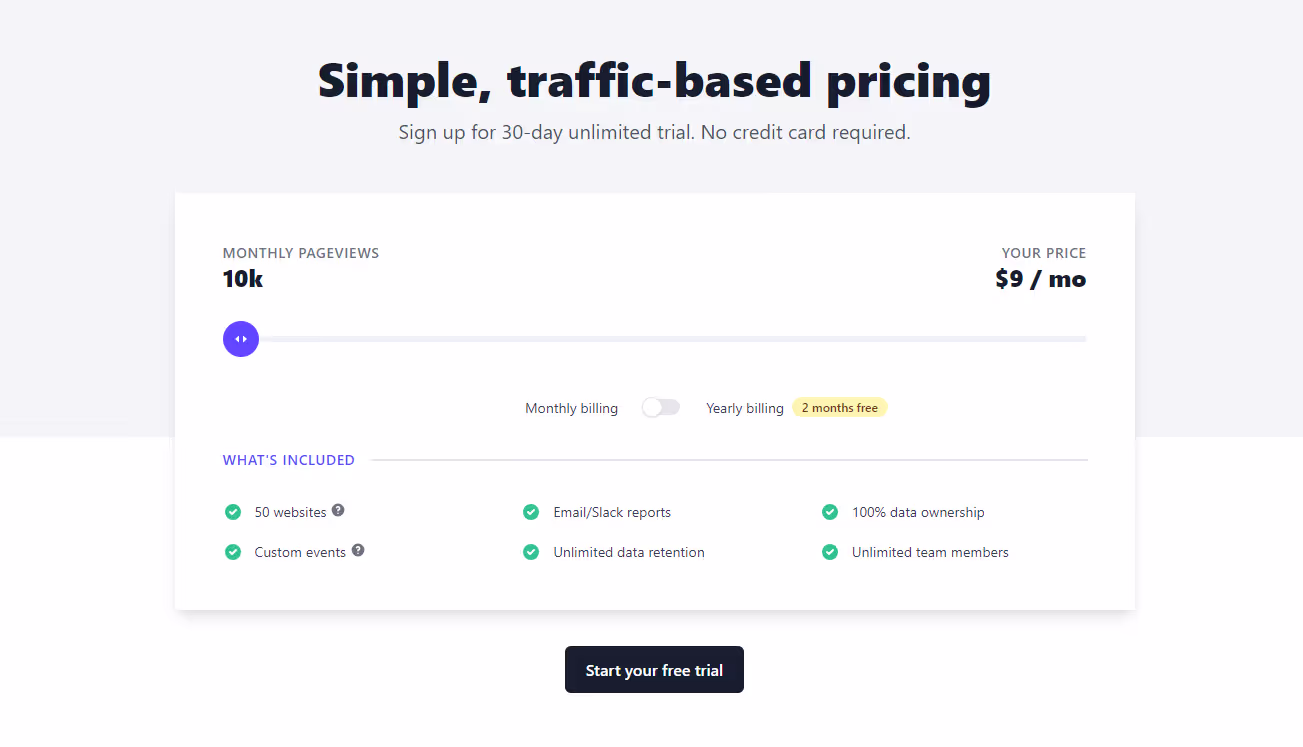
The tool provides a free trial, and the paid plans start from just $9 per month for 10K visitors. Furthermore, users can get a 2-month free subscription if they pay annually.
Reviews
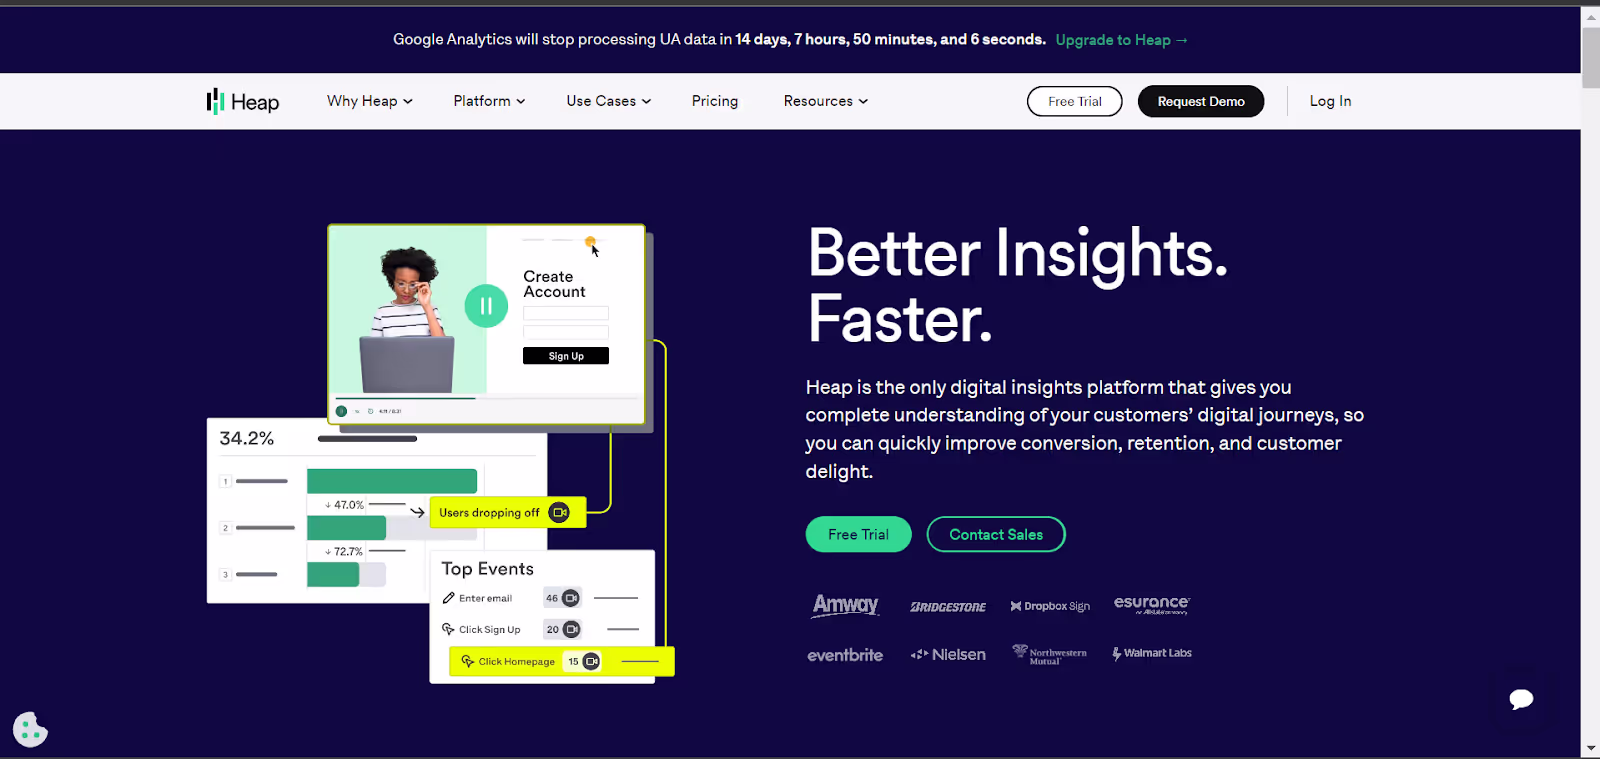
- Heap
Heap is an analytics tool that automatically captures, tracks, and visualizes visitor engagement with the website to provide actionable insights. Heap collects data and collates it into easy to read graphs and funnels.Heap focuses on enhancing customer engagement and tracking their activity throughout their journey with a brand. Heap offers a diverse array of capabilities, like automatic event tracking, retroactive data capture, and real-time reporting. It empowers businesses to segment their data based on users, sessions, and events, simplifying the process of identifying trends and patterns within the data. For Oribi users, Heap could be a good fit since it provides customers with funnels, real time reporting, and a host of data visualization features.
PROS:
- Heap offrs intuitive and customizable dashboards to coordinate important metrics for the business and help drive insight driven actions. It allows businesses to segment their data by users, sessions, and events, making it easier to identify trends and patterns.
- Heap provides user segmentation, which helps categorize users based on their characteristics and behavior. This feature allows businesses to track users retroactively, gaining insights into their past interactions and activities. With user segmentation, companies can better understand their audience and tailor their strategies to meet specific user needs.
- With the user timeline feature, Heap enables marketers to see detailed user level data as to how each user interacts with the website/app. The timeline of this activity can be adjusted from the last 7 days to the date the user first interacted with the website/app.
CONS:
- Heap occupies a large amount of space due to its many features and comprehensive data storage features.. When you have a lot of data stored, it becomes more challenging to calculate the costs associated with data privacy and protection, storage and archiving, and regularly backing up the data. The complexity increases as the amount of data grows, making it important to carefully manage and allocate resources to ensure data security and accessibility.
- Heap only focuses on the website traffic, user activity on the particular site and conversions. It does not factor in the role of paid ads, organic reach on search engines and other touchpoints. Here is where a tool like Factors comes into play as it gives you a complete and in depth overview of the data attribution and visitor identification across multiple touchpoints.
Integrations:
- Shopify
- FullStory
- Clearbit
- RedShift
- Eloqua
- Hubspot
- Salesforce
Pricing
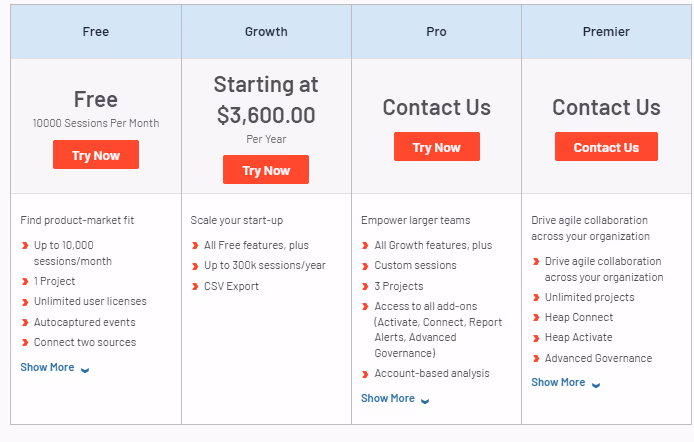
The tool provides a free trial and a free package for up to 10K monthly sessions. The growth package is priced at $3600/YEAR for 3OOk sessions per year.
Reviews
- Wicked Reports
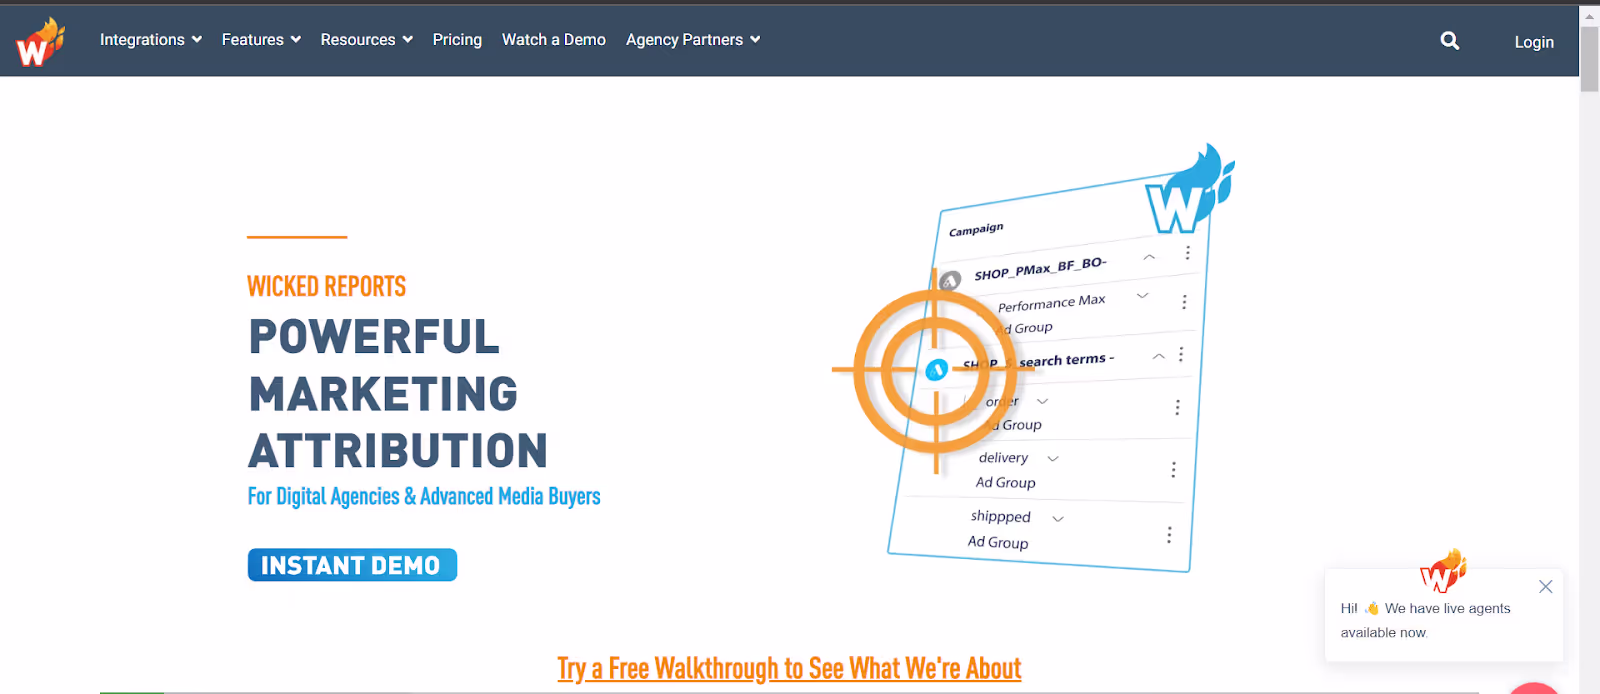
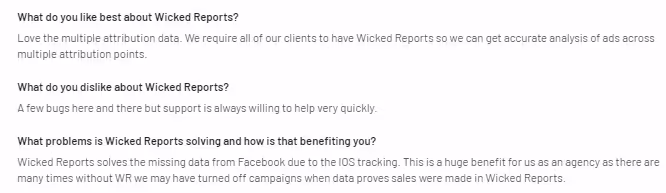
Wicked Reports is a marketing attribution platform with a wide assortment of campaign analytics features. Some of its unique features include the ability to include/exclude subscription revenue, distinguish new sales from recurring sales revenue, and new leads from re opt-ins.
Attribution in Wicked Reports is its standout feature, primarily used for generating ROI reports. Users can pick from various attribution models provided by this platform like, linear attribution, last click, first click attribution, full impact attribution etc. Wicked Reports also generates insights into customer lifetime value and cohort analysis.
Pro:
- Wicked Reports offers cohort analysis capabilities, allowing you to analyze the behavior and performance of specific groups of customers over time. The platform helps in the visual representation of the monetary value and ROI of the customer, illustrating their profitability and financial performance over time..
CONS:
- Wicked Reports cannot be used to visualize customer funnel journeys. This means that marketers will not be able to locate where leads are lost. Customizing and visualizing of funnels is possible with tools like Factors.ai.
- Wicked Reports primarily focuses on marketing attribution rather than web-level attribution. It specializes in attributing marketing efforts to revenue and ROI, helping marketers understand the impact of their various marketing channels and campaigns. However, when it comes to granular web-level attribution, such as tracking specific user actions on a website, Wicked Reports may not provide extensive capabilities in that area
Integration
- Hubspot
- Mail Chimps
- Shopify
- Google Ads
- Facebook Ads
- Snapchat
- Paypal
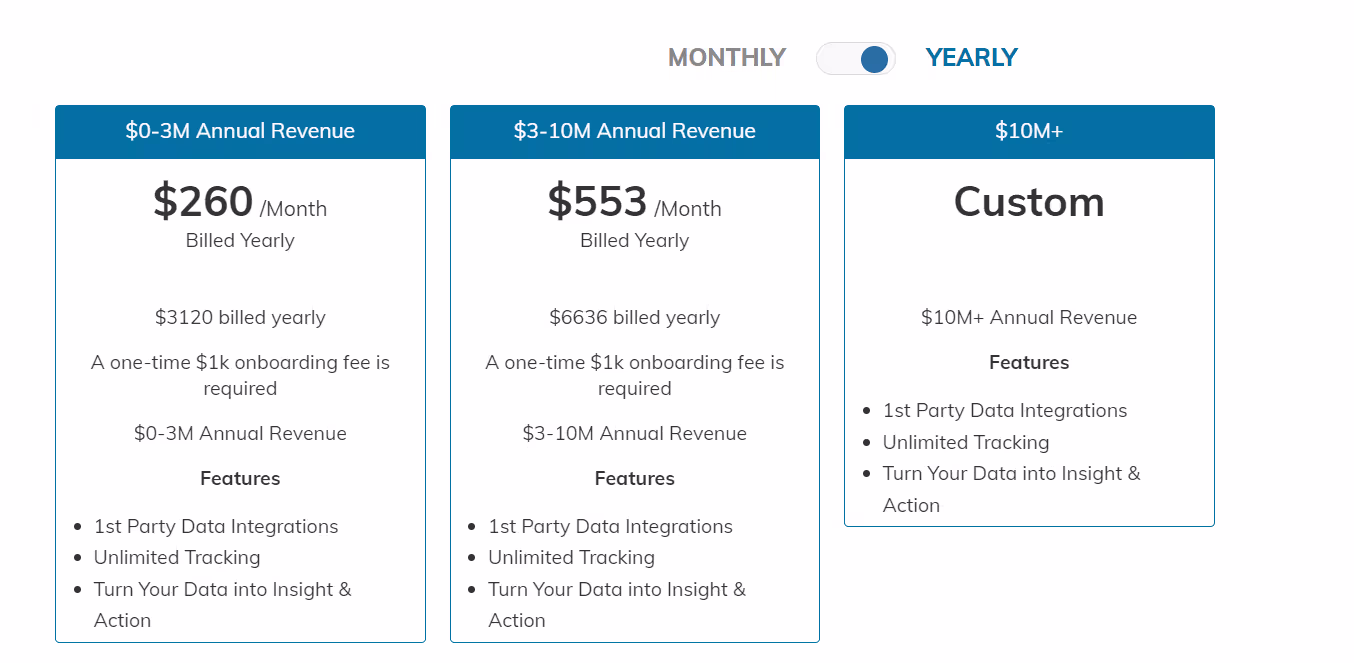
Pricing
Reviews
In conclusion…
LinkedIn’s acquisition of Oribi came at a crucial time for the marketing analytics and attribution space. With a keen focus on positioning itself as a strong rival to Google Ads services, LinkedIn aims to utilize the marketing analytics and attribution features offered by Oribi. LinkedIn wants to focus on its campaign manager which has now become more and more relevant to analyze marketing campaigns.
That said, Oribi can definitely improve its interface and analytics capabilities especially with the continued support of Microsoft. With the acquisition now completed, LinkedIn now has in its coffers a host of features to drive its marketing analysis and attribution arm. As a result, LinkedIn will now be able to offer recruiters and advertisers complete analytics of their ads and posts fueled by AI-driven insights.
Now, more than ever, marketers feel the need and importance of monitoring their efforts and making data-driven decisions to ensure they’re getting the most bang for their buck. The role of marketing analytics will only become increasingly important as even conventionally offline events like seminars and conferences turn digital.
Although the acquisition proved fruitful for LinkedIn and its marketing analytics tool, existing customers did not like it as much. Post acquisition, Oribi shut down its customer-facing vertical, culling out numerous features and also fired customer-facing employees.The existing employees of Oribi especially the sales and marketing vertical had to bear the brunt. Additionally, the existing customers had to venture out in search of alternatives to replace Oribi, which resulted in additional costs, and wastage of time.
The search for an Oribi alternative ends here with Factors. Factors has proven to be a highly effective marketing analytics and attribution platform for B2B marketers. Try it for free or schedule a personalized demo to witness its impact on your campaigns and website conversions today!
FAQ:
- Why did LinkedIn acquire Oribi?
With Oribi’s acquisition, LinkedIn was looking forward to optimizing its marketing and advertising service. LinkedIn aimed to solidify its global presence by providing marketers and recruiters a keen insight into their campaigns. According to Tim Cohen (Chief Product Officer at LinkedIn), marketing services grew about 43% on a yearly basis, with Oribi in its coffers, LinkedIn aims to drive this growth potential and position itself as a reliable source of advertising and marketing services.
Furthermore, LinkedIn aims to position itself as a firm competitor against Google's ads and marketing service.
- What are the best Oribi alternatives?
Some of the best Oribi alternatives for 2023 are Factors.ai, Heap, Plausible Analytics,and Wicked Reports. Some other platforms to look out for are Mixpanel, Amplitude and Fullstory. Oribi carved out a strong position in this market due to its no code and easy to use market attribution feature which housed loads of CRO features. One should look out for relevant attribution services with an easy to use interface in order to match the experience of Oribi.

Unlocking the Secrets of Lead Scoring Models
What do you do when you’re stuck nurturing countless leads that drive few conversions? Lead scoring has emerged as an effective solution forthis customer conversion challenge. Studies show that B2B organizations that utilize lead scoring realize a 77% increase in lead generation ROI compared to those that don't. If this piques your interest, know that scoring your leads and determining a lead scoring model is not a cut and dry process. The following post explains what lead scoring is and explores some commonly used lead scoring models.
What Is lead scoring?
Lead scoring is the procedure of quantifying the conduciveness of a lead generated by a business. To put it simply, it is used to determine if a lead is more likely to convert or not by assigning scores to the leads. By doing so, you ensure that both your marketing and sales teams are seeding the right prospects, all while getting to understand who your ideal lead is in the process.
So far, it seems simple right? Well, scoring leads is not all black and white. Figuring out your buyer persona is a multifaceted challenge. It not only requires a boatload of data but constant revisions and maintenance over time as well.
To help with that, here is how you build your lead scoring model:
Determining lead scores
First, we need to figure out the criteria for scoring, and how many points to reward or deduct for each criterion. Here are a couple of steps to establish that:
1) Picking your KPIs and Traits: The first step in lead scoring is selecting what you need to be judging. This involves the KPIs (key performance indicators) and common traits of leads that convert. An example of this would be that an important KPI is the number of views on the review page for a product. And a common trait could be a particular company size.
2) Assigning the Value: It is important to understand which traits are more significant than others — like the lead’s company size over the industry. This way you can reward certain traits higher than others. You should even determine the points to be rewarded per trait — which company size converts the most and which ones convert the least, etc. You can do this by calculating the conversion rates of the leads with different levels of the same trait and comparing them to the average. The same can be done for KPIs as well.
With all these in place, you can now determine the score for each lead attribute. Remember that you must never only rely on one attribute to score your leads. The more the merrier, as the following lead scoring models deal with a wide variety of data.
Lead scoring models
A lead scoring model is nothing but the basis of evaluation for your scoring or the system on which it is predicated. With that said here are some common lead scoring models:
1) Implicit Scoring (Activity/Engagement): Implicit scoring is used to grade leads based on their level of activity and engagement with the business, its brand and its content. It utilizes a lot of tracking data across several platforms and compared to explicit scoring it is a continual process. Here are some examples of implicit scoring:
- Number of webpage visits or leads that visited the pricing page.
- Content engagement, including views, downloads, etc.
- Email engagement, email click-through rate and bounce rate.
- Social media interactions, involving likes, comments, followers, etc.
- Leads that requested for product demos and free trials.
- Leads that attended webinars.
- Form submissions, and more
2) Explicit Scoring (Suitability): Explicit scoring is used to evaluate a lead based on their business-related profile like the lead’s company size and job title. This information is used to determine the suitability of your lead’s business profile to that of a lead that converts. Explicit scoring is more commonly used in B2B interactions, given the importance of assessing the companies they deal with. Here are some examples of explicit scoring:
- Company size, which can allude to how many decision-makers are involved in the buying decision.
- Job titles that are awarded different points depending on the level of influence.
- The company’s revenue could help identify companies that are more in line with your average contract value.
- The lead’s company industry.
- The location and other demographics of the lead.
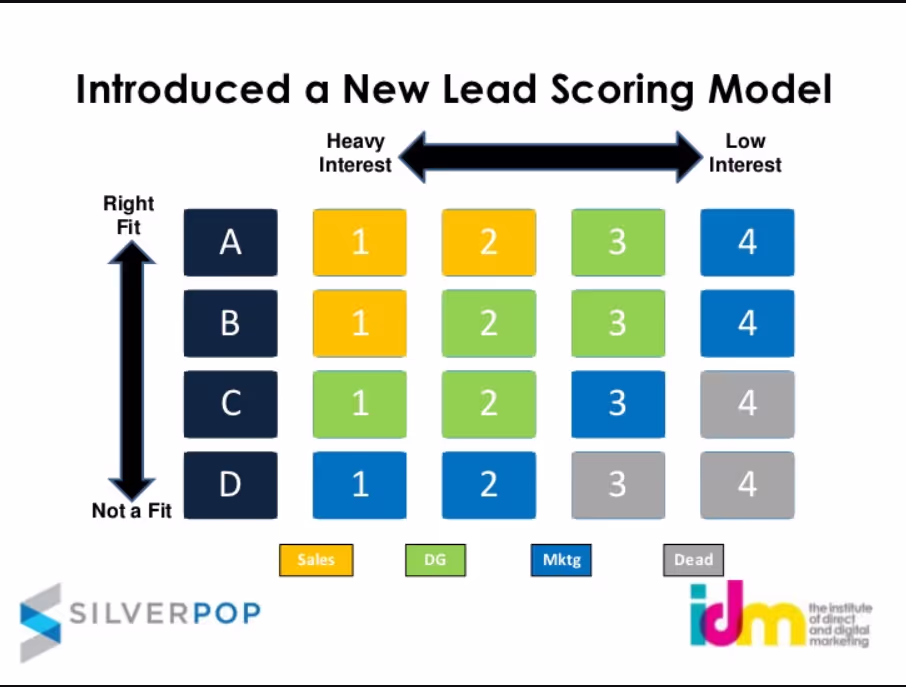
3) Matrix (Combination of Implicit and Explicit Scoring): This model is called a matrix model because it uses an incidence matrix combination of implicit and explicit scoring. This means that we evaluate a lead based on combinations of implicit and explicit traits at varying degrees. For example: A lead that is considered highly suitable based on explicit business profile traits like company size and industry can be scored poorly due to its low activity and engagement levels. The same could be said about a lead with high activity but low suitability.
The importance of both these dimensions varies based on your ideal client profile (ICP). The use of this matrix model, including models with other dimensions, are quite common in lead scoring solutions used today. Like Silverpop’s scoring system.
4) Negative Scoring: A negative scoring model implements a deduction of points to your lead scores based on unfavorable interactions and intentions. Negative scoring involves a multitude of aspects. From the low levels of activity or interest found in leads, to prospects consuming your content for all the wrong reasons. The biggest advantage of implementing this model is that it avoids inflating a lead’s score. And allows your sales team to focus more on better leads. Here are some examples of negative scoring:
- Inactive or stagnant leads that have not interacted with the business in a while.
- Leads that unsubscribe to your company newsletter.
- Rival companies researching your company.
- Visitors that consume your content with no interest in the product, but for other reasons (academic/employment)
Regardless of which model you pick, you’re more likely to adopt a combination of these models so long as it meets your scoring requirements. And as long as you fine-tune your method in conjunction with newer customer data, you can ensure that your lead scores will always stay credible.
Oribi vs Wicked Reports
Oribi vs Wicked Reports
With Oribi discontinued, B2B and E-commerce teams are on the hunt for alternate marketing analytics solutions. With a seemingly endless list of options, picking the right tool can be tedious. Accordingly, the following post hopes to make this decision-making process easier by comparing Oribi with a similar analytics tool, Wicked Reports.
Which caters best to your web analytics, revenue attribution & reporting needs?
About Oribi
May 2022 Update: Linkedin's recent acquisition of Oribi has triggered major changes. While Oribi is being integrated into LinkedIn’s marketing solution, most (if not all) its features are being discontinued with immediate effect. This includes third-party integrations like Google and Facebook ads as well.
Oribi is an Israeli-based private organization founded in 2015 that develops a marketing analytics platform that provides code-free integration and automated event tracking across your website. They package a variety of CRO features like customer journey funnels and event correlations within a simple, user-friendly platform.
A popular attribute of Oribi is that its interface is easily accessible. It not only showcases your site’s highlights, but also uses algorithms to recommend and group critical interactions which can be customized and filtered.
About Wicked Reports
Founded in 2015 and based in the United States, Wicked Reports is a marketing attribution platform with a wide assortment of campaign analytics and breakdowns. It employs a wide range of attribution models that can be customized and then filtered for a date range, source, medium, campaign, product, etc. This attributed data can then be presented in the form of ROI reports along with other metrics such as CAC, CPL, recurring sales, and more. It also generates insights into customer lifetime value and cohort analysis, predictive behavior reports, etc.
Some of its unique features include the ability to include/exclude subscription revenue, distinguish new sales from recurring sales revenue, and new leads from re opt-ins. Not to mention its partnership with Google for an AI-based campaign bidding section known as Wicked Google Conversion Optimiser.
Oribi vs Wicked Reports
Both Oribi and Wicked reports have similar end goals — to monitor marketing performance and optimize conversions. That being said, they are fairly different operationally as some features are more predominant than others on either platform. To highlight these differences, let’s discuss their prevalent use cases and limitations.
Oribi Use cases:
As mentioned earlier, please note that the following features and use cases of Oribi will not be operational as a result of their recent acquisition by Linkedin
Web Analytics
When it comes to Oribi, web analytics is its bread and butter. It starts with codeless event tracking across button clicks, page visits, and form submissions. These events can be easily exported to other integrations. And all of the event metrics like visits and conversions by channel, device, UTM, page, session, funnel, etc can be reported individually per event.
A feature known as magic events automatically recommends critical events to track, which can also be customized and grouped. If you are interested in learning about what interactions a visitor is more likely to do based on correlated actions, Oribi’s event correlations feature does exactly that
Funnels
Another feature that Oribi has over Wicker Reports is it’s funnels. Besides being able to break down your conversion rates by a funnel when inspecting your events, Oribi allows you to create and customize your own funnels using any button click, page visit, and form submission. What was special about Oribi is that you could build funnels across different domains and across different web sessions. Once you build a funnel, you can even filter them based on platform, channel, locations and more.
Customer Journey
Oribi’s visitor’s journey section allows you to peer into any visitor’s entire journey on your website. It displays a detailed breakdown of all interactions by the visitor, the time between actions, channel, platform, OS, etc. If Oribi is tracking more than one domain, it will track visitors across all domains whether it’s in the same web session or not. You can also look for a specific visitor using email integration, and other filters like engagement, channel, actions performed and more.
Marketing Attribution
Perform channel level attribution with the option to filter different events as conversion goals with Oribi’s attribution feature. This facility presents single-touch and multi-touch models alongside channel level touchpoints for your conversion goal. Oribi’s attribution tool is a good way to understand which attribution model works for your website, which you can then weigh using Oribi’s attribution calculator.
Oribi Limitations
Discontinued operations
As of the acquisition of Oribi, their biggest limitation is that they have shut down their services as Oribi permanently. Not only did they stop onboarding customers, but a large portion of their existing customers have switched over to other services.
Limited metrics
Oribi has limited cost/revenue-related metrics at a product level, they only highlight basic metrics such as total sales, average order value, ROI, etc. They miss out on other pivotal metrics like CAC, CPL, LTV, etc. The same can be said even at a campaign level.
Lackluster attribution
The attribution feature is only capable of channel level attribution, and can be filtered by a few web events based on clicks and page visits. This is inadequate as attribution becomes actionable only when the whole picture is visible. Only attribution across campaigns, web, CRM, offline touchpoints provides comprehensive insights.
Limited attribution metrics
More specifically, Oribi’s attribution and its inability to assign cost/revenue-related metrics to attribution like ROI and CLTV. Again this has to do with the fact that Oribi does not attribute at a product or campaign level and only focuses on attributing event traffic. Oribi’s attribution calculator allows you to assign a model/crediting system to your web based attribution at a channel level. This information is superficial as you cannot decipher what campaigns drive more revenue per channel.
Miscellaneous limitations with Oribi
- Query data has long load times, and the dashboard fails to load certain reports.
- Limited reporting, can only produce reports as a pdf document and not other formats such as .csv and xlv.
- Cannot perform call tracking, inbound search query, and keyword tracking.
- Cannot track web events specific to a product.
- Oribi’s pricing is not very affordable for small businesses and startups.
- Inadequate technical support, sometimes unresponsive.
Wicked Reports Use cases
Marketing attribution
Wicked Report’s attribution is its most powerful tool which is used to make ROI reports. Despite being called an ROI report, these reports present way more than just attributed ROI. To explain, let’s understand how the feature works.
Before generating a report, users can pick from a range of attribution models. The selected model serves as the base on which campaigns are credited.
The following models available as of today:
- Customize Last Click Attribution
- Linear ROI
- First Click ROI
- New Lead First Opt-in ROI
- ReEngaged Lead Re Opt-in ROI
- Full Impact ROI
- Last Click ROI
- Attribution Model Customization and Settings
- ReEngaged Lead Attribution Setting
After picking an attribution model, you can apply a wide array of filters including date range, source, medium, campaign, product, etc. From here, every campaign’s ROI will be calculated based on the model. The campaigns will be presented along with metrics such as clicks, leads, sales, ROI, AOV, CPC, EPC, CPL, CPA, etc. You will also be able to examine things like first and last click sales and revenue for multi-touch models.
Customer journey
The only way to view campaign-level customer journey reports on Wicked Reports is to create an ROI report and access customer journey reports for each campaign individually. For a wider breakdown, the customer journey explorer reverse engineers all channel interactions from total revenue to sales (last click), to new leads and finally first click. Each campaign from the reports will have an option to view the customer journey through which you can map the conversion journey of each campaign — at a source, campaign, keyword-level
Sales velocity and forecasting
The predictive behavior reports combine a boatload of historical CRM data from HubSpot, Klaviyo, etc. It then merges it with sales data from Shopify, ReCharge, etc., to create a sales velocity report. After analyzing all the historical data, it presents a set of graphs and metrics. This illustrates favorable sales days and sales hours along with a forecasted evaluation time based on its calculations.
Cohort reporting
Cohort report on Wicked Reports presents a graph that keeps account of the customer’s ROI and value in preferred intervals over time. This information demonstrates the customer’s profitability over time from its monetary value and ROI. This can be used to adjust the CAC over time. This report also presents other useful information such as LTV and the break-even based on the month’s revenue.
Wicked Reports Limitations
Limited event tracking
For its attribution and customer journey features, Wicked Reports track button clicks. Missing out on other events such as page visits, form submissions, session times, etc affects the ability to customize your analysis and effectively attribute your marketing efforts.
Missing funnels
Wicked reports cannot construct customer journey funnels. The ability to create, customize and filter funnels allows you to see where you lose your visitors. Customizing your conversion flow is vital to optimizing your conversions. A good reason as to why they don’t have this feature is because of their event tracking, or lack thereof.
Web-level attribution
Despite attribution being one of its strong points, Wicked Reports cannot attribute at a web level. Even though they mostly track button clicks that shouldn’t stop them from allowing users to choose a conversion goal. Their conversion goal is always sales. However, it is an “ROI report”, so it is justified. But that doesn’t alleviate the fact that it can’t be attributed at a web level.
Lacking content analysis
Sure, Wicked Reports could technically attribute and even present metrics on content so long as it’s part of a campaign activity. It has no dedicated function that for one, distinguishes its content marketing from its adverts (outside of an organic vs PPC filter). And two, focus on a client’s content strategy and performance.
Miscellaneous Wicked Reports limitations
- The Attribution is not always accurate, values change due to reweighing attribution credits.
- Limited comparative reporting features — cannot compare attribution models.
- There is no in-platform extension for its ad integration to manage ads.
- Outdated and Clunky UI, hard to manage the columns in the reports.
- Takes a lengthy period of time to load reports, anywhere from 12 to 48 hours.
Factors.ai is able to fill in this void. A marketing analytics and attribution solution like factors.ai comes equipped with an extensive list of event tracking capabilities — including button clicks, page view, form submissions, session time, cursor movement, etc. Factors.ai can not only build and customize funnels from the get-go, but can also filter them — at a channel, campaign and keyword level along with a breakdown of all the funnel metrics. Neither Oribi nor Wicked Reports can hold a candle to factors’ attribution facility. Attribute across channels, campaigns, web events, CRM, keywords, etc., making use of several models and custom ones under any conversion goal. Optimize your conversion rate and enhance your content marketing with factors’ content analytics, with access to a multitude of content metrics and dozens of insights.
See for yourself. Book a personal demo with Factors.ai today.
Oribi vs Heap
Marketing Analytics, Web Analytics, and Customer Journey Funnels
Now more than ever, marketing analytics, web analytics, and customer journey mapping is at the core of every marketing strategy. That being said, tracking, collecting, cleaning and formatting data is a laborious chore. Most organisations, especially SME firms, have neither the time nor the resources to devote to these steps. What's more? Only after you have all the data in place can you analyse, report and optimize marketing efforts.
This is where organisations use self-serve marketing analytics solutions to collect and analyse data. There's no shortage of tools trying to solve for quality, self-serve analytics. Picking the right one, however, can be tricky. One such web analytics solution, Oribi, was recently acquired by LinkedIn for over $80 million. As a result of the acquisition, former Oribi-users are on the hunt for alternate solutions — one of them being Heap.
Heap
Founded in 2013, Heap is a San Francisco based product analytics platform that provides insights and data visualization to track customer engagement with a company’s site or product. It maps user behaviour and enables users to quickly access and organise data to recognise sources of friction within the user journey.
Oribi
Oribi is an Israeli based web and journey analytics platform founded in 2015. Oribi helps track site interactions and key conversions. It also allows marketers to get action-oriented and data-backed trends and insights. Additionally, Oribi helps users understand visitor journeys with intuitive, user-friendly reporting mechanisms.
Heap Vs Oribi: Analytics and Integrations
Although marketers can (and do) use both Heap and Oribi to access user journey data, Heap is marginally more intuitive when it comes to tracking user journeys on web-based products. Oribi, on the other hand, is better suited for pure web analytics.
Another point: Heap does not support direct integrations with ads platforms like Google ads or Facebook ads. To be fair, Oribi’s integrations with Google and Facebook is also set to be discontinued as a result of the Linkedin acquisition. When it comes to CRM integrations, Heap allows for both Hubspot and Salesforce. Meanwhile, Oribi only users to push data back into HubSpot.
Heap works by placing a snippet of code at the top of the site and tracks user journeys only on your website or your product. Its primary use cases are product adoption, product-led growth and funnel tracking for the digital experience over the website or application. Heap also enables site search tracking and campaign management. Oribi does not.
Oribi’s funnel helps marketers understand what journeys buyers are taking and where they are losing more users so that marketers know what they have to work on to improve. Similarly, it gives insights as to which type of content works best and drives more buyers to convert.
Shameless plug but Factors.ai delivers the best of both worlds. Strong campaign analytics, web analytics, revenue attribution, funnels, button tracking and more — across ads, web, and CRM. Schedule a personalized demo to learn more :)
Heap Vs Oribi: User Interface
Oribi has often been praised for its simple to use UI. Heap, on the other hand, has been found a bit wanting in terms of ease of use. Oribi has consistently ranked higher across factors like UI, ease of set-up, ease of admin, real-time reporting, etc. However, Heap may have the edge in terms other features like retroactive reporting, integrations and custom event tracking. Although Heap is a non-code platform, users with zero experience have often found the tool a bit complex to set up and the learning curve steeper than in the case of Oribi.
Factors also ranks high (in fact, higher than even Oribi) across ease of use, onboarding, customisable filters and breakdowns for reports. Learn more here!
Heap Vs Oribi: Multi-step digital journeys & multi-channel digital journeys
Both Heap and Oribi help organise and track customer journey funnels. But the funnels are of different kinds.
Heap has been proven to be best for tracking the funnel in a multi-step digital journey, this means that if the user has to take several steps in their digital journey over the application/product or website to get to the end goal or to convert, Heap gives insights as to what steps the user took, in what sequence, when did they complete the goal, where they faced frictions, what step took more time, etc. Their effort analysis features allow you to see what parts of the site give more trouble to the user and why.
On the other hand, Oribi is preferable for marketers to track the funnel in a multi-channel buyer journey. In other words, if you want to see where your potential buyers are coming from, and what actions they’ve taken before they’ve come to the website, a tool that focuses on tracking multi-channel journeys is more useful. Particularly in the case of B2B user journeys, where there are multiple decision-makers, each of which interacts with your product/service on various marketing channels over a longer sales cycle, multi-channel attribution tracking and efficiency measurement of overall campaigns becomes more important for the marketing team.
Pros and Cons of Oribi and Heap
Heap Advantages
- Real-time reports: Heap’s auto-tracking and data governance tools ensure that every single event and every single user is tracked and these data points fit into a data structure from the moment that they are collected. This ensures that the reports are always real-time and the data structure is able to adapt even when events change — without any code or engineering support.
- Allows for retroactive analysis: Since users can retroactively define events and conversions, the data structures and dataset organisations evolve to fit deliverables when they change.
Heap Disadvantages
- High cost of data storage: Because every single user and every single event is automatically tracked on a real-time basis, this leads to a large quantity of data that has to be stored.
- Website analytics focussed: Although Heap supports several integrations, it is more focused on user’s interactions and journeys on the website/product. It also misses ad platform integrations due to the same reason. B2B marketers cannot map out entire customer journeys which in turn, can make it harder to derive insights into overall sales patterns.
- Difficult to use: Its UI is a little complex as compared to Oribi. The learning curve is steeper.
Oribi Advantages
- User interface: The interface and dashboard are intuitive and easy to use for anyone within the organisation.
- Automated data orchestration: Oribi’s ability to automatically send data back into platforms like Hubspot and Google Analytics helps with data orchestration and breaking down of siloes across different storage locations.
Oribi Disadvantages
- Oribi’s CRM integration allows it to send data automatically to Hubspot but it cannot take data from the platform to integrate CRM data for attribution on the user’s larger customer journey on its own platform.
- Oribi’s reporting capabilities have been found lacking as it does not allow for custom filters, breakdowns and formats for data visualisation. The reporting section only allows for pdf reports which can limit how much you can include/exclude.
In closing,
The biggest difference between the two is that Heap is primarily a product analytics tool and Oribi, a web analytics tool. However, because most B2B SaaS products are web-based, the functions of product and web analytics bleed into each other. So Heap is also used for web analytics and vice-versa. At the end of the day, there are several analytics tools that help marketers automate grunt work like data collection, organisation and formatting. They come with different features that help solve various use cases in the day-to-day working of the team. To choose which tool is best for you and your organisation, identify what you struggle with and what tools provide best for such use cases.
We suggest you check out Factors to get the most out of your data!

B2B Sales and Marketing Alignment
Now more than ever, B2B Sales and Marketing teams share the same objective: drive conversions and revenue. Here are a few reasons why alignment between the two teams is crucial — plus a couple of tips on how you can ensure the same.
But first, let’s discuss sales and marketing misalignment
For the most part, Sales and Marketing interact with the same leads and accounts. Once marketing has identified a high-intent lead, they pass them on to Sales, who are then responsible for converting them to paying customers. Too often, however, relevant lead data is siloed between marketing and sales. Crucial information may be missing or inaccessible for either team. This misalignment can lead to misinterpreted data, poor conversion rates efficiency, unorganised customer support, and ultimately, a loss of revenue and pipeline.
This issue is further fueled when both departments use different tools and platforms, inconsistent data storage practices, and deficient analysis. Another, qualitative symptom of this misalignment is poor communication between teams. This can manifest as dissatisfaction amongst sales representatives with the quality of leads being passed down to them and a similar dissatisfaction amongst marketers for an inadequate number of deals being closed by Sales.
The importance of Sales and Marketing Alignment
Alignment of strategies
Often, the strategic outcomes of both sales and marketing are dependent on the toils of each other’s departments. Transparent communication across strategy, challenges, insights and more will ensure that both sales and marketing efforts are complementing each other in driving revenue.
Improve productive prospecting
Often, when sales and marketing are misaligned, the leads coming down the funnel may not seem very valuable to the SDRs. This can lead to:
- SDRs ignore a majority of the leads being sent to them by marketing
- SDRs recycling old leads
Both of these symptoms signal inefficient prospecting. Sales and marketing lead to both teams setting up clear parameters for which contacts to send to sales and sales also understands why a certain prospect showed promise from the marketer’s perspective. This leads to increased productivity for both salespersons and marketers as well as improved conversion rates.
Seamless workflows
Sales and marketing alignment requires alignment across technology and data as well. Data, tools and platforms should maintain consistency across the board. This ensures that information sharing and interpretations are seamless and accurate.
Shorter sales cycles
B2B sales cycles tend to be long due to more touchpoints and conversations with reps before the final purchase decision. The process tends to be easier further down the funnel. However, most people avoid initiatives like sales calls and emails. A more collaborative marketing-sales dynamic can help shorten the cycle and improve conversions through content strategy, nurturing activities, etc — that have inputs and perspectives of the salesperson as well as the marketer.
Tips to improve Sales and Marketing alignment
1. Define common terms
Definitions as simple as qualified leads, MQLs and SQLs can be different for sales and marketing within the same organisation. "This may become a major cause of miscommunication and dissatisfaction with lead quality. Ensuring that everyone is aligned on the definitions and parameters of terms that are integral to both departments can avoid async activity and productivity loss." - says Milosz Krasinski, Managing Director at miloszkrasinski.com
2. Identify target audience
Aligning the goals of ‘lead generation’ and ‘lead conversion’ begins when both teams sit down and identify the ideal target audience. Dissatisfaction arises when lead identification by marketing and sales are not aligned. For B2Bs, it involves knowing the firmographic features like firm size, industry specifications, titles, revenue etc. This also involves creating core messages together so that both teams are aligned on positioning as a lead goes through the buyer journey.
3. Define goals and strategies together
It is imperative for both sales and marketing to be clear on outcome metrics like pipeline and revenue. This ensures that sales have input on defining sales readiness, making communication between teams clear and productive.
4. In addition to sales funnels, perform revenue attribution
The traditional sales funnel is linear in nature as it only comprises the following structure:
Lead->Prospects->Clients. Attribution modelling is a holistic way to look at all the non-linear touch-points during conversions.
5. Create a process for leads engagement
Another consequence of organisational misalignment is the formation of distinct funnels — one for lead generation and another for conversions. Combining these two funnels will encourage comprehensive, high-efficacy engagement across the buyer journey going through the customer journey.
6. Alignment across tools and tech
The best way to ease communication and close down data silos between sales and marketing is to use tools that promote alignment. Attribution and analytics tools that collate data from all touchpoints of the user journey across ads, web, and CRM (ie. both marketing and sales touchpoints) allow seamless data analysis, reporting and insight derivation for both teams. This can promote further collaboration and synergy between both organisations.
The B2B Sales Funnel Unveiled: Insights & Best Practices
Understanding the B2B Sales Funnel
When it comes to B2B marketing, qualifying your sales leads is not an easy job. Given the several steps involved in a B2B customer journey, visualizing each one as a funnel can be insightful (and actionable). It identifies what’s helping and hurting conversion rates along a prospect’s journey to becoming a customer. Which in turn, helps optimize the journey and improve conversion rates.
What is a B2B Sales Funnel?
A B2B sales funnel is a visual model that illustrates a prospect’s journey. The funnel graphically represents the proportion of prospects present in all stages. It can also represent customer engagement and break down each interaction from first-touch to deal-won. Here’s why a B2B funnel differs from a B2C funnel:
* Unlike in B2C, a B2B prospect is composed of several decision-makers who would have to greenlight an investment.
* The sales cycle in B2B is considerably longer than a B2C one. This is not only because of the layers of approval required but also the meticulous research, review, and demos, and larger contract values.
* In a B2B endeavor, customer retention and the need to build a long-term relationship with clients are critical for long term success. Hence, brand building is placed on a pedestal for B2B customer engagement.
Breaking Down the Stages of the Funnel
Several terms exist for the different stages of the funnels. Functionally, however, most of them are relatively synonyms. For the sake of simplicity, a B2B sales funnel can be divided into 3 levels:
1. Top of Funnel (ToFu)
2. Middle of Funnel (MoFu)
3. Bottom of Funnel (BoFu)
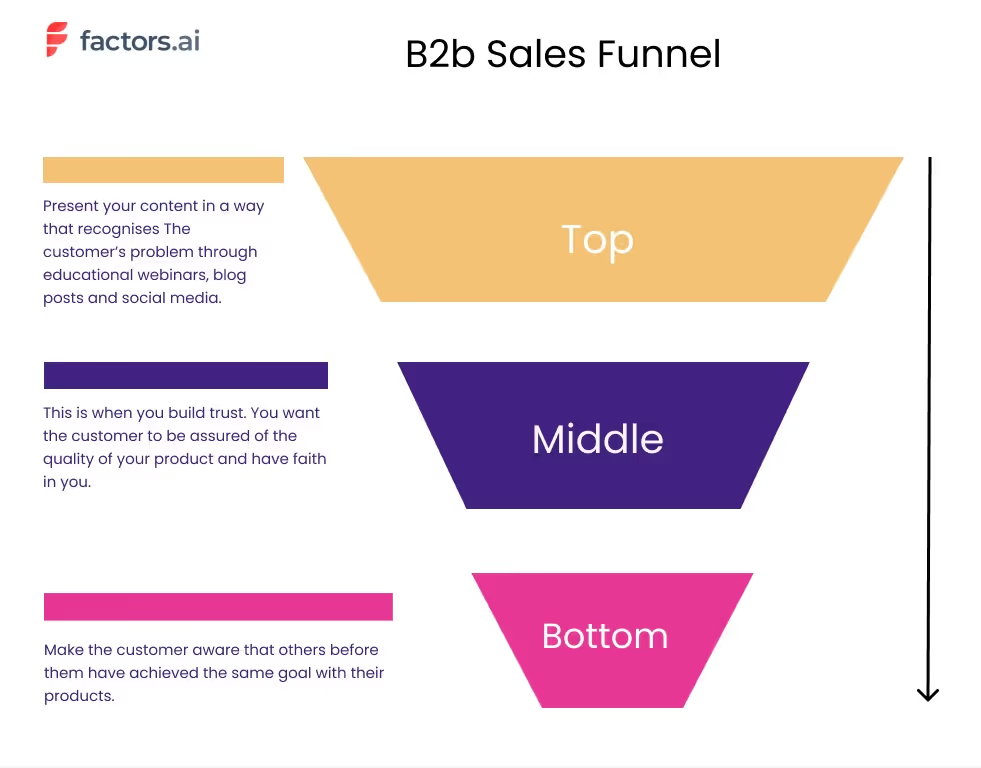
Picture of funnel broken in three parts; top middle bottom. On the left of the funnel write down what is buyer intent?
On the right side of the funnel; list down the marketing efforts commonly used at that stage; like top stage is content marketing and blogs.
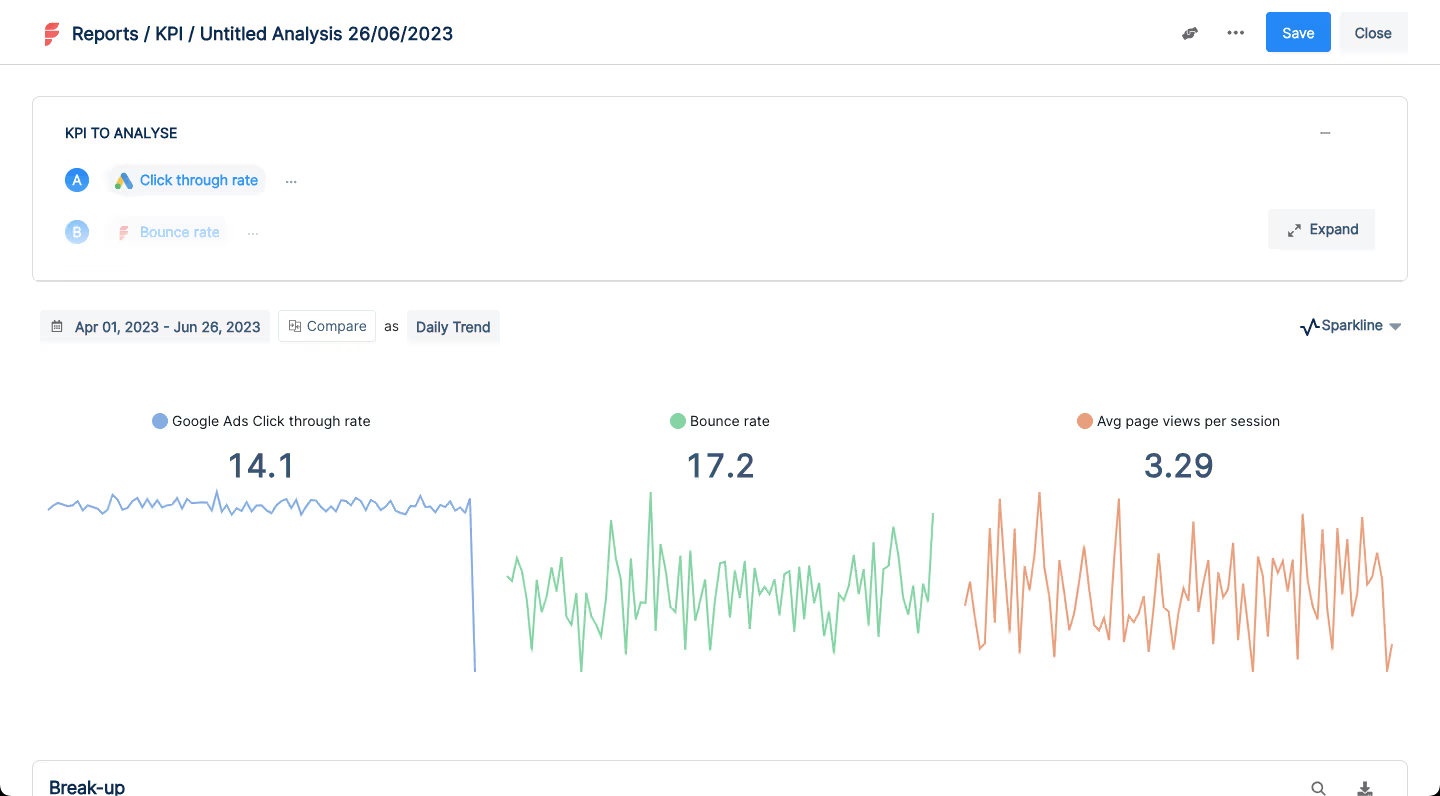
When guiding your users through the funnel, there are several you can use to assess whether you’re doing it successfully. These metrics can help you evaluate past performance, predict future trends and optimize your current efforts. Some of these are click- through- rate, conversion, content shares and SEO metrics. Analytics software like Factors and Google Analytics can be used according to your campaign goals, content channels and campaigns.
Top of sales funnel
The top of funnel level deals with the awareness and interest stage in a prospect’s journey. The objective of this stage is to consistently bring in fresh, new traffic. At this stage, prospects may not be entirely aware of the problem you’re solving. From a B2B standpoint, this not only involves your advertising, but is heavily centered around content marketing, educational content creation, & building a strong organic presence.
B2B prospects commonly require significant nurturing before going further down the funnel. For example, a company like Salesforce revolves their content strategy around CRM among other things educating prospects on all things CRM related and more.
Common top-of-the-funnel marketing touchpoints include:
- Blogs
- Podcasts
- E-Books
- Webinars
And key top-of-the-funnel metrics to track include:
- Number of site visits
- Web session duration
- Bounce rate
- Keyword rankings
- CTR
- Mail open rate
Middle of Sales Funnel
"This level of the funnel corresponds with the engagement stage of a prospect’s journey. After creating awareness and defining the problem, prospects would now evaluate their solutions. At this stage, you would need to build your brand authority and elucidate how your solution is the superior option." - says Milosz Krasinski, Managing Director at Chilli Fruit Web Consulting.
The approach to marketing changes at this level. Here, content becomes increasingly brand-oriented and employs lead magnets or gated content to bolster your brand authority. This can also be ensured by hosting webinars, events, and live-demos. MoFu blogs also tend to be more product heavy as opposed to industry-specific.
Common middle-of-the-funnel touchpoints include:
- Comparison articles
- Retargeted ads
- Product reviews
- Trial sign-ups
Bottom of Sales Funnel
Not to be confused with the expression “being at the bottom of the barrel”. The bottom of the funnel is a crucial stage in the buyer’s journey. It’s where you would ultimately want to guide all your prospects towards. It is known as the conversion stage because at this stage prospects make a purchasing decision and possibly convert into customers.
It must be noted that bottom of funnel prospects can vary depending on your conversion goal. It could even include prospects that sign up for a demo, make an account, mail a product query, or anything that expresses high engagement with the brand or product. Based on historical trends, you could identify which conversion goal is conducive to a prospect becoming an MQL, an SAL, or an SQL.
At this level, the sales team starts to get involved. It’s the combined effort of sales and marketing that ultimately onboard customers through promotional offers and strategies. Considering the B2B sales cycle, this is still a long, arduous process. The bottom of the funnel also helps form the ideal client profile which serves in identifying target accounts with ABM (account-based marketing).
How to Guide Users through the Sales Funnel
The core objective of the funnel is to help guide potential B2B customers through the process, without spending too much or overdoing it and driving them away from making a purchase. However, once you have identified what stage your customers are at- what next? It is important to take advantage of this new information to adapt your content to target your customers better.
Along each stage of the sales funnel, content must be curated to drive up customer engagement. And the type of content that customers expect differs at different stages of the funnel. Let’s look at how buyer intent differs across the three stages of the funnel:
1. Top of the funnel: The customer has arrived at your ad because there is a problem that they are facing. Present your content in a way that recognises their problem through educational webinars, blog posts and social media.
2. Middle of the funnel: Remember that at this point, your customer is still looking for a solution. This is when you build trust through content marketing campaigns, blog posts. You want them to be assured of the quality of your product and have faith in you.
3. Bottom of the funnel: In this last stage, make them aware that others before them have achieved the same goal with their products. Use testimonials, product USPs and case studies to drive your point home.
Flipping the Funnel: An Alternate Way
Instead of using the conventional B2B funnel, Binnet and Field suggest flipping the funnel. This means to think of the funnel as ‘in market’ and ‘out market’ buyers. Instead of looking at your B2B customer journey as a funnel that has a narrower customer base at each stage, focus on different aspects like ‘activation’ or ‘branding’ at the in market and out market stages respectively. Find out more about this alternate perspective here.
In Conclusion…
The stages of a B2B marketing funnel are diverse. Each stage adopts different types of content strategy, tactics, interactions, and analytics. This makes it all the more essential to compartmentalize efforts into an organized funnel, making the process disciplined.
The funnel not only keeps track of your prospects at each level but also identifies different pain points that limit prospects from moving down the funnel. Measuring your funnel helps distinguish your leads better too, which can be quite useful given that 79% of MQL are never converted to sales.
From a B2B angle, the funnel highlights the importance of efforts like SEO, building domain authority for TOFU and long-form product heavy blogs for MOFU, etc. Given the nature of B2B prospects, all these factors contribute to the movement down the funnel.

Predictive Analytics In Marketing
Outline:
1. What is predictive marketing?
2. Predictive analytics models: cluster, propensity, recommendations filtering
3. What predictive marketing can do for you
4. Other factors to keep in mind
A large part of B2B marketing success hinges on B2B marketing strategy. Teams put in hours of time and effort to come up with robust, encompassing plans to drive growth. However, it's impossible to determine how exactly your strategy will pan out...until now. Enter: Predictive Marketing
What is Predictive Marketing?
As is evident from the name, Predictive Marketing helps marketers predict their marketing outcomes in terms of expected traffic, expected leads, conversions and impact on ROI at various touch-points
In other words, predictive marketing is the process of forecasting the influence of marketing campaigns and tactics with the help of:
- Historical data on audience behaviour
- Consumer research
- Purchasing history of target consumers
- Holistic marketing analytics
This forecasting is done using predictive analytics. B2C/E-commerce firms like H&M and Amazon already use this to predict products that their consumers would be interested in buying based on their current search keywords and products that they are clicking and opening in the catalogue, their past purchases, what other products similar consumers have purchased after similar search queries, purchases, items, etc
Measurement Models for Predictive Analytics
- Cluster Models: These models are used to segment consumer based on behavioural data (past purchases, brand engagement, etc) and demographic data. The most common predictive algorithms used for clustering are behavioural clustering, product-based clustering, and brand-based clustering.
- Propensity Models: As the name suggests, these models are used to evaluate consumers’ tendencies or inclinations to act/engage in specific way. These model evaluate the likelihood of a consumer to purchase, convert, etc.
- Recommendation Filtering: H&M, Amazon and Netflix are some of the most common examples of firm's that use recommendation filtering. It refers to using past purchases or consumption history to find other sales/revenue opportunities.
What can Predictive Analytics do
for B2B Marketers?
Predictive lead scoring: Predictive lead scoring helps you make efficient utilization of your total set of leads. In short, it involves the scoring of leads based on priority. The highest intent *or audience with the highest chances of converting) are scored higher and those who are not likely to purchase or remain in the funnel are scored lower. This helps determine who to prioritize and divert marketing efforts towards.
Automated social suggestions: Predictive analytics can also analyze audience engagement trends across social channels to suggest the best times to post content, provide content suggestions, and conduct granular A/B testing of two or more variations of content to predict which one performs better.
Preventing customer churn: The most important step after acquiring a customer is not acquiring more customers, rather it is ensuring the engagement and retention of current customers. Predictive analytics also help you identify and re-engage customers who might churn with relevant marketing material.
Predictive SEO: In addition to improving traffic and SERP rankings, predictive analytics like search trend insights can also prevent the loss of SEO momentum and ranking. Essentially, predictive SEO helps you determine if a webpage is about to lose its SERP rankings and predict topics for blog posts that your audience wants more of.
In conclusion...
At the end of the day, predictions don’t always come true. So it is important to be aware of the fact that some of the predicted outcomes will not materialise as expected. There is always the human element to the actions of your human audience which even the best algorithms may fail to forecast. Predictive analytics, like any other form of data analytics require a lot of data to be able to make statistically significant predictions. Employing proper systems to collect, clean and crunch loads of consumer behaviour data, historical data and analytical data is key to ensure accurate predictions.

What is Content Analytics and How Should You Approach It? Here’s What 10 Experts Have to Say
As digital marketing takes on new complexities, it’s essential for your marketing plan to incorporate content analytics. This will help you have a more detailed understanding of how customers interact with your company. You’ll be able to make more informed, data-driven decisions to effectively reach and convert your target audience.
What is content analytics?
Content analytics, or content intelligence, is a set of technologies that analyzes digital content in order for you to understand which content is performing well with your target audience. This enables you to create the most effective digital content possible to drive more conversions.

How does content analytics work?
B2B companies often offer highly specialized solutions. Accordingly, businesses must target their niche audiences with dedicated marketing initiatives and content that address relevant paint-points and use-cases.
You can generally figure out which content works best for your clients by analyzing certain metrics for the unstructured content your business has put out. Analytics and attribution tools like Factors.ai help marketing teams with granular insights into content performance and bottom line impact.
It’s important to remember that content analytics and attribution isn’t a linear process. We got in touch with B2B content industry leaders to ask how many metrics they use to measure content performance. Here’s what they had to say:

We also asked them which metrics they think are the most important in measuring the effectiveness of content. Here’s what they had to say:
- Clickthrough rate (CTR): Sophia Madhavan at GrowthMakerz and Vitaliy at Videowise include the CTR in the list of metrics they use to evaluate how well their content is doing. The CTR allows you to see how many times visitors to a certain page organically search for your content or click on your ad as a ratio to the total number of visitors to that page.
- Impressions: Impressions give you insight into the level of engagement your content is generating. This content could be a web page, advertisement, or blog post, for instance. Madhiruma Halder at Recruit CRM lists impressions among the metrics they use to understand how their social media campaigns and search engine marketing are performing.
- Marketing qualified lead (MQL): Not all leads are created equal. A lead that takes any high intent actions like scheduling a demo or signing up for a trial is far more likely to convert than others. Karishma Chopra at Hiver believes that the effectiveness of content should be measured in terms of its influence in driving MQLs.
- Time on page: The time a prospect spends on a particular page is indicative of their interest in the solution you’re offering. Praveen Das at Factors then uses these insights to create marketing campaigns informed by the content their prospects and clients are interested in.
- Scroll depth: Scroll depth is a measure of how far your website visitors scroll down a certain page. As a general rule of thumb, if most of your website visitors are scrolling at least halfway down the page, it indicates that your content has substantial value.
- Unique users: Chelsea Downing-West at The Martec finds unique users a crucial metric. The number of unique users may be challenging to calculate. Effective visitor identification allows you to see how many unique visitors your website receives by counting each visitor only once, no matter how often they visit the website.
- Bounce rate: The bounce rate of your website indicates the ratio of visitors who access your website and leave instead of clicking on and going through other webpages.
- Engaged Accounts: Understanding which specific accounts are consuming the content is another intuitive way for content marketers to analyze its effectiveness. Visitor Identification softwares like Factors can help marketers identify the account and its properties (employee range, industry) even if the user does not fill up a form. This helps Content Marketers plan content efforts tailored to specific industries or scale of employees.

Why is content analytics important?
Your website content is the first thing that prospects see when they’re evaluating your company. It creates a lasting impression about your services. Content analytics helps you understand the types of content that perform well among your target audience, which in turn is crucial to designing a successful customer experience.
Moreover, marketing teams spend a substantial amount of time and budget to create content that prospects find valuable. A few of the experts we surveyed responded that they hire in-house teams for content creation and distribution. This indicates how valuable creating effective marketing content is to increasing overall revenue; B2B companies are willing to invest in salaries, 401(k)s, and insurance to generate engaging content. Respondents stated that they spent anywhere between $1000 and $10,000 a month towards content creation and distribution.
This expense makes sense when you consider how much content contributes to the overall pipeline. Respondents stated that the monthly investments they make towards content creation reaps significant rewards. Although responses varied greatly, most of the experts cited that around 30-40% of the pipeline is influenced by content creation and distribution.
Creating valuable content for prospects is almost entirely dependent on content analytics. Content analytics offer your sales and marketing teams multiple benefits:
- Helps marketers redefine their strategy based on how current content is performing
- Calculates the ROI for each piece of content, which in turn guides future content strategy and content repurposing.
- Superior prospect experience by focusing on the most relevant content and elimination of guesswork
- Quicker and easier conversion for prospects by offering them content that is relevant and important for them at each stage of the funnel
- Cuts down on redundant content by immediately finding out when certain pieces are underperforming
How can content analytics contribute to a better customer experience?
Understanding each interaction a prospect or customer has with your website and other marketing collateral enables you to improve your content offerings. You’ll be able to offer customers a far better experience by analyzing and iterating based on content data. Content analytics helps you:
Offer relevant content
You can offer clients valuable content depending on where they are in the conversion process. Content analytics help you anticipate which content is relevant at every stage of the funnel, thereby streamlining communication with prospects and clients alike.
Address specific client needs
You can also create a 360-degree buyer persona for existing clients. An integrated analytics software like Factors allows you to have a holistic overview of each client so you can see every interaction they’ve had with your company. You have access to each touchpoint and all their past behavior, thereby enabling you to make educated guesses about their pain points.
For instance, let’s say you run a company that creates CRM software. You could find through trends in content analytics that customers from the tourism industry are interested in the customer service features it offers. On the other hand, customers in the tech industry are more interested in its customization and workflow automation features. You can then use these trends to offer them content that best fits their needs.
Hyper-personalize your content
Prospects today expect a highly customized experience tailored to their needs. It’s essential to curate a personalized experience in order to create a lasting client relationship. Understanding which channels your client base uses, the keywords they’re interested in, and the time they spend trying to solve a pain point on a webpage are all crucial to personalization.
Make better decisions
Content reporting can help you make deeply informed decisions with respect to pricing, sales, organizational goals, and communication. You’ll never have to rely on guesswork again; all you need to do is gather user data through an analytics tool and leverage it relentlessly.
Your clients have needs that are continuously evolving, so you have to continuously utilize real-time data to create adaptive strategies that help you get the most out of your investment.
What are the biggest challenges of content analytics?
Customers’ preferences and expectations from content are constantly changing. Jess Cook from LASSO puts it best: content analytics isn't an exact science. Here are the biggest challenges that marketing and sales teams encounter in the process of analyzing content data:
Data silos
Your sales and marketing teams need access to a unified customer data infrastructure. End-to-end account journeys are of the utmost importance when you’re streamlining the sales and marketing processes. If your sales and marketing teams work independently of each other, there’s a huge chance that they have access to disconnected data.
Data silos lead to an underwhelming customer experience. The sales team should have access to all the marketing touchpoints the user has been through to avoid repetition, tedium, and misunderstandings in the sales process.
Visitor identification
De-anonymization is crucial to effective analytics, since you need to see how many unique visitors your website is drawing and the firmographic characteristics of these users such as company name, industry, employee range and revenue range. However, all users on the internet want anonymity, and there are laws to protect user data from illegal tracking.
Free content analytics tools have limitations
Tools like Google Search Console (GSC) offer users limited insight. Saffia Faisal at Userpilot believes that GSC is inadequate for dedicated content analytics and reporting. B2B companies require an in-depth analysis of how their content is performing. GSC’s algorithm limits accuracy in reporting, providing just a signal of how content performs. GSC also imposes limitations on the number of rows of data that can be exported at a query level.
How content analytics works in Factors
Factors.ai connects the dots between web sessions and CRM events to answer this question through automated form captures, customer journey funnels, and AI-powered inflection analysis to determine what content is helping/hurting larger objectives
“How are my website resources driving form submissions, MQLs, SQLs, Opportunities, Deals, and ultimately, Revenue?"
Content marketers and sales strategists need access to real-time, relevant data that provides a holistic overview of content and customers alike. These insights can help tailor new content based on what works, thereby driving greater revenue.


Automated insights to determine web content's impact on custom conversion goals
Customizable dashboards
Remember the data silos we mentioned earlier? They slow down the progression of the accounts into the sales funnel and may lead consumers to drop out of it altogether. With Factors, however, you have all your customer information present on the same dashboard. Your sales and marketing teams will have access to consistent information, and will be able to see all your clients’ touchpoints. You can choose which metrics you want to view on the dashboard.
Easy account identification
With Factors’ reverse IP lookup, you’ll be able to identify which companies are interested in your solutions through their website visits. If an individual in a company visits your website, Factors will match its IP address within its existing database and identify the company name and domain, industry, annual revenue, and employee headcount. Since the database relies on publicly available data and the data you draw from your website, this process is fully compliant with user privacy protections.
You’ll also be able to see which stage of the funnel a particular prospect is at by the type of content they consume. Once you know the identity and needs of your prospects, you can target them in a personalized manner.
Automated analytics and attribution
Your sales and marketing teams won’t need to crunch numbers or look for missing information. Factors provides all the data you need, such as time on page, page load time, button clicks, scroll percentage, and page views. By automating the process of content data collection, your teams can focus their energies on strategizing and creating quality content for clients.
Factors’ multi-touch attribution model helps your company understand the customer journey and give credit to the touchpoints involved in the conversion process. It provides more detail with respect to user behavior when compared to single-touch models. A multi-touch attribution model aims to highlight which touchpoints have the greatest influence in the account’s journey, and how they work together.
Adaptation based on new insights
Your customers’ requirements are constantly evolving. It’s necessary for your analytics and attribution systems to respond to these nuances. Factors allows you to obtain instant insights about which content assets are redundant or performing well. You can use these content performance reports to refresh older content and push pieces that are doing well across more channels.
Get in touch with us today to find out how Factors can help your company improve its content analytics and reporting.

____________________________________________________________________________________________
Dive in Deep with Factors
Factors.ai takes content analytics one step further with extensive breakdowns + filters, custom dimensions + KPIs, and Content Groups.
As a content marketer, you may be interested in granular insights into your resources. “What geographies are consuming most of my work?”, “Is my blog being read more frequently on a phone or on a desktop? Should I optimize accordingly?”, “What campaigns, channels, and sources is web traffic originating from? “What about my SEO efforts and organic traffic?”.

Factors.ai answers these questions and more with an extensive range of filters and breakdowns. Additionally, there’s ample flexibility to create your own custom events and KPIs if you’d like to track tailor-made metrics.
Finally, with Content Groups, you can group a collection of logically related URLs that make up your overall website content. For example, core web pages like “features” “pricing” and “product” may be defined under one group to measure holistic performance. Similarly, blog articles written with specific intent can be analyzed all in one go. No doubt, a handy feature for content marketing analytics.
FAQs
How do you use analytics in content marketing?
Content analytics include reporting on website, marketing, and sales metrics. Understanding how customers interact with your content allows you to personalize your marketing campaigns in order to drive more conversions. Measuring these metrics also helps you address specific pain points and therefore improve the overall consumer experience for your solution.
Which metrics should I measure for content performance?
We asked experts about the metrics they keep track of to ensure high content performance. Their responses included clickthrough rate, impressions, marketing qualified leads, scroll depth, time on page, unique visitor identification, downloads, funnel movement, influenced demos, and bounce rate.
And there you have. Our customers regularly use Factors.ai to make sense of their content performance and guide their B2B content marketing strategy with the help of granular web page analytics, end-to-end customer journey insights, and flexible content reporting. If you’d like to learn more about our work at Factors, schedule a personalized demo today.

5 Reasons Why CMOs Should Care About B2B Marketing Attribution
B2B Marketing Attribution (or B2B Revenue Attribution) empowers demand gen teams to map out their customer journeys and connect the dots between marketing and revenue. At a high level, attribution weaves the story that your marketing data is trying to tell about the influence of each touchpoint on core business objectives. As multitouch attribution technology improves, B2B attribution is becoming an increasingly powerful tool for CMOs to wield. Here are 5 way in which CMOs and marketing leaders can take advantage of B2B marketing attribution.
1. A Bird’s Eye View Of Marketing Efforts
B2B marketing attribution empowers marketers to capture nearly every touchpoint across the customer journey. This is valuable information as most B2B buyers are already halfway through the sales cycle before they explicitly engage with a sales rep.
Your customers have likely interacted with plenty of marketing channels and content before being picked up by the sales team. Moreover, many of these customers become high intent buyers even before sales or marketing identifies them as such. In such a case, it becomes important to know:
- Which touchpoints help them make their decisions
- What content or marketing activity influences them to further pursue a product or engage with your company
- What content helps users narrow down your product over your competitors
- At which touchpoint do customer generate buyer intent,
- At what touchpoint do customers lose this intent
This helps CMOs understand user journeys as well as the efficiency of various marketing efforts in influencing customer decisions. It gives insight into the precise point in the funnel during which to target customers and optimize conversion rates, which campaigns to allocate budget to, which touchpoints are weak links in the buyer journey, and more.
2. Achievable Targets
Marketing attribution, being the data-driven technique that it is, helps CMOs undertake goals in terms of achievability and feasibility. More importantly, attribution uses metrics that can be used to track the progress as well as the success of various campaigns across various channels. This also helps in planning larger goals as well as yearly sub-goals with forecasting, tracking and analysis of campaigns and their impact on revenue. Such goal-setting is not vague as it is thoroughly backed by data.
3. Improve Productivity and Alignment Across Demand Gen
As your business grows and your marketing campaigns and sales processes start to scale, it can be challenging to track which campaign brought in which leads. Sales and marketing activities tend to become more siloed and communication gaps between the two teams can widen. This can lead to a lot of inefficiencies in the handing over of leads from marketing to sales. Marketing may have insights on which touchpoints impacted most positively to a certain lead that can help sales reps during their engagement. Conversely, sales reps may have insights through their engagements on what information or campaign content helped customers make their buying decision. CMOs can use marketing attribution to align the processes of these teams and improve the productivity of each campaign and each SDR by unifying customer journey reports and touchpoints onto one platform.
4. Accountability and Reporting
With attribution, marketing leaders can easily generate reports of the most important metrics for their business and board. Moreover, it’s convenient for CMOs to track the performances of their various teams and understand the contributions of each team on conversions, pipeline, and revenue. For example, if a certain blog posts incurs recurring URLs for all leads that have converted, then it is a good idea to give more resources to the content team and perhaps even hire more writers. Attribution gives you hard data on metrics like website traffic and what pages they visited and how much time they spent, whether they filled a form or if they left without any activity, whether they clicked on a discount code or a free whitepaper or if they were not able to notice it — this can give a CMO a good idea on the interface and content of the website. In essence, attribution helps you hold each team accountable by getting a data-backed view of their performances.
5. Driving Growth
Marketing attribution recognizes trends and makes sense of the confusing quagmire of touchpoints in any marketing and sales funnel. Data is unequivocally important in driving sustained, scalable growth. If there is seasonality to when you get more qualified leads or there are specific blog posts, ad campaigns or social media platforms bringing in higher traffic and driving growth, attribution makes it easy to identify these high performing channels and take advantage of them. Most attribution tools have built-in integrations for various ad platforms, social media sites, CRMs and website tracking tools that ensure that regardless of how big you grow, you always have a handle over your customer tracking and don’t lose out on important insights that may get lost in high volumes of data.
In conclusion,
B2B Marketing attribution is a powerful tool for any CMO in 2022 to get the best insights from both internal and external data sources that an organization has. Forecasting, tracking trends, revenue impact, ensuring accountability, saving time and human resources on reporting to focus more resources on analysis and implementation, ensuring accuracy in reporting — are all foundational to building and executing powerful marketing campaigns. With marketing attribution, CMOs can make data-driven, informed decisions and enable their teams to deliver more with less spending and better, useful insights.
Factors Vs. Google Analytics (GA4)
GA4: End Of The Road For Google Analytics?
Over the last decade, Google Analytics has dominated the marketing analytics space. This uncontested reign can be attributed to a couple of key reasons: One, GA is free. And two, GA maintains a monopoly over historical data for an enormous install base. While the former isn’t likely to change, the introduction of GA4 is set to crush 10+ years of backward compatible data for millions of websites — including yours.
By breaking history and forcing a migration from Universal Analytics to GA4, Google Analytics loses an important advantage. This, coupled with a host of issues around UI, functionality, and privacy has resulted in a dramatic turn in tides. If users are going to lose out on their historical data by next year anyway, there’s little incentive for them to stay — especially when the best Google Analytics alternatives are readily available.
“We will begin sunsetting Universal Analytics — the previous generation of GA — next year. All standard UA properties will stop processing hits new hits on July 1st, 2023” - GA Support
“GA4 feels like a huge step backwards. Tons of functionality in the previous version is missing or replaced with smart “insights” — which always goes wrong. A good time to move on to something better” - Hacker News
With this in mind, The following article compares Google Analytics (specifically, GA4) with Factors to demonstrate why, now more than ever, the latter is better suited for B2B marketing analytics, web analytics & CRO, multi-touch attribution, and more.
____________________________________________________________________________________________
Data Integration
To be of any value, B2B marketing analytics requires substantial data from a wide range of sources. This includes granular metrics across all your ad campaigns (Google, Bing, Facebook, Linkedin, Capterra, etc.), website, and CRM (HubSpot/Salesforce) events. Ideally, this body of information is unified under one platform to ensure normalized data and alignment across demand gen teams. So how does Factors compare with Google Analytics when it comes to data integration? Here’s the rundown:
Ad Campaign Metrics
Google Analytics can report basic traffic data from most commonly used social platforms — Google Ads, Facebook/Meta, Linkedin, etc. Integrating non-Google sources, however, is significantly more challenging on GA. It requires the construction of custom campaigns using URL builders (read: a time-consuming, laborious chore). Factors, on the other hand, deliver immediate no-code integrations.
The real issue with GA, however, is that it cannot pull metrics that matter from any source that isn’t Google Ads. Commonly tracked figures like impressions, engagement, click-through rates, etc cannot be reported, let alone linked with website or CRM data. This is a headache for users looking to consolidate all their marketing efforts under one roof. Factors solves for this by automatically pulling granular metrics across the board.

CRM Integration
This is another big point for Factors. Unlike GA, Factors provides robust integrations with HubSpot, Salesforce, and soon, Leadsquared. The implications of this are significant. Marketers will have the ability to connect the entire customer journey from first touch to deal won. In turn, marketers can determine exactly how their efforts across ad campaigns, web content, and offline events are contributing to larger business objectives like pipeline and revenue. This is simply not possible on Google Analytics as it does not integrate with any CRM whatsoever.

Third-party Integrations
Another reason Factors has the edge over Google Analytics is third-party integrations. Factors integrates with the likes of Clearbit Reveal (Deanonymization), Segment (CDP), Drift (Chatbot), and more to ensure an actionable web + marketing analytics experience. Again, this is impossible on Google analytics because GA4 does not integrate with third-party platforms. Consequently, this affects the quality of customer journey insights. Even with sophisticated manual analysis, the data derived from Google Analytics is likely to remain superficial at best. In later sections, we’ll explore the implications of this issue in detail.
___________________________________________________________________________________________
Implementation & Onboarding
So far, we’ve established that data integration (including third-party) makes more sense with Factors. Next, let’s examine how the two marketing analytics tools compare with regards to implementation and onboarding. For context, if you’re currently using Universal Analytics, you either have to upgrade to GA4 by next summer (June 2023) or find a GA alternative like Factors.
What does it take to upgrade to GA4?
12-steps. That’s right. It requires 12 steps before you can upgrade from Universal Analytics to GA4. What’s more? As previously mentioned, integrating with non-Google ad platforms needs elaborate orchestration with custom campaign URL/UTM builders. Additionally, GA4 requires users to manually tag each event they want to track. In short, this means significant labor effort, engineer dependency, and time-spent waiting for incomplete datasets.

What does it take to set-up Factors.ai?
Maybe about 30-min. In fact, it’s probably closer to 10 with Google Tag Manager. Simply place the superlight SDK onto your website and integrate (no-code!) with your ads platforms, CRM, CDP, Chatbot, and more. Before you know it, all your marketing + web data will begin pouring into a single, normalized platform. Easy as pie.

____________________________________________________________________________________________
B2B Marketing Analytics
Now, let’s discuss functionality. Here’s how Factors compares to Google Analytics when it comes to core use-cases of a B2B marketing analytics tool.
Right off the top, it should be noted that GA isn’t built for B2B marketing analytics. It struggles to support tracking for journeys that involve several months, touch-points, and stakeholders. Unfortunately, these are the precise characteristics of a standard B2B sales cycle. Customers often experience countless (well, on average, 7) touchpoints — both online and offline — across ads, emails, webinars, blogs, web sessions, etc before converting. These touchpoints can occur within a window of one week, one month, or sometimes, even longer than one full year. Unlike Factors, GA4 isn't designed to analyze or attribute lengthy, sporadic interactions for B2B marketers.
Additionally, and as previously mentioned, GA is unable to track and measure granular campaign or event metrics from non-Google platforms. Since B2B marketers target (and retarget) marketing efforts to their audience across several channels, it’s nearly impossible to consolidate these figures on GA alone.
Factors eliminates this data silos issue for marketers and demand gen folk with the help of aforementioned third-party integrations. Once data has been collected, Factors delivers an end-to-end marketing analytics suite that’s tailor-made for B2B teams.
This includes web analytics, funnels, custom events and KPIs, multi-touch attribution and more. Let’s explore why Factors has the edge over GA across these use-cases.

Data Accuracy, Marketing Funnels,
Revenue Attribution, & More
At its core, Google Analytics is a website analytics service. And to be fair, GA does a half decent job at it, especially for a free tool. That being said, there are significant limitations with GA that Factors solves for:
Data Accuracy
Certain web metrics are not precise on GA. Let’s say a lead lands on a blog on your website. Before they can start to read the article, their doorbell rings and they leave to answer with the blog page open on their laptop. The lead returns in about 8 minutes, clicks out of the blog to schedule a demo. Google Analytics would inaccurately assume that the blog played a massive role in this conversion because of the significant (8 min) time spent on page. In reality, however, the lead did not scroll even a little to read the rest of the piece. Factors solves for such issues by tracking granular details like cursor activity and scroll depth percent to ensure your data, and the insights derived from that data, is as accurate as can be.

Marketing Funnels
On GA4, you’re limited to page-to-page funnels. That is, GA4 only considers funnels wherein each webpage is a separate step. As such, GA4 struggles to track multi-session engagement. Let alone a funnel across ads, web, and CRM. Funnels on GA may only be used to reliably measure drop-offs and conversions that occur in the length of a single web session (Eg: Blog -> Pricing -> Schedule Demo in one web session). Additionally, event funnels are not supported on GA4. Hence, if you’d like to track how specific website content is contributing to MQLs, leads, & revenue, GA4 won't suffice.

Customer Journey + Revenue Attribution
As previously mentioned, GA does not integrate with CRMs like HubSpot, SalesForce, or Leadsquared. This severely impedes cogent customer journey analysis and revenue attribution. Without laying the entire map from ads, offline efforts, web sessions, and CRM events, you are left with an incomplete picture of what’s driving revenue and pipeline. Consequently, this affects data-driven decision making, which ultimately results in suboptimal marketing strategy and ROI. It is not feasible to derive end-to-end marketing insights into what’s working and what’s not with Google Analytics. While GA might be able to track the source of traffic, it cannot determine the cause.

Usability - UI and UX
What’s surprising is that even with these significant drawbacks, users complain about GA4’s useability. It can be overkill — unintuitive, excessive, and far too technical — for marketers looking for basic reports. And completely irrelevant to marketers looking to dig deeper into their data. Let’s let twitter expand upon this…
Website owners, is it just me or is the new GA4 just HORRIBLE? It's like it's designed only for retail sites or something, very hard to get the basic info that I used to rely on... Think I'll switch back! Awful!
Trevor Long (@trevorlong)
I usually can find my way round any piece of software quickly. But Google Analytics 4 is making me cry...I've never seen a tool upgrade that made simple things sooo complicated :face_palm: Non-tech business owners were already struggling to use it. But now they have NO chance.
Gill Andrews (@StoriesWithGill)
1. The UX of Google products in general suck
2. GA4 is a new level of suckiness
3. I get the feeling Google doesn't have a UX team and/or never tests the usability of their products
4. If you are not a monopoly you would never be able to get away with this
Tom Kasperski (@TomKaz)
Factors is simple by design. Users go from onboarding to creating powerful (and basic) marketing reports in a matter of minutes.

Now Is The Best Time to Switch Over From Google Analytics To Factors.ai
And there you have it. A non-exhaustive set of reasons as to why Factors.ai makes far more sense for B2B marketers over Google Analytics. With the imminent arrival of GA4 (and the consequent break in years of historical data), now is the best time to make the move to Factors.

Data Correlation in B2B Marketing Analytics
Correlation vs. Causation
Correlation occurs when no cause and effect can be established between two variables that have a relationship. For example, the level of education of parents is positively correlated with the salary levels of their children. In other words, higher levels of education of parents has been observed in higher salary levels of their children. However, this does not mean that a direct causation can be established. If that were the case, to increase your salary level, you would simply have to get your parents in schools and universities. Another such example of correlations exists between heights and weights. Your height is not causing your weight but taller people tend to be heavier than shorter people.
Causation means that there exists a cause and effect relationship between two variables. In the education example, a direct relationship may exist between education level of a child and the average salary he earns. Someone who just completed an undergrad and someone who just finished an MBA might get different salaries even at the same experience level regardless of their parent’s education levels.
Correlation ≠ Causation
It is important to be able to distinguish between causations and correlations. The best way to differentiate the two is to consider all other factors that are involved in the outcome. For example, there exists a strong correlation between the data for ice cream consumption and murders. This correlation is a complete coincidence. But if you were to apply causation, it becomes worse because then it implies that ice cream consumption leads to murder.
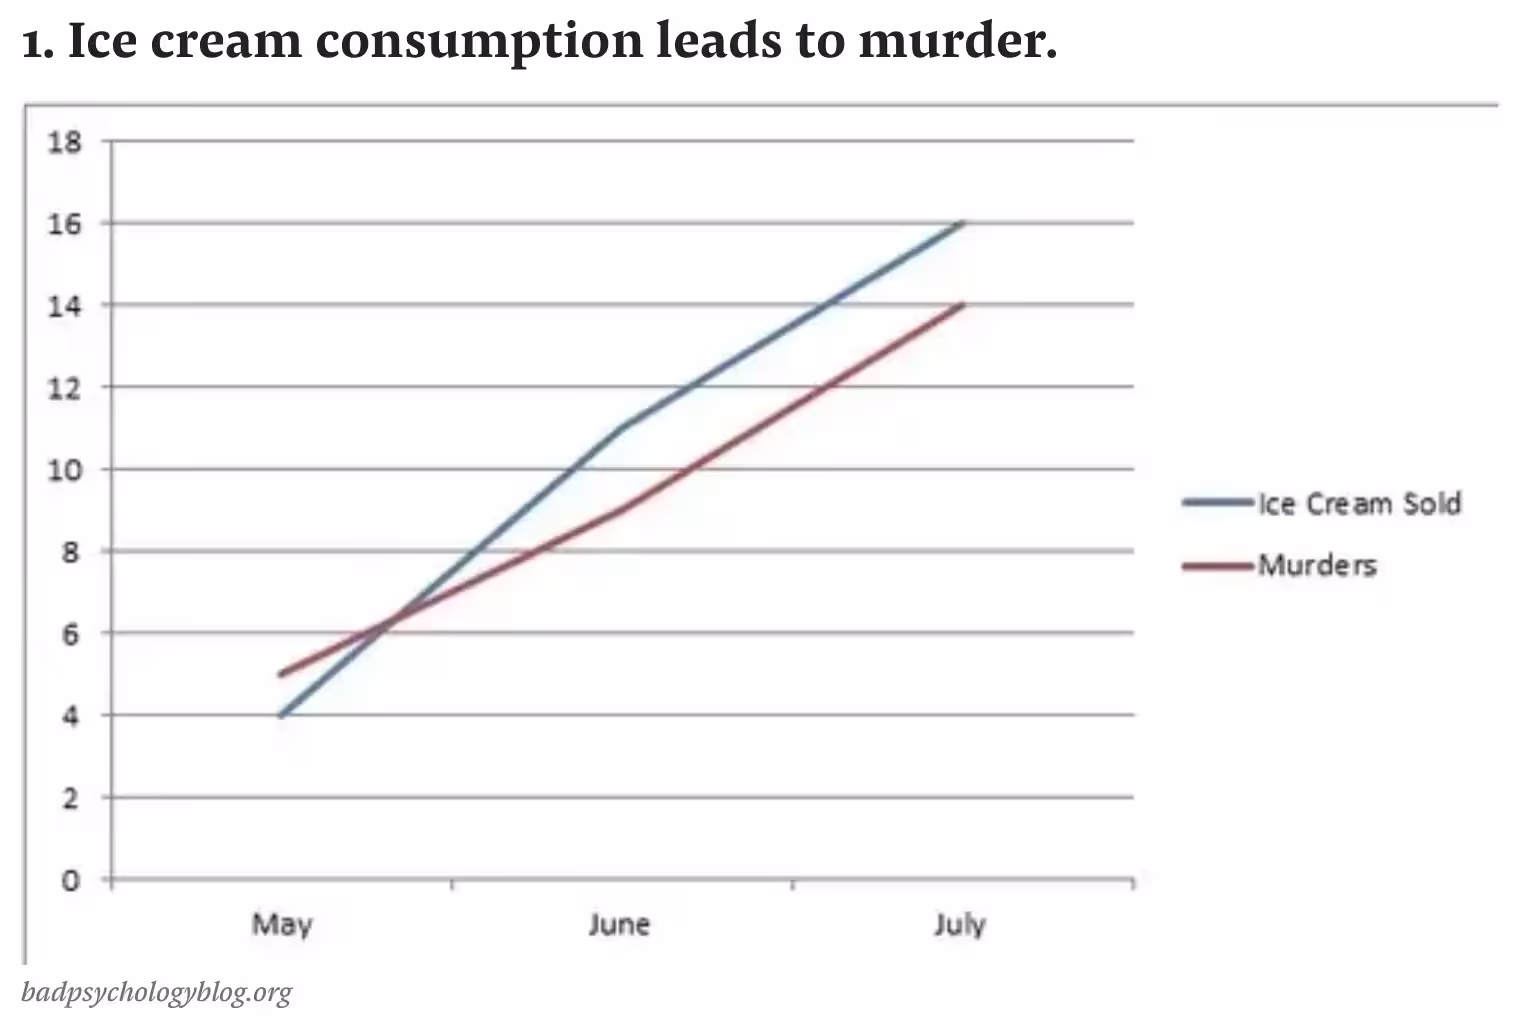
Applying causation in less subtly absurd correlations can be even more harmful, especially if budgeting decisions are based on cause and effect relationships between touch-points. Ideally, most data analysts avoid establishing causations. First, because its hard and correlations are easier to establish. Second, direct causations are very rare.
Correlations in B2B Marketing Analytics
Establishing correlations and causations is fundamental to any and all data analysis. Marketing analytics is no exception to this. Correlation insights help marketers make sense of their data points. In turn, this contributes to optimizing marketing efforts and determining the impact of marketing on KPIs and revenue.
In other words, correlation analytics identifies valuable patterns within the story, your marketing data is trying to tell you. Here’s how:
1. Understand the impact of your SEO/PPC
2. Test campaign decisions during implementation
3. Determine the revenue impact of customer touchpoints
There can be several pitfalls to correlations data, particularly in cases where coincidences can be mistaken for statistically significant relationships. Some can be very obvious, others are not so much. For example, there exists a strong correlation between the number of pool drownings and films that Nicholas cage has appeared in through the years. Another perfect correlation is between total revenue generated by arcades and CS doctorates awarded in the US. But as is plain, these events have nothing to do with each other.
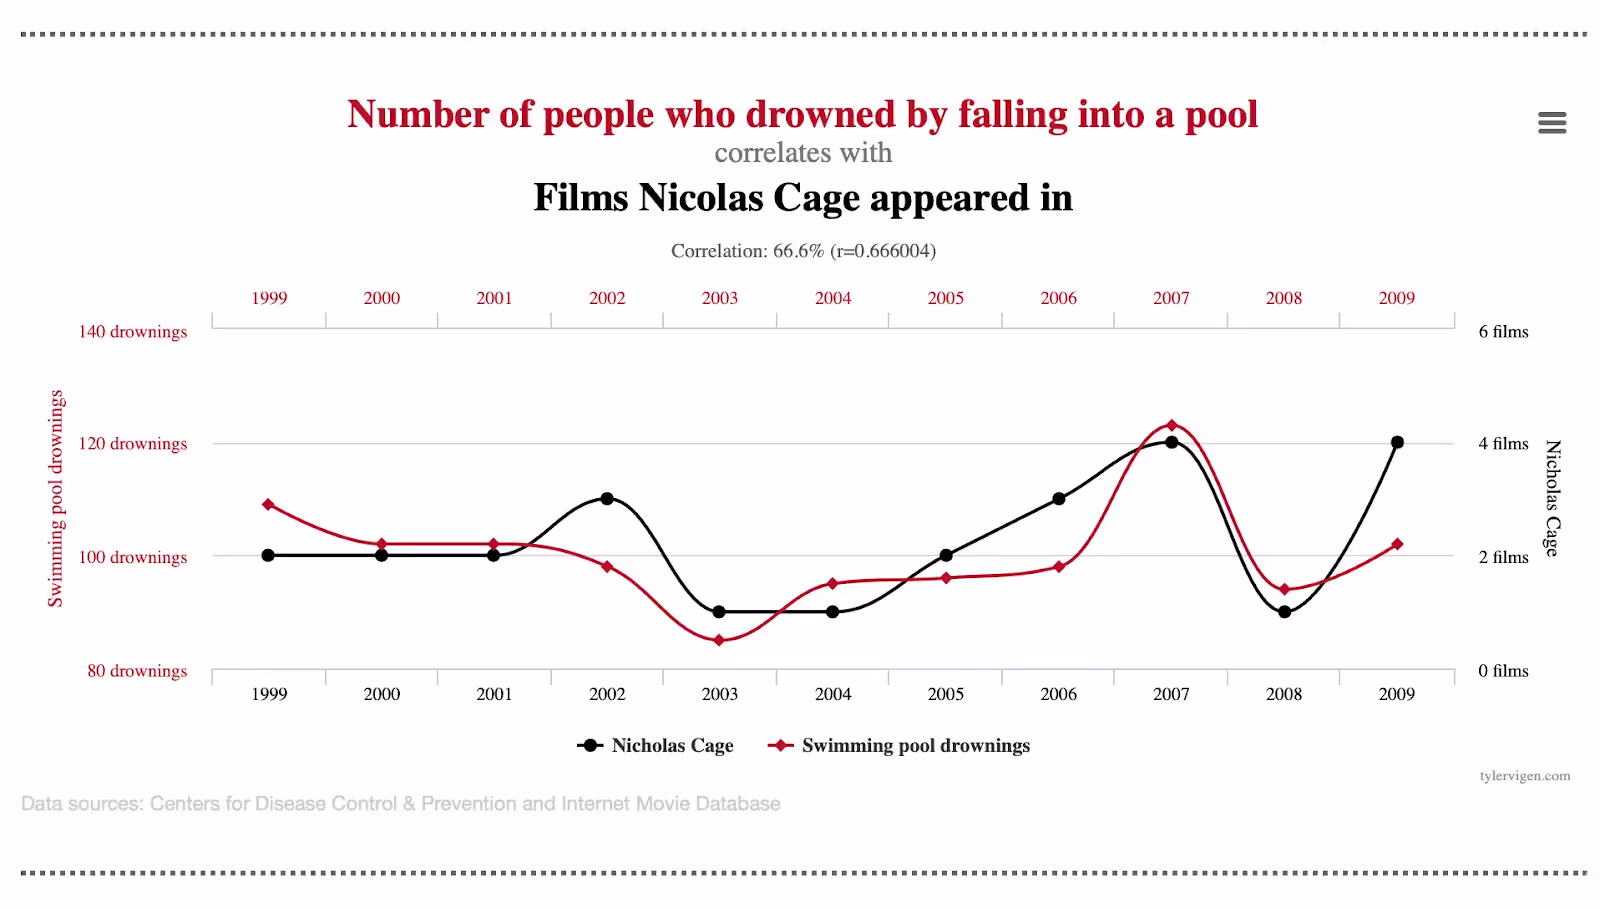
Let’s take a marketing example. Say a company decides to mail catalogs of their retail products to their target audience in Karnataka. Soon after, they Ef a stark rise in orders placed from Odisha. Intuitively, the right move would be to send more catalogs to Odisha to support the growing demand for your product. However, as a result of the strong relationship between the two touch-points, correlation analytics would suggest shipping catalogs to Karnataka instead.
Best Practices for Correlation and Causation in Marketing Analytics.
Avoid confirmation bias
Confirmation bias in correlations data occurs when your data inaccurately confirms a bias. Say, a preferred channel is performing better than another and a correlation that confirms your belief, you are likely to assign causation that isn’t there.
Anish is the marketing head of Company X. He recently had a celebrity promote X’s product. He worked hard on getting them on board and was sure that it will drive sales. Soon after, he noticed a spike in the number of website redirects from Facebook and immediately assigned the causation for this increased traffic to the celebrity’s campaign. Expecting similar results, he invests further resources and runs another ad with the celebrity. However, there is no change in performance. There is something amiss in the marketing head’s correlation analytics. Instead of checking for causation, he let your subjective assumptions take over. This is confirmation bias in play.
To assign definitive causation, it is necessary to check for coincidences. In this example, tracking performance data for the campaign across channels is a good way to assign cause to the campaign. Simply put, if the celebrity is affecting more people to click on this ad, then there should be a percentage increase in clicks in all channels that carried the ad with the celebrity. So Anish should’ve tried to corroborate the results, keeping all other things (like the intent of the target audience) constant across all platforms (Google, Facebook, Instagram, etc). On running such an analysis, he notices that only Facebook had a spike in traffic after the first ad, which wasn’t replicated across other platforms or even on Facebook itself when the second ad was shared. On further research, he learns that the platform had made changes to its algorithm around the same time, which seems to have impacted all ads on Facebook, including X’s.
Using quantitative data from all channels can help avoid making decisions or causations around subjective assumptions.
You can use a marketing analytics tool like Factors can help you check how a touchpoint is helping or hurting pre-determined conversion goals. The funnel feature allows you to customise your queries to check for specific correlations. Funnels can be created for website redirects, and in this example, the celebrity ad could be compared across channels in a few clicks and Anish could check whether to attribute the change to the celebrity ad or if there’s something else at play.
A/B testing
One of the best ways to establish effective correlation is A/B testing. Let’s say you’re revamping your website homepage and want to test the impact on traffic and conversions. A/B testing involves testing a variable (for example, the position of a “schedule demo” button). This change is tested across two-time frames — pre-change and post-change.
Let’s change the previous example and assume that the spike in Facebook redirects did not happen immediately after running the ads but happened a few weeks later. In the absence of a proper pre and post analysis, it is human nature for Anish to attribute it to the ad campaign. But if he did a pre-and post-analysis of the impact of ad campaign on redirects, he might find that the cause for the change is something else.
You can use tools like Factors.AI to record changes like new ads when they occur and use data from the various channels like Facebook as well as your website or conversions to A/B test campaigns. The funnel feature allows you to use campaign naming conventions to get data pre-change and post-change.
Analyse the impact of correlations across channels.
Looking out for correlations and establishing possible causations can help understand how a specific touchpoint is affecting pre-determined conversion goals. If you want to check impact on goals like say, web event sign-ups, white paper downloads or even deals won, you can use correlation and causation analytics to figure out what touchpoints are saying, helping you schedule demos, what touchpoints on your website is driving down form fills, etc.
Factors allow you to compare metrics on a week on week basis to catch changes in any of the metrics. The explain feature allows you to check for what URLs or web pages your users have visited before submitting a form. Apart from identifying URLs that have influenced the users to convert, you can also see which webpages aren’t performing well. Weekly sessions data can help see short term changes, apart from A/B testing. Correlations can also be checked at a segment level, like demographics, industries, business model types, etc.
Choose the right graphs for correlation analysis/reporting
Data collection is only the first step to understanding correlations. The second step is to read the data and share the insights. After getting the insights, you act upon the data as well as build data-driven strategies. To understand how a touchpoint is interacting with each other and the impact of a change on your conversion metrics and revenue, you can use graphs.
There are several kinds of graphs that can be used for correlation analysis.
Time-series graphs:
These reports compare metrics over time periods. They are most appropriate for trends or changes in metrics post a change in a touchpoint or campaign strategy etc.
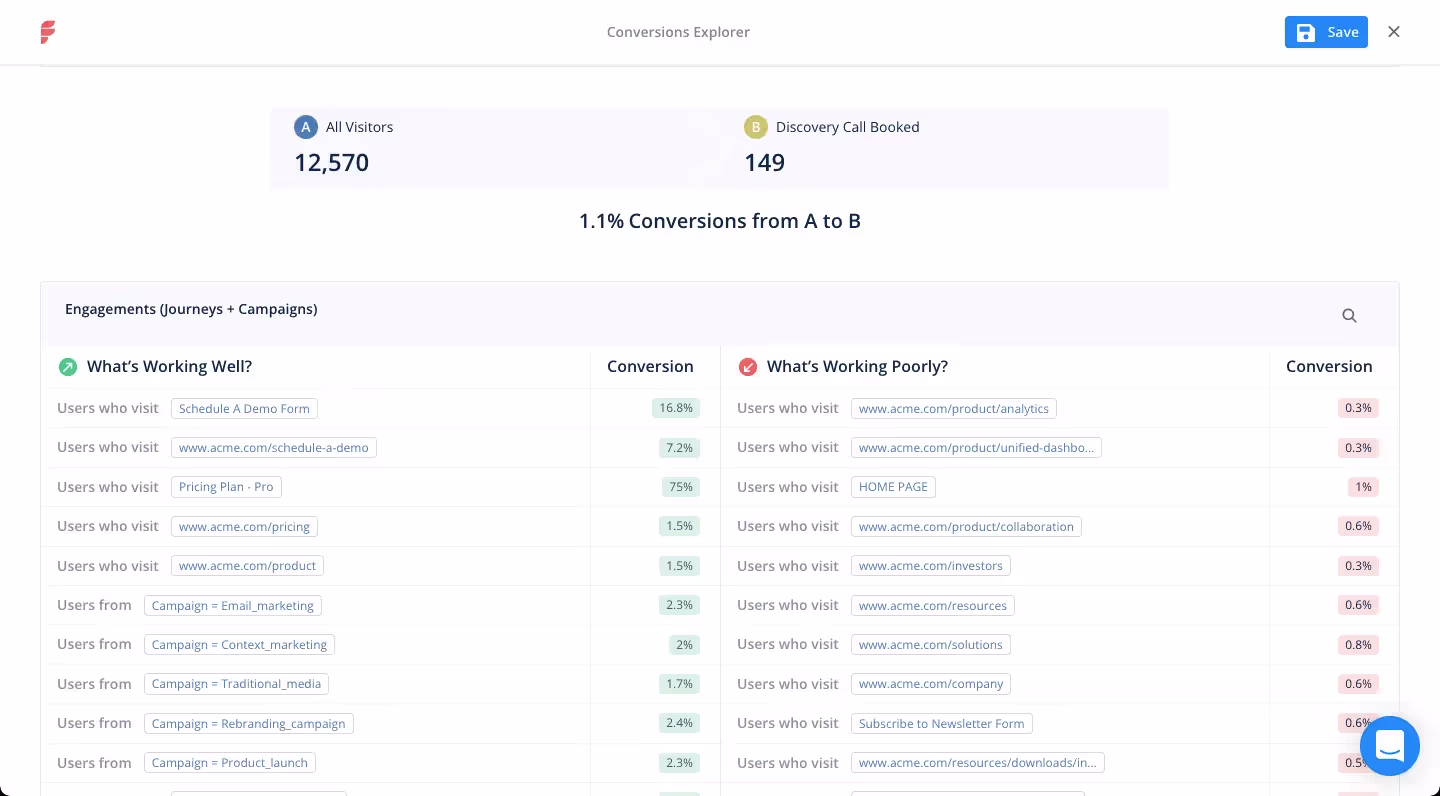
Distribution Graphs:
These graphs can easily show when there is a correlation. They show changes in distribution against a mean.
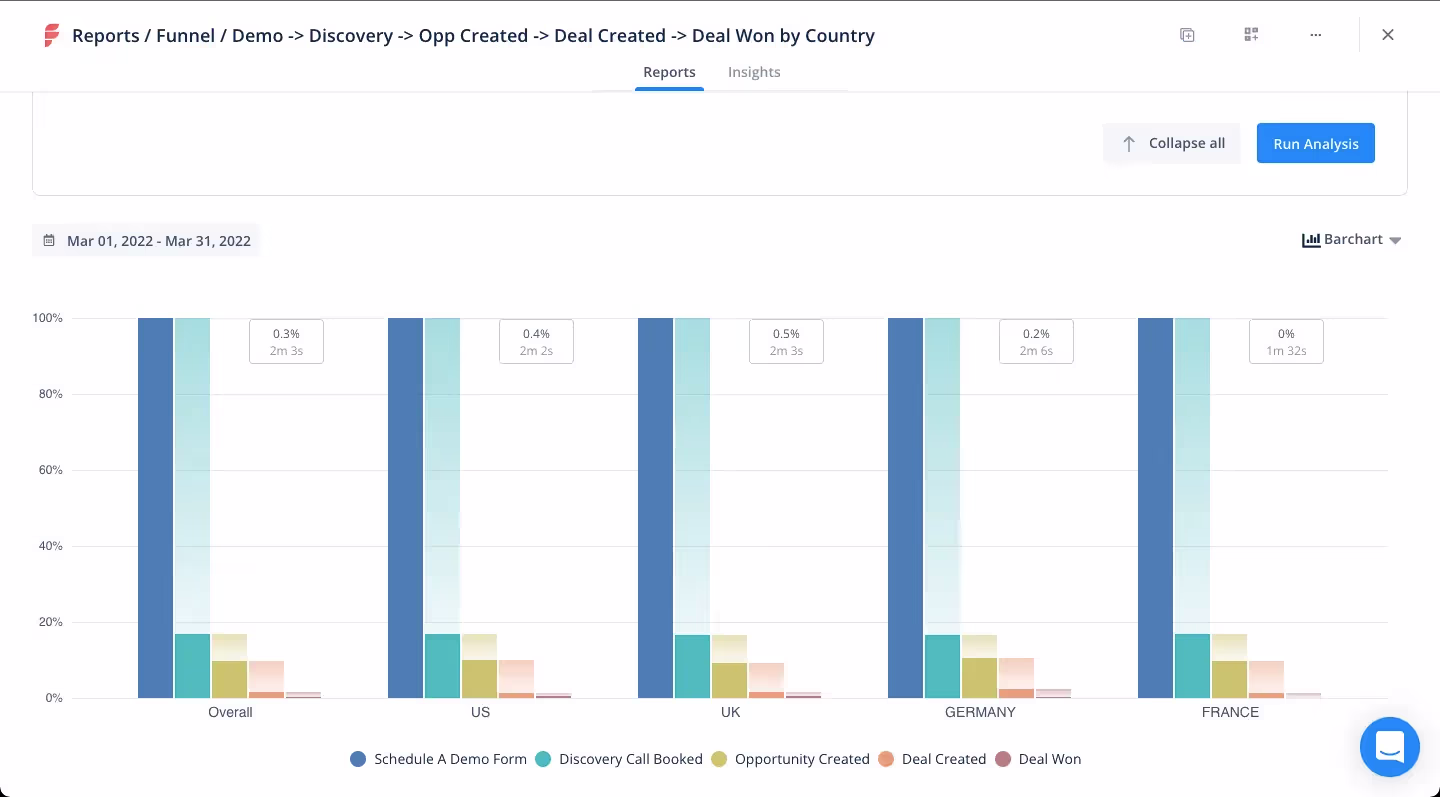
Funnel comparison graphs:
These graphs can be used to see a side by side comparison of funnel queries. Say you want to see how ad 1 and ad 2 have impacted the conversions, you can see a side by side strategy comparison of the two. You can also compare the same funnel before and after a specific time period.
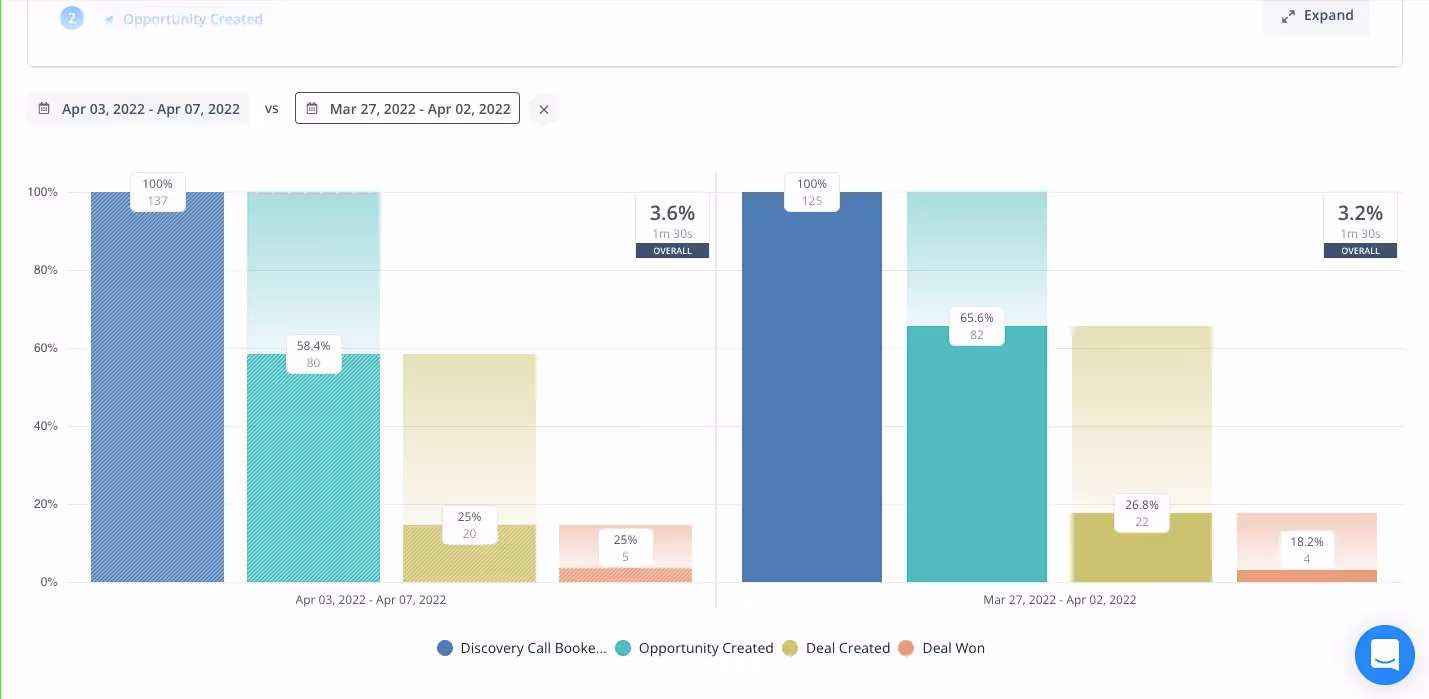
There are also other graphs like relationship graphs that help see the relationship (positive, negative or nil) between two or more metrics.
In closing...
In the age of data-driven marketing, it is important to know how to treat your data. Every customer journey and every touchpoint weaves a larger story where the channels are connected and touchpoints impact each other to influence each potential customer to convert. Correlations can help bring forth these insights that are invisible to the naked eye and can help you craft a winning marketing strategy for your organisation.
.webp)
Build Vs. Buy for B2B Marketing Analytics (Part 2)
The following is the second half of a two-part series about the factors involved in building and buying a B2B marketing analytics and attribution solution. This post deals with the cost and time requirements for an in-house and an off-the-shelf solution. It also compares the opportunity costs of building and buying a solution.
Be sure to check out part one which talks about the need for a B2B marketing analytics and revenue attribution solution. Along with a breakdown of the technical requirements for each solution.
Costs Involved
This segment is an overview of the costs involved in building an in-house B2B marketing analytics and revenue attribution solution. While there are certainly other costs involves, we cover 5 of the most prominent ones:
· Cost of ETL
· Cost of Data Warehousing
· Cost of Data Processing
· Cost of Data Visualization
· Cost of Staff
Cost of ETL
Extract, Transform and Load (ETL). Extracting structured or unstructured data from a source — this could be data from your CRM or Google Ads. Transforming includes processes like cleaning, duplication, sorting, etc. and ensuring data integrity and compatibility. Loading involves placing all of the transformed data into a data repository or a data warehouse. The data could be either loaded completely or at predetermined intervals.
This is the cost of maintaining a data pipeline. While it is possible for your engineering team to set up a data pipeline, some companies find it cost effective to use an ETL tool. These tools include tools such as Hevo, Fivetran, Google Dataflow, Pentaho, etc.
Fivetran, foe example, lists a range of pricing tiers. The starter tier’s price (which is for a small team’s data stack or the bare minimum for an in-house solution), would depend on the number of rows you update. This will range anywhere from 2 million total rows at a monthly estimated fee of $120, to 500 million total rows at an estimated $4,628 per month.
Cost of Data Warehousing
In the previous blog we talked about the need for a data warehouse from an analytics perspective. We discussed why relying on application databases is not scalable. While you could invest in a local data warehouse, there are a multitude of benefits to investing in a cloud data warehouse. Ultimately, this will prove to be convenient when building an in-house solution. Scaling operations would be expensive as it requires more ram (and in all likelihood, a dedicated database manager). That being said, cloud-based data warehouses like Google Cloud Storage, AWS Redshift, Microsoft Azure, and Snowflake fit the bill.
Cloud data warehouse storage prices vary depending on a range of factors. Google Cloud Storage, for example, has options varying in region and class — the class of storage, standard, nearline, coldline, and archive is determined by the frequency of access to the storage. In the region of US-central Iowa, at the standard class, warehousing will run you about $0.020 per GB per month.
Cost of Data Processing
Most cloud-based data warehouse services also include processing data. This is the cost to process SQL queries, scripts, functions, and more. This is in addition to the cost of loading data that you are processing in storage. Processing data is usually handled by a database management system like Bigquery, AWS Redshift, Oracle, Singlestore, etc. These services offer Cloud database as a service.
The cost involved in the pricing of these services includes the use of vCPU, Memory and cloud storage. Singlestore, for example, on its standard plan has a starting price of $0.65 per hour and will increase depending on the number of vCPUs and memory used. A vCPU of 16 and 128GB of memory will cost you $3,796 per month.
Cost of Data Visualization
In the previous blog, we talked about the presentation of your reports to your end-user. This requires a data visualization tool. A skilled engineer could purchase data visualization libraries and build them out. But for the sake of time, a lot of businesses resort to data visualization tools like Tableau, Looker, and PowerBI.
A data visualization tool like Tableau will cost you $70 per month per license.
Cost of Staff
Staff will, by far, be your most expensive costs. To build a marketing analytics and attribution in-house solution, you would at the very least require a small team of 3 full time data engineers and 1 data scientist. You will require experts with experience across programming language and ETL. In the US, the break down is as follows: on average a data engineer’s CTC is $116,772 per annum, along with a $5,000 cash bonus and other non-cash benefits as of 2022. The average CTC of a data scientist in the US will cost $102,865 as of 2022. (Indeed.com). These costs will have to be multiplied by the number of data engineers and scientists hired.
In terms of cost an off-the-shelf solution like Factor.ai will as of this date cost you $1,188 per annum on the starter plan which includes web analytics, multi-touch attribution, funnel mapping, Metric reports and more. Their growth plan on the other hand will cost you $5,988 an AI powered “Explain feature”, automated weekly insights and a dedicated customer success manager
Time
To build a fully operational in-house B2B marketing analytics and revenue attribution solution, with a team of 3 full time data engineers and 1 data scientist will take anywhere between 9 to 12 months.
An off-the-shelf solution like Factors.ai can be set-up in minutes. It requires no professional services for onboarding either.
So...Build or Buy?
Now, we're all caught up about the resources required to build an in-house B2B marketing analytics and attribution solution, as well as what to expect from an off-the-shelf solution. So should you build or buy? This section runs through the opportunity cost of building and buying. Essentially, what are you missing out by choosing whether to build or buy.
Opportunity Cost of Building:
By choosing to build an in-house solution you forgo the benefit of:
· The cost savings earned from buying a solution
· The time saved from not having to set up an in-house solution
· No-code integrations and developer dependency
· Maintenance and innovations handled by the service
· Using an advanced SDK, and not having to optimize SDK
· Data cleansing handled by the service
· Data visualization within the same product
· Unified Dashboard
Opportunity Cost of Buying:
By purchasing an off-the-shelf solution you incur the following opportunity costs:
· Product may not fulfill very unique analytics aspects of your business
· Product may not deliver on their promises
· Certain products may not fulfill your data privacy requirements (learn more)
· If a vendor liquidates or gets acquired, you cannot ensure data ownership and continuity of business
In Conclusion…
The most important point to take away from this is that when you build an in-house solution, you would have to weigh the risk of doing so. The average tenure of a CMO is about 40 months. Would they prefer to spend the first 9 to 12 months of their tenure waiting on a solution that isn’t proven to meet their need, or have a solution that is up and running within a week for a fraction of the cost of building one?
In my opinion there is too little to gain and a lot to lose when buying. Most of the opportunity costs of buying could be avoided with modern solutions like Factors.ai. Where custom plans can be built to fulfill your business’s unique needs. A demo of the product can be requested to ensure if the product delivers on its promise. Factors.ai uses first party cookies and is GDPR, CCPA, PECR and SOC2 compliant. And Factors.ai can send their client’s data to their Bigquery instance on demand giving full data ownership to the client.
Still on the fence? Book a demo with Factors.ai now.

See Factors in action
Schedule a personalized demo or get started for free
