
B2B Marketing Budget 2022
Most B2B marketers will accept that the success of any marketing plan depends crucially on marketing budget allocation. It is the key to effective strategy implementation. The best-laid plans fall short if you do not have the right resources in the right places. Strategic budget allocation is necessary to make the move from meetings to real execution, iteration, and conversions. The following post discusses best practices when constructing a B2B marketing budget.
Why is marketing budget allocation core to marketing’s success?
Considering that all budgets come with the caveat of spending limits, getting your budget allocation right is key to having adequate reserves to efficiently implement plans. Marketers will often spend a lot of time validating their budgetary requirements because no organisation wants to misspend its revenue or capital. Resultantly, marketing budgets usually require inputs from multiple stakeholders across the organisation.
What should your marketing budget include?
Marketing budgets include everything that you and your team need to positively reach your target audience. This includes expenses related to campaigns, channels, platforms, wages, marketing technologies (CDPs, social media, data analytics, design, automation), advertising, PR, freelancers and consultants, conferences, trade shows, etc. Each of these elements needs to be accounted for in your budget with wriggle room for other revenue generation tactics.
How much should you spend on marketing?
Although the revenue spent on marketing differs a lot from industry to industry (and company to company), on average about 7-15% of a company’s revenue goes towards marketing. So all of your company’s unique requirements in terms of your revenue model, stage, funding, amongst other things factor into how much to spend on marketing. The ROI from your marketing activities also plays a role in budget allocation. As per a CMO survey conducted in 2019, on average, B2B firms allocate about 10-11% of the firm’s total budget toward marketing.
Another common question amongst marketers is: how to allocate across channels?
A common rule of thumb is the 70/20/10 rule-
- 70% of the marketing budget for channels goes towards proven strategies
- 20% of the budget for channels goes towards new strategies for growth
- 10% of the budget for channels goes towards experimentation with new or alternative channels as well as emerging channels.
How to create a marketing budget?
1. Establish your overall marketing goals
The first step to creating a budget is to determine your overall marketing goals. This involves setting your larger strategy and breaking it down to substeps. Make the steps you need to reach these goals as detailed as possible and determine the overall length or schedule of the plan. They say that the overall strategy and all its steps need to be specific, measurable, attainable, relevant, and time-bound (SMART). Elaborating on the acronym SMART and determining goals for each term is a preferred place to start.
2. Outline your plan for the year
The second step to creating your budget involves outlining the plan for the year for which you are budgeting. This involves determining the channels and strategies to be used over the year and includes SEO, PPC, web redesigns, social media, new employments — connect them with your overall marketing goals. Essentially, if the previous step is determining the long term goals, this step is all about determining your yearly goals.
3. Determine your budget
In the third step, you determine the spending to be allocated for each element of your strategy (marketing channels, SEO, PPC, etc). The process involves looking at past data of expenses to get a comprehensive roadmap of how much to allocate and then calculating the future expenses in light of your current goals. Calculate the expected costs for each initiative, account for potential expenses that could occur. Finally, divide the total budget into quarterly and monthly budgets.
4. Allocation
Allocation of the marketing budget across various channels, platforms, human resources, tools, and other marketing spending is where best practices come into play. Being efficient when determining how much to spend and what to spend is essential to reaching your marketing goals and getting in that ROI. We’ll be exploring the best strategies and practices for allocation in the next section.
5. Track your progress + Refine your strategy
This step becomes important during the actual implementation of the year’s marketing plans. Tracking your marketing activities in tandem with your budget is crucial in ensuring that you’re hitting your goals. If you find that your predictions don’t align with your actual outcomes, you can fine-tune or rework your plans to course-correct them. A marketing budget tracker essentially helps you see how your marketing plan is progressing. Moreover, comparing your progress against the predetermined goals helps ascertain the efficiency of the plan. To track progress on channels, channel-specific data like number of users, clicks on ads, website traffic, number of forms filled, registrations for webinars, downloads for whitepapers and more, can be used to check if your spends are giving you the desired returns.
6. Measure the ROI
Ultimately, your budget was created to improve revenue. So, apart from tracking your marketing budget and channel-specific metrics, one must also track and measure the ROI — this helps to see how successfully the marketing plan is progressing. If the money spent on items in the marketing plan is bringing in more returns, you can increase the budget allocation for that item next year. Vice-versa for items that are bringing in low returns.
Best practices for marketing budget allocation
Allocate more budget where you have a larger audience
A key step to creating a good budget is knowing your buyer’s journey — that is the steps that your potential customer takes on their journey from being a prospect to a paying customer. Understanding your buyer’s journey will give you key insights into which platforms and channels work best to reach your ICP (ideal customer profile), what forms of marketing ads and social media platforms your target audience prefers, and how they interact with your marketing. A few important questions to ask is how do your customers come across your product or service? What information do they need before they make their purchasing decisions? What is the cost of generating new leads and conversions? What is the revenue from each lead? — answering these questions can help you know where to allocate your budget and to better reach your customers.
The best way to ensure your buyer’s journey and what channels and touchpoints are more efficient is by investing in a good attribution system — may it be an in-house system or an attribution tool that saves both the time and effort that goes into mapping a customer journey so that the marketing team can focus on the strategy and execution of marketing’s goals.
Diversify your strategy with multi-channel campaigns + Experimentation
In the previous point, we mentioned the importance of allocating more funds to channels and platforms where your audience already exists or has a proven success rate. However, the world of digital marketing is ever dynamic with new channels and audience migrations being a regular phenomenon. In that case, diversifying your strategy with omnichannel campaigns becomes extremely important. The previously discussed 70/20/10 rule for channels is a good rule of thumb to ensure that all your eggs are not in one basket and your campaign strategies remain forward-looking.
Look out for hidden marketing costs
If you’re not careful with budget tracking and keeping an eye on where your money is going it is easy to miss out on marketing costs that may not be very evident to the campaign. Spending on product launches, promotional activities, market research, etc are critical in shaping campaigns and it is a good idea to account for additional marketing tactics.
Leverage your data: use data-driven marketing to guide your decisions
We spoke about using previous years’ data while determining your budget. However, apart from past data, the current data from tracking your metrics can be useful in determining what’s working and what isn’t. If something is not working, it is okay to cut losses and redirect those funds to strategies that are performing well. A data-driven marketing approach can help with efficient budget breakdowns as well as with course corrections where necessary. Use all the metrics available to determine the best channels as well as the potential of emerging channels.
Prioritise BO-FU marketing: this can minimise risk and improve your chances of better returns (ROI)
Prioritising BoFu (Bottom of the Funnel) marketing can minimise the risk and improve your chances of better returns or ROI as this involves targeting the bottom of the conversion funnel. The audience here is in that part in their buyer journey where they are closer to becoming paying customers and have higher intents for purchase. Ensuring that you allocate enough resources to BoFu marketing helps increase potential ROI and also minimises the risk associated with spending too much on the top of the funnel which is usually characterised by more misses than hits.
In Closing...
Budget allocation is a process that requires data and insights to figure out what channels should be allotted funds and how much. Relying on historical data and having a data-backed strategy is integral to getting desired returns from the budget allocated for marketing. Good attribution tools can simplify reporting for budgetary asks as well as clarify which channels and touchpoints are performing well and deserve more funds.
We hope this article helps you with your marketing budget allocation and helps you implement some time-worn budgeting best practices that can translate to better returns.
.webp)
Challenges with B2B Attribution (And How to Get Over them)
Outline:
- Introduction
- What is B2B Marketing Attribution and how is it different from B2C Marketing Attribution?
- 7 Challenges with B2B marketing attribution
- Tracking The Website Activity And Identifying Users Using Form Submissions,
- Identifying Accounts On The Website Even For Anonymous Users Using A Reverse IP Solution.
- Stitching Website Data With Map And Crm Data Using Email Ids (Specifically Unifying CRM Data Across Objects - Lead, Contact, Campaign Member, Activities Into A Single Timeline)
- Tracking And Defining Offline Touchpoints At The Same Level As Digital Marketing Touchpoints
- Long Sales Cycles Implying Need To Track This Data Over Many Months And Years
- Sales Marketing Alignment - Bringing In Sales Data
- Ability To Do All Of This At An Account Level
- Takeaway
The B2B customer journey includes multiple people and touchpoints in the decision-making process.
On average, 6 to 10 people are involved in the B2B buying process. And for 33% of B2B organizations, the sales cycle is extended beyond six months.
Overwhelming, isn't it?
In a B2B business, there are multiple stakeholders at different stages in the buying journey. And it is essential to have content that appeals to them. Hence it becomes hard to build content pieces that provide educational value.
However, it is not an excuse that hinders your growth. In this blog, we will discuss the seven main challenges with B2B attribution and how factors can help overcome them.
How Is B2B Marketing Attribution Different From B2C Marketing Attribution?
71% of Marketers believe optimizing the customer journey across multiple channels and interactions is crucial. This optimization can improve customer satisfaction and drive business growth.
However, 50% of B2B marketers report limitations with their current analytics solutions. These reports are not providing them with adequate visibility into what channels or campaigns work best.
The following are two reasons why traditional marketing analytics solutions fail to achieve this.
- Multiple stakeholders are involved in decision-making, and the buying journey is non-linear. It makes it difficult to predict the impact of marketing-driven interactions.
- Sales cycles are longer and involve multiple online & offline touchpoints for educating and influencing the buyer's decision.
Let's understand this with an example.
A customer journey for a B2C brand that is selling chocolates will look like this:
Clicks on an Instagram ad → go to the website→ to make a purchase. (Yes, that's it!)
On the other hand, a B2B customer's journey will look something like this.
Visit website→Read product reviews→Attend a webinar→Engage with a sales representative→Make a purchase decision. [For example's purpose only]
Now, from the customer journey, it is clear that it has both online and offline touchpoints. A more detailed depiction of a customer journey in the B2b business is added below for your reference.
Furthermore, users now tend to browse anonymously, making it harder to piece together the accurate buying journey. Website Visitor identification capabilities can help throw light on these otherwise untrackable touchpoints.
Challenges With B2B Attribution
Here are the seven challenges faced by the marketing teams with B2B attribution and how to overcome them.
1. Tracking Website Activity And Identifying Users
- How many people visit my website, and who are they?
- Which page are they landing on?
- Which content is driving maximum engagement?
- Which traffic sources - campaigns, referrals are driving high-quality traffic to the website?
These are some of the questions that cross the mind of a B2B marketer. Websites are the sales epicenters for B2B marketers. Why? Because all the lead generation and conversions happen via the website.
At every stage of the buying journey, your prospects are consuming your content and comparing it with your competitors. They want to understand whether you can solve their problems faster and better.
So, it is vital for you to track and identify the website visitors to prepare customer-centric marketing strategies. However, tracking a user's journey from the first interaction to conversion across months is a technically complex task. It includes
- Managing cookies,
- Tracking traffic sources via utm parameters, referral parameters, or click ids,
- And stitching that with the respective ad platforms.
How Can Factors.ai Help?
Factors.ai is an analytics solution purpose-built for B2B marketers. It has an inbuilt capability to track a user's journey from the first interaction to conversion and beyond.
The solution is configurable, wherein marketers can set up their utm definitions and channel configurations. It also comes with the following
- Ability to track utm parameters and click ids.
- Native integrations with the main ad platforms, providing a cost-to-revenue view seamlessly.
2. Website Visitor Identification
The key to driving effective marketing is targeting the right audience with the right message at the right time.
And data is what you need to convert the hot lead! The more you know about your prospect, the more you can personalize their experience.
However, collecting user data is challenging for the B2B segment. According to a report by 6sense, only 3% of B2B website visitors will fill out any form. And the rest, 97% of them, will be labeled as anonymous traffic.
But it would be misleading to say that 97% of anonymous users did not influence the decision-making process of the known 3% of users.
Let's unpack this with an example now.
For instance, six people from the same company visited your website, but only 1 filled out the demo form. Therefore, attributing all the marketing efforts to that single identified person and his touchpoints will be wrong.
All the users from that account and the campaigns/content they interacted with should be considered when building an attribution model.
How Can Factors.ai Help?
Collecting user data is crucial. But you can do that only with their consent, which means your anonymous visitors stay hidden. Therefore, you need a solution that tracks the data on the website, even for anonymous users.
Factors.ai has an OEM partnership with 6sense to provide the best-in-class visitor identification to its customers. Thus, stitching together the entire account journey across all users.
They use a reverse IP solution and get data on an account level rather than at an individual level. It further enables you to understand the companies the users are from and know more about your anonymous users.
3. Putting The User Data In One Place
B2B Marketers today leverage multiple channels to promote content downloads, webinar registrations, and demo requests. It helps them engage buyers as per their preferences.
However, with many campaigns, ads, and other marketing activities happening simultaneously, it becomes challenging for marketers to measure the influence of each of these efforts on pipeline and revenue. In many cases, the customer journey is siloed across multiple tools. For example, the Marketing Automation Platform captures the website activity, while CRM captures the post-sales hand-off events.
Most Marketing Automation Platforms also are not sophisticated to capture traffic sources accurately. Furthermore, CRMs keep the user data fragmented across multiple objects such as Leads, Contacts, Campaign Members, and Activities.
Hence, it isn't feasible to stitch together the user journey across all these tools at an account level. Therefore, to make result-oriented marketing strategies, you need to unify this data - both at a user level and then at an account level.
How Can Factors.ai Help?
Factors.ai has out-of-the-box integrations with Marketing Automation and CRM platforms. And it can stitch all data with the website activity based on the user's email ID.
Also, Factors pulls in all the engagement data across both Hubspot and Salesforce across individual objects.
For example, in Hubspot, Factors can pull in the Contact, Engagement, Form Submission, and Add to List activities. Within Salesforce, Factors unifies data across Lead, Contact, Campaign Member, and Activity objects.
It makes it easy for the decision-makers to get a 360-degree unified view of customer activities and behavior in one platform.
4. Tracking And Defining Offline Touchpoints At The Same Level As Digital Marketing Touchpoints
Both online and offline touchpoints are equally involved in the lead acquisition process. Hence, B2B marketers need to track them in a single timeline.
Online touchpoints are easier to track through the well-established digital marketing ecosystem. However, offline touchpoints like events, workshops, meetings, and direct mail are difficult to keep track of.
Therefore you need a solution that allows you to keep track of both touchpoints simultaneously and build an exhaustive account timeline.
How Can Factors.ai Help?
Factors automatically track offline touchpoints, which are recorded in the MAP or the CRM.
Further, Factors allows you to configure and define your offline touchpoints with a simple UI. It enables Marketers to map all their touchpoints at a user and account level for making data-driven decisions.
5. Long Sales Cycles Implying the Need To Track This Data Over Many Months And Years
Longer sales cycles are one of the unfortunate realities of the B2B buying journey. Due to the multiple stakeholders involved and shifting priorities, most buyers take much longer to make a purchase decision. On average, a customer conducts nearly twelve searches before interacting with a brand.
With this and the complexity involved in the decision-making process, it becomes challenging to accelerate the sales cycle. As a result, the customers could take weeks, months, or even years to close the deal size.
Therefore B2B organizations would need a solution that can manage voluminous data running into many years of interactions with their prospects.
How Can Factors.ai Help?
Factors.ai allows you to keep a record of all the interactions across all the platforms, like websites and campaigns, within one platform. In addition, you can seamlessly store data for an extended period (no limits) and reflect back on it at any point to decide what really helped.
6. Sales Marketing Alignment - Bringing In Sales Data
An alignment between marketing and sales can maximize the ROI of a business. But this alignment between the teams is often absent in B2B businesses. Each team believes their efforts were the reason for closing a deal, which could be one reason for this.
Emphasizing that each team is part of a larger go-to-market function is one way to make them work together.
Once you form a synchronization between them, it will allow the marketing heads to get a unified overview of the data across both marketing and sales touchpoints.
Furthermore, each team can review and analyze the attribution data to see which of their strategies are working and which are not.
How Can Factors.ai Help?
Factors.ai pulls in all your sales interactions from the CRM and treats them at par with marketing touchpoints. And it also provides a clear and consistent view of the customer journey. On top of the unified data foundation, both teams can get answers to questions such as;
- How many touchpoints did it take to convert a deal?
- How many of these were sales vs. marketing touchpoints?
- Were marketing efforts able to drive engagement with the right stakeholders in these accounts?
- When is the right time for sales teams to intervene to convert an account?
7. Ability To Do All Of This At An Account (company) Level
The most significant pain point of B2B marketers is the involvement of multiple stakeholders in decision-making.
The person who made the purchase is not usually the one who initiated the process of buying the product. Instead, multiple people across different departments (technical support, finance, marketing) must have come across the different stages of the buying journey.
The traditional methodology would want you to attribute all the credits to the person who bought the product. It makes sense because he is bringing in the revenue.
However, tracking customer journeys at an account (company) level rather than at an individual-level is what your attribution strategy requires.
How Can Factors.ai Help?
Factors.ai will give insights at a granular level by breaking down the customer journey at the account level. It will simplify and visualize the customer journey by giving you an optimized overview of every touchpoint that drives the velocity of conversions & pipeline.
Do B2B Marketing Attribution The Right Way!
To keep up with the competitive marketplace, you need a differentiated analytics tool that helps you connect the dots from initial interaction to conversion.
While B2B Attribution is technically and organizationally a complex problem, overcoming these challenges is critical to ensure your efforts are well directed. Hence tools like Factors.ai can tremendously simplify the B2B attribution process and elevate your ROI. To get your B2B marketing attribution game on point and cost-effective, sign up now for a free demo today.

A/B Testing: A Beginner’s Guide
Here's a handy beginner's guide on the basics of A/B testing that covers what A/B testing is, why it's important, how to perform a robust test, and more! This should be a great introduction for those looking to dive into the world of optimisation.
What Is A/B Testing?
A/B testing is a strategy that, simply put, allows you to compare two versions of something and find out which version performs better.
Marketers use this technique to compare two or more versions of their websites, adverts, emails, pop-ups, or landing pages against each other to see which version is most effective. In A/B testing, A refers to ‘control’ or the original version and B refers to ‘variation’ or the new version. A/B tests can provide both qualitative and quantitative insights for the marketer. It usually falls under the larger umbrella of Conversion Rate Optimization or CRO.
To illustrate an example, you might test two different Google Ads to see which one drives more purchases or you might want to test two versions of a CTA button on a webpage to see which version leads to more webinar sign-ups. The version that drives more visitors to take the desired action (click on the ad, sign up for the webinar, etc) is the winner.
Why Does it Matter?
A/B testing is a great way to field-test ideas before finalising implementation. A/B testing helps you track impact of the changes on key metrics like conversion rates, drop off rates, etc. Thereby providing key insights on how effective the changes are going to be. Secondly, leaders don’t want to make decisions unless there is strong evidence for them, particularly when they have to incur costs. A/B testing helps databack ideas and decide where and how to invest the marketing budget. It is a great tool for creating effective marketing strategies.
Where do marketers use A/B testing?
Almost any style or content element that is a customer-facing item can be evaluated using A/B testing.
Some common examples include:
- Website design and layout
- Email campaigns and personalised emails
- Social media marketing strategies
- Paid Adverts
- Newsletters
In each category, A/B tests can be conducted on multiple elements. For example, if you want to test your website design, you can test the colour scheme, layout, headings and subheadings, pricing page, special offers, CTA button designs, etc, amongst many other elements.
While the metrics for conversion are unique to each website, A/B tests can be used to collect data and understand user behaviour, user actions, the pain points, reception to new features, satisfaction with existing features, etc. The metrics however depend on the industry and type. For example, the metrics for B2B (new leads or deals won) will be different from their B2C and D2C counterparts (cart abandonment rate, total purchases, etc).
The Primary Types of A/B tests:
1. Split URL testing:
The simplest in concept — in split URL testing, two versions of a webpage url are compared with each other using webpage traffic to see which performs better on key metrics. It is the primary testing method for most organisations vying for website optimisation. However, this is not the best method to compare between two changes. It is mostly used to compare the original version with the new version that has some changes. More importantly, you can’t learn more about how different changes or elements interact with each or what combinations perform best.
2. Multivariate testing (MVT):
Multivariate testing allows the experimenter to compare multiple variables in the same test. This helps further what split URLs can do by overcoming their main limitation. Here, you can compare various combinations of the elements whose impact you’re trying to test. Good multivariate tests can combine all possible permutations to find which combination produces the best results. However, a large traffic is needed to be able to divide the traffic to face all the permutations of the webpage that is created by the traffic.
3. Multi-page testing:
Multi-page, as the name suggests, implements the changes being studied over multiple pages instead of a single page as is seen with simple split A/B tests. This helps understand how the changes impact the visitors in terms of how they interact with the different pages that they encounter on the website. This also helps maintain consistency when a visitor is met with a new variation that is being tested.
How to perform an A/B test
The A/B testing process can be summarised as follows...
1. Data Collection:
In the first stage, the marketers or experimenters collect data from their analytics softwares to look out for numbers like high and low traffic areas, pages with high and low conversion rates, and or drop-off rates. This helps understand how the webpage is currently performing.
2. Decide what features you want to test:
Here marketers decide what features on the website or webpage they want to track and identify the goals. In other words, the determining the key conversion metrics that they want to improve for those features.
3. Formulate hypothesis:
Here, one starts generating A/B testing ideas and formulating a hypothesis for why the changes will perform better in terms of impact on the metrics being tracked.
4. Create variations:
After the hypothesis has been created, giving direction and clarity to the marketer’s goals, create variations that will be tested against the current version. This is where the marketer will choose the method of testing as well as the A/B tool used for testing.
5. Run test:
After everything is in place, the only thing left to do is to run the test. Most A/B testers suggest around two weeks of testing on average. However, it varies based on the campaign, industry and traffic.
6. Analyse results:
Once the test is complete, the experimenter can interpret the results given by the A/B test. It is important to ensure that the result is statistically significant. In other words, if one version saw better results than the other version, the changes can be confidently attributed to the new changes (and not coincidences).
7. Make changes:
Finally, now that the marketer has data backing their new ideas or proposed changes, they can go ahead and implement them to reap the reward of a more effective variation on metrics such as conversion rates, drop off rates, click-through rates and so on.
How do A/B testing tools work?
In short, every A/B testing tool has a piece of code that decides which variation of the webpage, email or ad each visitor sees. It also collects the data for the visitors of each variation which helps you compare and analyse visitor behaviour.
This code works by incorporating the URL of the page(s) that are being tested. It also incorporates the metrics that you want to test. The results from this will determine which variation performs better. The tool’s cookies track visitors and opt them into the experiment. It will divert the traffic where half the visitors see version A (the control) and half see version B (the variant). The cookies track which version a particular visitor is opted into and measures their actions on the webpage towards the specified goal.
There are several tools on the market today for A/B testing including Hubspot’s A/B testing tool, Google Optimize, VWO, and Optimizely.

KPIs Explained: Conversion Rates
Finding the Relevant KPIs for your Business
Identifying KPIs that are relevant to your marketing team depends on your particular type of business. For D2C businesses that sell directly to customers, website traffic and cart abandonment rate are two essential KPIs. The former helps guage how successfully a given marketing campaign is able to encourage customers to click on desired CTAs and advertisements, while the latter helps figure out possible pain points for customers that may be hindering their completion of purchases. If your cart abandonment rate is high, retargeting ads on customers’ social media feeds with their in-cart products can serve as useful reminders to complete a purchase. Alternatively, it can help identify customers’ pain points like contentions with shipping or exchange policies, pricing, etc. Such insights are useful in determining next steps. Similarly, for B2C companies, customer retention rate is an important KPI. Unlike B2B businesses, B2C deals seldom involve long term contracts and a continual inflow of revenue from paying customers. Finally, for B2B companies, a KPI like Customer Acquisition Cost (CAC) is a useful measure of the overall cost involved in onboarding a customer.
In this article however, we deal with a primary KPI(s) that impacts all businesses: Conversion Rates.
Conversion Rates
Conversion rates may refer to different concepts. It can mean conversions per activity; which measures how many customers perform the desired activity (clicking on an ad, signing up for a webinar, downloading a free booklet, etc) — all of which can be a part of an overarching campaign or strategy. Conversion per Activity is an important metric in it's own right when it comes to determining what works in your overall strategy.
While these activity conversions contribute to the ultimate success of the marketing campaign, the actual success is measured by sales conversions — How many people actually converted to paying customers?
Hence, conversion numbers usually fall into two categories:
Category 1: Lead Generation
These include conversions per activity, website traffic, social engagement, etc. Sometimes these indicators receive a bad rap for being some what superficial. However, they have their own value to marketers in understanding the overall efficacy of a strategy.
For example, Website traffic may not directly measure the impact of a strategy in acquiring new customers, but it can help determine impact of a strategy on brand awareness. This can be particularly useful when there is a strong correlation between awareness and sales. If 20% of your website traffic has converted to paying customers, improving the website traffic may have a positive impact on the final conversion numbers. Alternatively, if boosting website traffic does not seem to have any positive impact on sales, it can be a sign of potential customer pain points or inefficiencies in the overall marketing strategy.
Category 2: Sales Conversions
These are conversion metrics that measure for concrete, direct impacts on revenue. Here are three influential metrics to keep an eye out for:
I. Campaign Conversions or Conversions per Campaign:
This determines what percentage of traffic to a certain campaign landing page/webinar/new subscribers to a newsletter — turned into a customer.
How to measure: To find the campaign conversion rate, divide the traffic by the customers attributed to that traffic. For example, out of a 100 attendees to a webinar, 7 convert to paying customers, the conversion rate is 7%. Or if your ad had 200 interactions that can be tracked to 15 conversions, then you divide 15/200 to find the conversion rate of 7.5%.
Having a proper attribution model or platform in place is key to finding accuracy in such conversion numbers.
II. Website Conversion Rates:
It is safe to say that almost all B2B or D2C companies have websites which are their primary point of contact with potential and returning customers. So, the conversions from the website becomes an ultra important KPI. Although this indicator is calculated pretty much the same way as the campaign conversion ratio, it can get tricky as the customer journey gets complicated. There might be other touch points that impact the customer’s conversion decision even before they visit the website. Again, having a good attribution system is key to understanding the true impact of website traffic on conversions. It can help understand customer journeys and isolate the impact of the website on conversions. More importantly, it can help identify what works for the website and what doesn't. Insights like what pages converted users visited, how long they spent on those pages, what CTAs they acted on, etc can help figure out possible pain points and improve website conversions.
One thing to remember is that regardless of how customers make their way to the website and when they made the decision to buy, a website has important consequences for the conversion. In the digital age, a business’ website is essentially its storefront. It influences the customer’s perceptions and opinions of the business. In other words, it plays an important role in the customer journey. As such, the website conversion numbers are all too important to ignore for online businesses.
How to measure: The most common and direct way of measuring the website conversion rate is to divide the number of conversions in a given timeframe by the total number of people who visited the website in that timeframe. For example, if in the past week, a site had 100 visitors, and 10 visitors converted to customers, the website conversion rate is 10%.
III. Lead-to-Close Conversion Ratio:
The Lead-to-Close Conversion Ratio, more popularly known as CVR, measures the number of sales that were made in comparison to the total number of leads the marketing team started with. This indicator helps marketers focus not only on creating leads but also on actually closing them. In other words, it helps create quality leads who will actually make the purchase. The effectiveness of the various components of the marketing strategy can be measured with the CVR. It gives the all important insight of which campaigns convert leads to customers and which do not.
How to measure: Similar to the aforementioned, the CVR is calculated by dividing the number of sales by the number of leads generated. For example, if you started out with 1000 leads from webinar attendees or newsletter sign ups or holiday ad campaigns and 170 of them convert to paying customers then you have a CVR of 17%.p

Revenue Intelligence is Changing B2B Marketing
In this article we’ll cover,
1. What is Revenue Intelligence?
2. Why are teams increasingly opting for Revenue Intelligence?
3. Revenue Intelligence to Optimize Conversions
- Breaking down silos between marketing and sales
- Solves for uncaptured data
- Solves for outdated and stale data
- Targeting entire accounts with ABM
- Give sales leaders total visibility/Access to the larger picture
- Accelerate sales cycles with more efficiency
- Forecasting
4. The Emergence of Revenue Operations and Intelligence (RO&I)
Revenue intelligence (RI) is a popular buzzword in today’s marketing landscape. This enthusiasm may be warranted. RI is revealing itself to be a powerful tool for marketing and sales teams to derive powerful data insights that were hitherto unforeseen. RI uses AI to gather data that would otherwise remain uncaptured.
Let’s start with an example.
GrowNow is a marketing agency for start-ups. They focus on both digital and event services. Their content team has put out several articles on how marketers should approach scaling at various stages of growth.
Akshat is the marketing head of Company X that has a fintech product. They’ve found their product-market fit and now they are looking to scale. He is searching online for ways to scale marketing and branding efforts. He comes across GrowNow’s website and finds the information that he is looking for.
He is not a lead yet but marketing has the information on how he came upon the website and what pages he’s engaged with. He finds his way back to the website a few days later whilst searching for more information on what tech stack his team would need. He downloads a free report on GrowNow’s website on the latest trends in martech.
Finally, after a few weeks, Akshat comes back to GrowNow’s website, this time with a direct search and the intent to check out the services that GrowNow provides. He even fills a form for a preliminary call.
Now that Akshat has been converted, he is pushed to Sales and GrowNow’s CRM has the information that he filled on the form: his name, email address, title and company. They might also have other information like the report downloaded by him. Marketing directs a few more adverts towards Akshat over the next few weeks. Soon sales gets on call with Akshat, they use this information to convert him and they are successful.
Later on, Deepti, the CEO of clothing brand Y which has several pop-up stores finds GrowNow in an article on up-and-coming marketing agencies and clicks on the link which redirects her to their website. She spends some time looking through the website and fills a form. On receiving a call from an SDR, she learns more about their services. Marketing continues to send the same adverts based on Deepti’s website activity. However, after a few calls, they quickly realise that Company Y and GrowNow do not have a good fit. Sales had the same basic information about Deepti as they did with Akshat.
Both Akshat and Deepti’s customer journeys were a little different which sales were unable to access — like the data on their journeys pre-form fills. Similarly, marketing was unable to personalise websites based on Deepti and Akshat’s activities once they went down the funnel to SDRs. This in part, came about due to different locations of this data. Marketing has its data on first touch, web pages visited, time spent on webpages, adverts clicked on Google Analytics or other marketing platform while sales has its data on its CRM like Salesforce. Both departments were unable to access the other’s platform nor did they have an integration in place that allows for seamless flow of this information.
This is where Revenue Intelligence comes in.
What is Revenue Intelligence?
In its simplest terms, revenue intelligence refers to the process of leveraging AI to collect, sync and analyse data across sales, marketing and customer success to produce critical insights and generate revenue.
It is a powerful revenue operations tool that helps companies bring synergy between their customer-facing teams (marketing, sales and customer success) and make decisions that are powered by metrics.
Why are teams increasingly opting for Revenue Intelligence?
More and more companies are increasingly realising the limitations of human intelligence in identifying important data points as well as the limitations on relying only on CRM data for insights on customer journeys.
The solution to this, has been to look at AI to collate and identify data that humans cannot. Furthermore, RI helps teams coordinate and capture data at the right time, before data decay diminishes value -
1. Breaking down the silos between marketing, sales and customer success
Data silo is a problem when there is a lack of seamless coordination between teams, especially in terms of data collection and storage. A huge chunk of insights get lost when the data captured by these teams remains limited to their own teams. This is propelled by storing of data on different locations and difficulty in cross-departmental access of this data. All three of these departments are interacting with customers and have intelligence on customer trends and opportunities that get lost with interdepartmental misalignment with data getting siloed.
A revenue intelligence system captures and integrates the data from all these teams in real-time and creates a single, consolidated platform for the entire organisation. This ensures that everyone is on the same page and allows for seamless coordination between teams that helps create a unified strategy.
2. Solves for uncaptured data
Sales and customer success teams have to manually enter customer data like contacts, engagements, etc into their CRM. Two problems arise with this:
1. Manually entering data for each and every customer interaction is time consuming.
2. This leads to negligence as many sales and customer success fail to enter all a lot of this data. Around 55% of salespeople admit that they do not enter all lead and customer data.
Resultantly, a lot of available data remains uncaptured and the company relies on this incomplete data for reporting, planning and forecasting.
RI solves for uncaptured data by automatically capturing contacts and engagements data from all customer facing teams, solving for both time and incomplete data, leading to more accurate and reliable sales reporting and forecasting.
3. Solves for outdated and stale data
Sales and marketing data is susceptible to becoming stale.
Relying on manually entered contact details and the fact that people change jobs and positions and do not update their linkedin profiles leads to databases and CRMs being outdated and filled with errors. Good, high intent leads are very critical for both sales and marketing to reach their conversion goals.
Then there is also the consideration for the hidden cost of redundant data. Bad or outdated data can muddle up research, competitiveness and accuracy of forecasts. Poor data leads to the wastage of sales’s time and IT’s time in syncing systems. It causes frustration when data-backed decisions fail to execute results.
RI solves for this by automatically tracking and updating changes to the leads in the CRM. This ensures more up-to-date and reliable prospect data.
Revenue Intelligence To Optimize Conversions
1. Capturing missing sales activity
We’ve spoken about the problems of unco-ordination and data silos between sales and marketing. When marketing is unable to access sales data, it prevents potential for improving marking activity and checking for inefficiencies in the existing process. As discussed earlier on the Factors Blog, getting multitudes of leads won't have a positive impact on revenue unless they are good, qualified leads. Infact, it may just lead to a waste of the sales efforts. In such a case, RI helps marketing access sales data that is pertinent for marketing’s processes and planning for more efficient campaigns.
Auto-creating of leads based on sales’ experiences, auto-removal of leads that sales has already dealt with or are low-intent based on previous experiences — both lead to coordination of data as well as a more seamless process of lead identification and capturing of contacts.
Furthermore, automated opportunity association of leads and tracking of interactions (emails, meetings, etc) helps get more insights from available data.
2. Attributing Marketing Touchpoints
Apart from sending better leads to sales, RI also helps paint a clearer picture of how marketing is helping sales acquire leads that lead to conversions. This helps in both having a better understanding of customer journeys and measuring the impact of marketing in the organisation’s overall functioning.
Revenue intelligence helps with marketing attribution reports that highlight marketings total impact, impact in each channel and the creation of first-touch, last-touch and multi-touch reports. RI also simplifies visualising the opportunity journey with easy spotting of marketing email and campaign touchpoints and deal updates as leads move through the funnel.
3. Enhances ABM
Revenue Intelligence helps optimise ABM by improving the data quality of the contacts that are captured for the various accounts. With automation, more contacts can be captured. These contacts are also of better quality due to the improved tracking of customer engagements.
RI also allows you to pursue better personalisation and target marketing efforts based on an account’s firmographic features and funnel position. So teams can get more meaningful insights from CRM and build improved target account audiences.
4. Giving sales leaders access to the larger picture
RI helps sales leaders have a better understanding of the customer journey and gain insights into the prospects that are coming in. Furthermore, having a real-time system of data relating to sales helps with insights into the sales process.
5. Improved sales pipeline
Better prospects, higher intent leads determined based on historical and real-time data improves the quality of leads entering the sales pipeline which in turn leads to higher conversions. Apart from higher output, RI also helps SDRs close deals faster and improve productivity.
6. Forecasting
Revenue Intelligence helps sales forecasting by solving for outdated and uncaptured data to improve the reliability and accuracy of predictions.
The Emergence of Revenue Operations and Intelligence (RO&I)
RO&I is a tech category that leverages AI to perform the principal task of revenue operations: integrating sales, marketing and customer success. In other words, RO&I is technology that allows the integration of sales technology, marketing technology and customer success technology to provide an end-to-end solution from customer acquisition to retention and expansion.
Revenue Intelligence tools help teams get the best out of revenue intelligence and empower their Rev Ops efforts with better data and more improved efficiency in mapping customer journeys. Knowing when to reach out to potential customers with the right information at the right time is critical to improving experience and conversions.

Data Correlation in B2B Marketing Analytics
Correlation vs. Causation
Correlation occurs when no cause and effect can be established between two variables that have a relationship. For example, the level of education of parents is positively correlated with the salary levels of their children. In other words, higher levels of education of parents has been observed in higher salary levels of their children. However, this does not mean that a direct causation can be established. If that were the case, to increase your salary level, you would simply have to get your parents in schools and universities. Another such example of correlations exists between heights and weights. Your height is not causing your weight but taller people tend to be heavier than shorter people.
Causation means that there exists a cause and effect relationship between two variables. In the education example, a direct relationship may exist between education level of a child and the average salary he earns. Someone who just completed an undergrad and someone who just finished an MBA might get different salaries even at the same experience level regardless of their parent’s education levels.
Correlation ≠ Causation
It is important to be able to distinguish between causations and correlations. The best way to differentiate the two is to consider all other factors that are involved in the outcome. For example, there exists a strong correlation between the data for ice cream consumption and murders. This correlation is a complete coincidence. But if you were to apply causation, it becomes worse because then it implies that ice cream consumption leads to murder.
Applying causation in less subtly absurd correlations can be even more harmful, especially if budgeting decisions are based on cause and effect relationships between touch-points. Ideally, most data analysts avoid establishing causations. First, because its hard and correlations are easier to establish. Second, direct causations are very rare.
Correlations in B2B Marketing Analytics
Establishing correlations and causations is fundamental to any and all data analysis. Marketing analytics is no exception to this. Correlation insights help marketers make sense of their data points. In turn, this contributes to optimizing marketing efforts and determining the impact of marketing on KPIs and revenue.
In other words, correlation analytics identifies valuable patterns within the story, your marketing data is trying to tell you. Here’s how:
1. Understand the impact of your SEO/PPC
2. Test campaign decisions during implementation
3. Determine the revenue impact of customer touchpoints
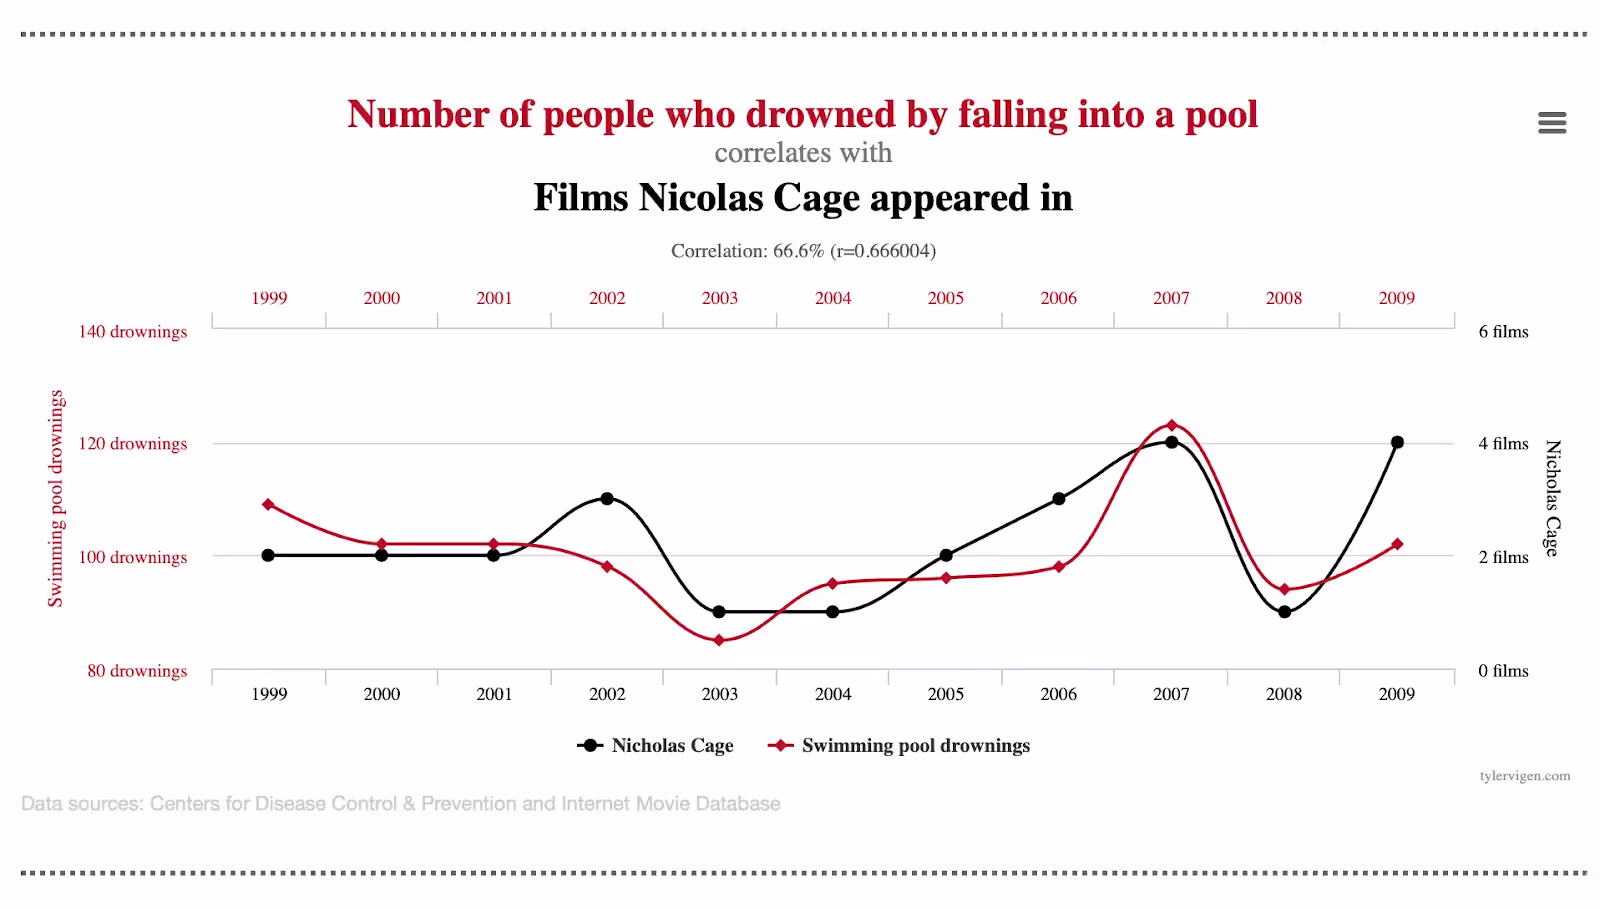
There can be several pitfalls to correlations data, particularly in cases where coincidences can be mistaken for statistically significant relationships. Some can be very obvious, others are not so much. For example, there exists a strong correlation between the number of pool drownings and films that Nicholas cage has appeared in through the years. Another perfect correlation is between total revenue generated by arcades and CS doctorates awarded in the US. But as is plain, these events have nothing to do with each other.
Let’s take a marketing example. Say a company decides to mail catalogs of their retail products to their target audience in Karnataka. Soon after, they Ef a stark rise in orders placed from Odisha. Intuitively, the right move would be to send more catalogs to Odisha to support the growing demand for your product. However, as a result of the strong relationship between the two touch-points, correlation analytics would suggest shipping catalogs to Karnataka instead.
Best Practices for Correlation and Causation in Marketing Analytics.
Avoid confirmation bias
Confirmation bias in correlations data occurs when your data inaccurately confirms a bias. Say, a preferred channel is performing better than another and a correlation that confirms your belief, you are likely to assign causation that isn’t there.
Anish is the marketing head of Company X. He recently had a celebrity promote X’s product. He worked hard on getting them on board and was sure that it will drive sales. Soon after, he noticed a spike in the number of website redirects from Facebook and immediately assigned the causation for this increased traffic to the celebrity’s campaign. Expecting similar results, he invests further resources and runs another ad with the celebrity. However, there is no change in performance. There is something amiss in the marketing head’s correlation analytics. Instead of checking for causation, he let your subjective assumptions take over. This is confirmation bias in play.
To assign definitive causation, it is necessary to check for coincidences. In this example, tracking performance data for the campaign across channels is a good way to assign cause to the campaign. Simply put, if the celebrity is affecting more people to click on this ad, then there should be a percentage increase in clicks in all channels that carried the ad with the celebrity. So Anish should’ve tried to corroborate the results, keeping all other things (like the intent of the target audience) constant across all platforms (Google, Facebook, Instagram, etc). On running such an analysis, he notices that only Facebook had a spike in traffic after the first ad, which wasn’t replicated across other platforms or even on Facebook itself when the second ad was shared. On further research, he learns that the platform had made changes to its algorithm around the same time, which seems to have impacted all ads on Facebook, including X’s.
Using quantitative data from all channels can help avoid making decisions or causations around subjective assumptions.
You can use a marketing analytics tool like Factors can help you check how a touchpoint is helping or hurting pre-determined conversion goals. The funnel feature allows you to customise your queries to check for specific correlations. Funnels can be created for website redirects, and in this example, the celebrity ad could be compared across channels in a few clicks and Anish could check whether to attribute the change to the celebrity ad or if there’s something else at play.
A/B testing
One of the best ways to establish effective correlation is A/B testing. Let’s say you’re revamping your website homepage and want to test the impact on traffic and conversions. A/B testing involves testing a variable (for example, the position of a “schedule demo” button). This change is tested across two-time frames — pre-change and post-change.
Let’s change the previous example and assume that the spike in Facebook redirects did not happen immediately after running the ads but happened a few weeks later. In the absence of a proper pre and post analysis, it is human nature for Anish to attribute it to the ad campaign. But if he did a pre-and post-analysis of the impact of ad campaign on redirects, he might find that the cause for the change is something else.
You can use tools like Factors.AI to record changes like new ads when they occur and use data from the various channels like Facebook as well as your website or conversions to A/B test campaigns. The funnel feature allows you to use campaign naming conventions to get data pre-change and post-change.
Analyse the impact of correlations across channels.
Looking out for correlations and establishing possible causations can help understand how a specific touchpoint is affecting pre-determined conversion goals. If you want to check impact on goals like say, web event sign-ups, white paper downloads or even deals won, you can use correlation and causation analytics to figure out what touchpoints are saying, helping you schedule demos, what touchpoints on your website is driving down form fills, etc.
Factors allow you to compare metrics on a week on week basis to catch changes in any of the metrics. The explain feature allows you to check for what URLs or web pages your users have visited before submitting a form. Apart from identifying URLs that have influenced the users to convert, you can also see which webpages aren’t performing well. Weekly sessions data can help see short term changes, apart from A/B testing. Correlations can also be checked at a segment level, like demographics, industries, business model types, etc.
Choose the right graphs for correlation analysis/reporting
Data collection is only the first step to understanding correlations. The second step is to read the data and share the insights. After getting the insights, you act upon the data as well as build data-driven strategies. To understand how a touchpoint is interacting with each other and the impact of a change on your conversion metrics and revenue, you can use graphs.
There are several kinds of graphs that can be used for correlation analysis.
Time-series graphs:
These reports compare metrics over time periods. They are most appropriate for trends or changes in metrics post a change in a touchpoint or campaign strategy etc.
Distribution Graphs:
These graphs can easily show when there is a correlation. They show changes in distribution against a mean.
Funnel comparison graphs:
These graphs can be used to see a side by side comparison of funnel queries. Say you want to see how ad 1 and ad 2 have impacted the conversions, you can see a side by side strategy comparison of the two. You can also compare the same funnel before and after a specific time period.
There are also other graphs like relationship graphs that help see the relationship (positive, negative or nil) between two or more metrics.
In closing...
In the age of data-driven marketing, it is important to know how to treat your data. Every customer journey and every touchpoint weaves a larger story where the channels are connected and touchpoints impact each other to influence each potential customer to convert. Correlations can help bring forth these insights that are invisible to the naked eye and can help you craft a winning marketing strategy for your organisation.

