

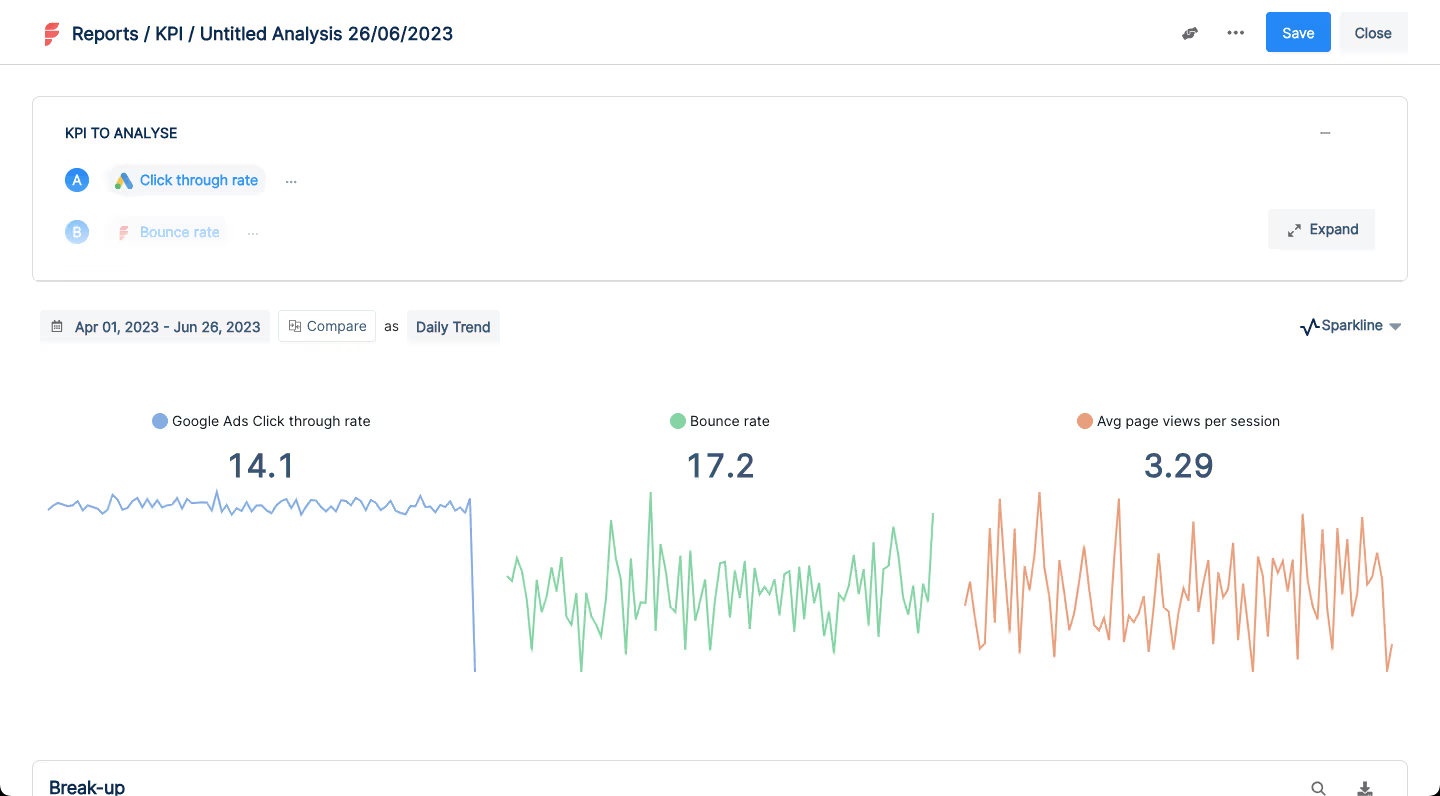
The State Of B2B Marketing Data Privacy
It’s no secret that data privacy is a macro trend that’s here to stay, and with good reason. As social interactions and business operations increasingly take place in digital spaces, users are rightfully concerned about the safety of their sensitive information.
Accordingly, government bodies and security experts have established comprehensive privacy guidelines to ensure the protection of user data. Privacy laws such as GDPR, CCPA, and PECR limit the extent to which websites and businesses can track user activity without explicit consent. While there’s no doubt that this is a win for end users, it may seem like a cause for concern to data-driven marketing teams.
In fact, 73% of GTM teams believe that data privacy regulations will negatively affect their analytical approach to marketing. This article highlights why this is not necessarily true. Let’s explore how privacy-first solutions like Factors empower data-driven marketers to flourish in 2024 and beyond.
Marketers need data. Here’s why.
Marketers need data to understand and improve the customer experience. This, in turn, results in better conversions and revenue. With data, analytics, and testing marketers can target the right audience with the right message and persuade prospects to become customers. Ideally, it's a win-win situation: marketers spend their budgets efficiently on campaigns that work, and buyers receive relevant promotions as opposed to spammy, spray & pray advertising. In truth, this is nothing new.

Data has been leveraged by marketers and advertisers since the days of Ogilvy, and with sweeping digital transformation, data tracking has become all the more prevalent. For example, mobile phones today constantly transmit precise gro location as a common user identifier across consumer apps. In comparison, B2B tracking has remained relatively benign — yet effective. B2B marketers have the ability to identify companies visiting their website, track their page visits, scroll depth, and other noninvasive metrics to be able to understand and improve the customer experience.
The dawn of privacy-first analytics
So far, this sounds great. However, while the intention with which marketers collect data is rarely malicious, the tools and techniques used in this process have been, until recently, without guardrails.
Fortunately, we’ve been seeing a dramatic improvement in data privacy and security in recent years. Today, privacy-first marketing intelligence and analytics tools (Like Factors 😉) honor privacy principles to ensure that data is used only for its intended purpose — to improve the customer experience. Even widely used tools like Google Analytics are having to rework their architecture to comply with regulations.
With tools like Factors, there’s no risk of data being collected without consent, shared with third-parties, or sold to advertisers. Even with this secure approach, marketers can continue to access everything they need to discover new prospects and optimize their performance without intruding on privacy.
The most important aspect for marketers is to be able to draw the line between reasonable and intrusive tracking. Collection of PII without consent or the ability to identify individual users across websites is illegal and would fall under the latter. As an important practice, marketers should vet their technology vendors keeping this in mind.
That being said, Factors and other privacy-compliant tools are secure by design. Customer information is protected without compromise on the quality of data, analytics, or insights derived. The following sections cover the basics of what you need to know about the most important marketing data privacy regulations — each of which should be considered when investing in marketing technologies.
1. First-party cookies
First-party and third-party cookies play important roles in the collection of user information. Here’s a quick overview of what cookies are and how first-party and third-party cookies differ from each other.
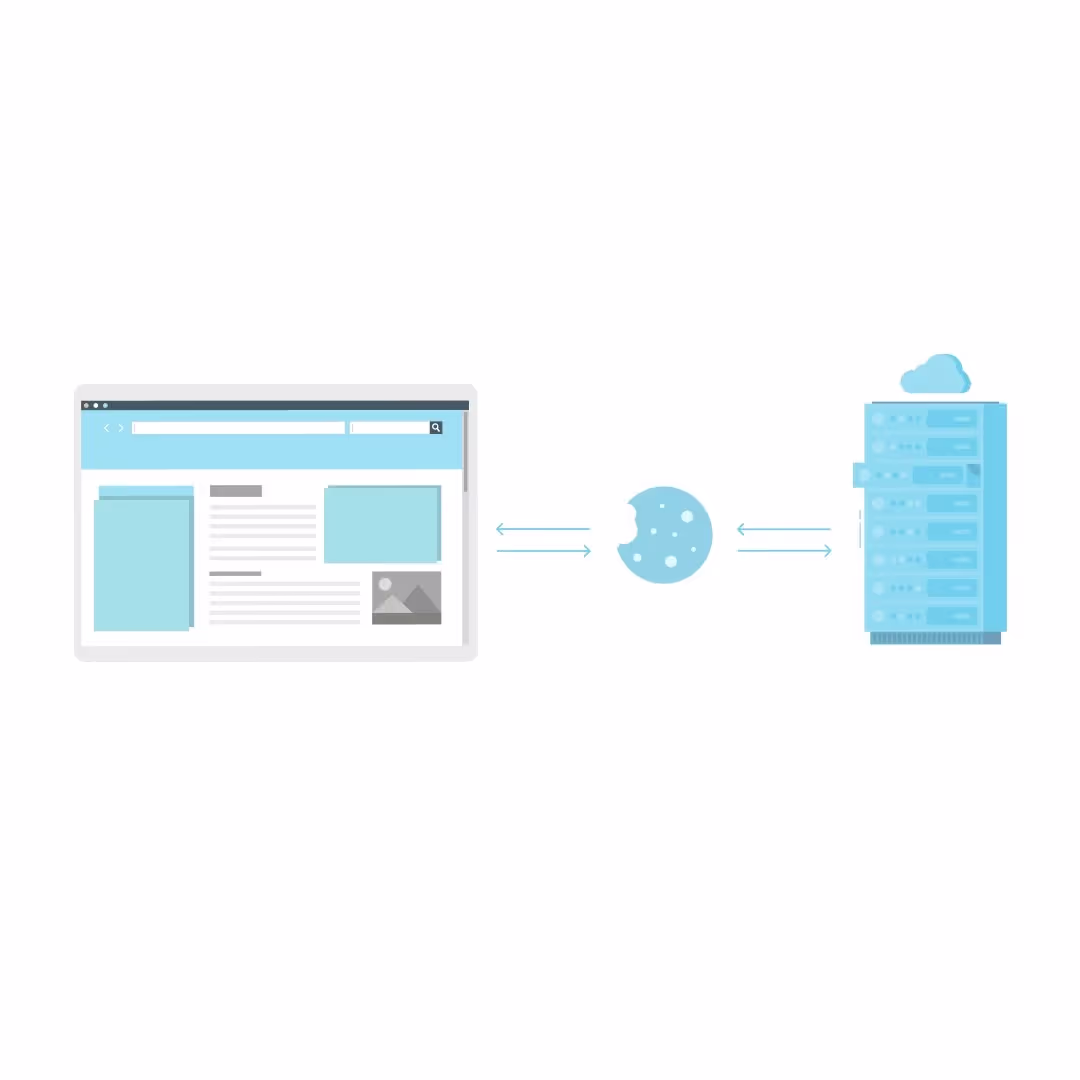
Cookies or HTTP cookies are tiny pieces of data that are sent to your browser from a web server. This data is stored locally on your device so that the next time you visit a website, it can identify you as the same user. So what’s the difference between first and third party cookies?
First-party cookies: FPC are set directly by the website you are browsing. Their primary purpose is to collect analytics data such as page views, button clicks, and form submissions to improve website functionality and enhance user experience. Without first-party cookies, a user would have to sign in to an account every time they visit a new page on the website or app. Even the most basic preferences like language setting would have to be reconfigured on every page without first-party cookies. In short, they’re entirely harmless and collect basic website data to help marketers eliminate areas of friction and improve website usability.
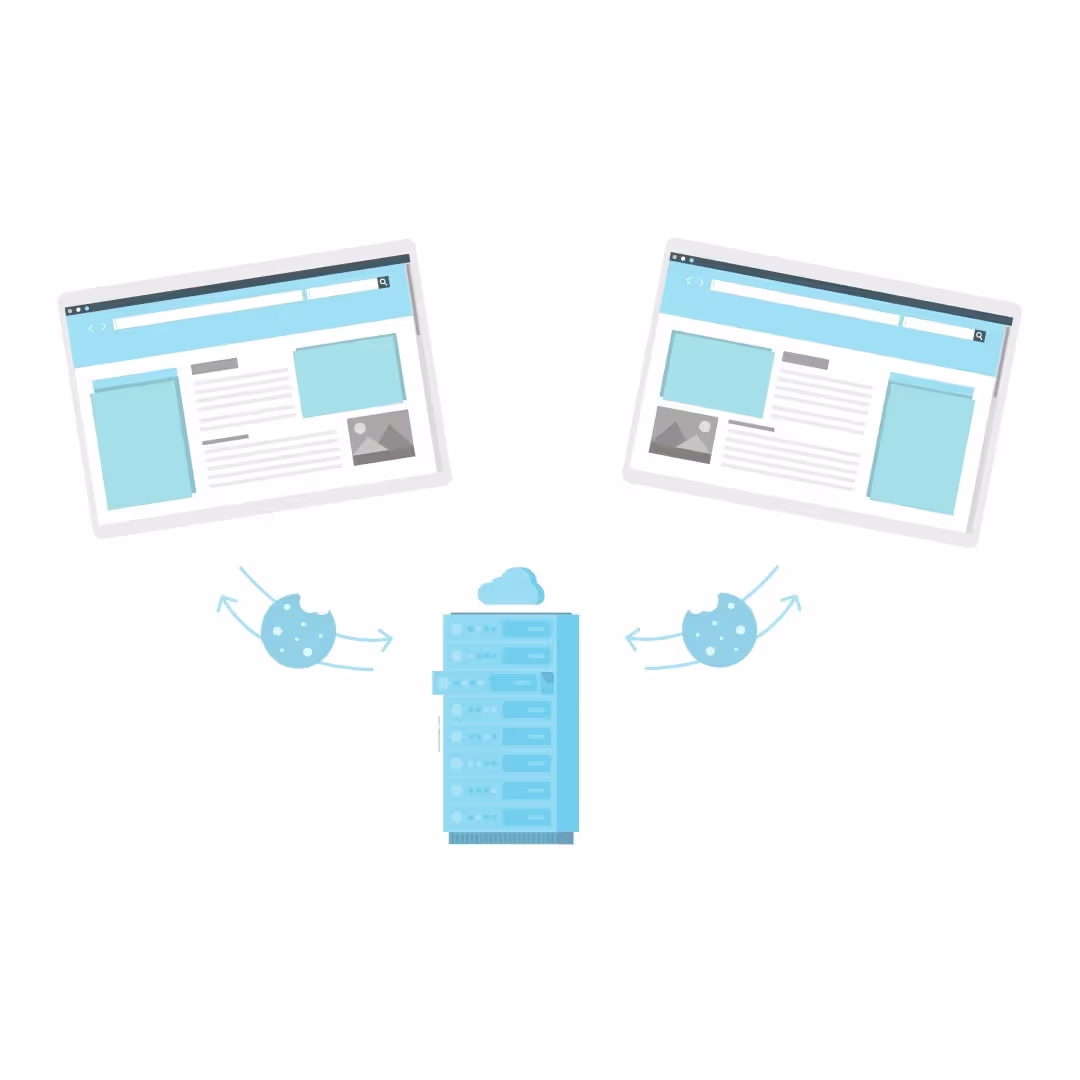
Third-party cookies: Third-party cookies are tracker cookies which are set by third-party servers (or ad servers) independent of the website a user is browsing. Third-party cookies are accessible to any website that can load the server’s script. More often than not, these cookies are used for unsolicited advertising and are set by ad networks like Google’s AdSense program.
Websites that accommodate ad spaces from servers such as Google’s “DoubleClick” also allow them to place third-party cookies. These cookies can track your browser history and identify interests to facilitate retargeting. That way, when you visit a website that also hosts a similar ad server, it will display a targeted advertisement using the same third-party cookies.
Factors.ai only uses first-party cookies to enhance your user experience with zero intention in building an interest profile or a third-party context with first-party cookies. More information on the usage of cookies here. Third party cookies are generally considered to be questionable and in some countries, illegal. This is because there’s no certainty as to what data these cookies are collecting and how that data is being used. Accordingly, it’s best to avoid tools that use third party cookies.
By design, Factors only uses first-party cookies to track visitor activity and enhance user experience. Tools like Factors have no ownership rights over your user data. They do not share or monetize first-party data collected from users in any way, shape or form.
2. GDPR Compliance
GDPR (General Data Protection Regulation)
General Data Protection Regulation is a privacy regulation standard that covers data protection andp privacy in the EU and European Economic Area. Under this regulation, businesses are required to receive voluntary or opt-in consent to collect personal information of customers, which needs to be clear and unambiguous.
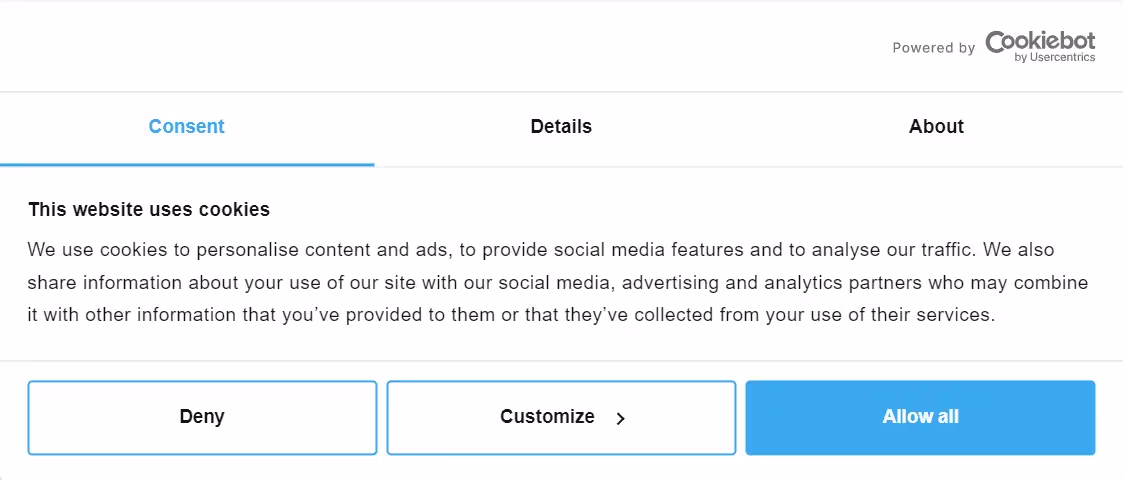
Personal information is defined by the GDPR as “any information which is related to an identified or identifiable natural person”. Information like IP addresses or any other data that can be traced back to a person is required for analytical purposes will require the user’s consent under the GDPR. This is why you may have noticed several privacy-compliant websites request consent on tracking personal information when you visit.
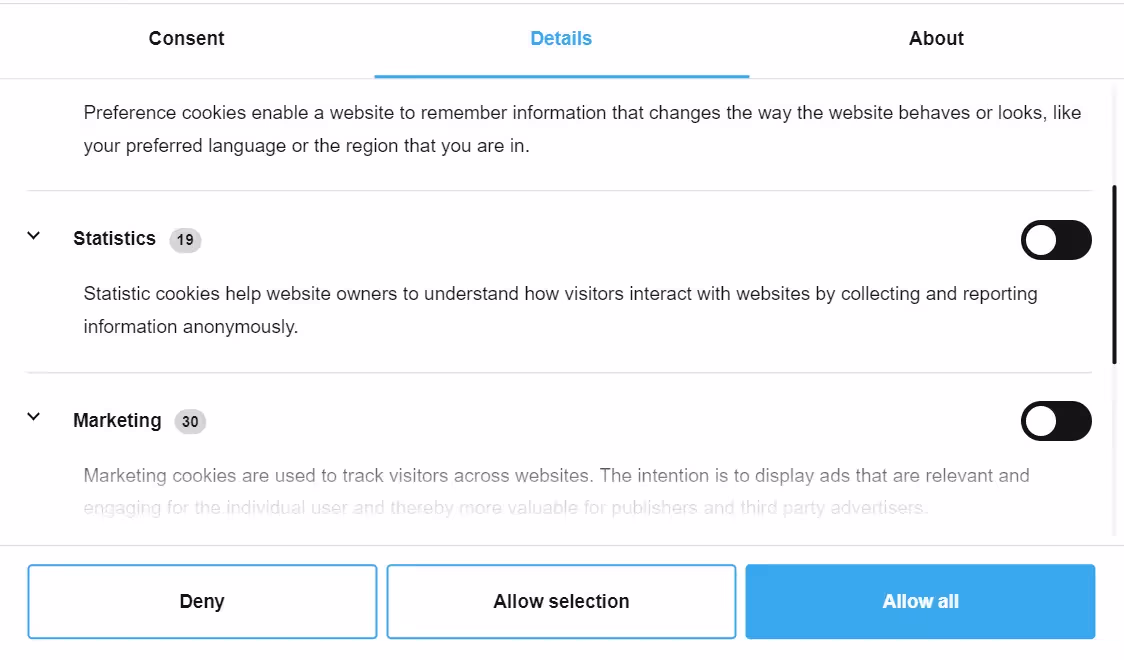
It is important to note that the consent of collecting personal information cannot be preordained or implied like in the form of pre-ticked boxes. Instead, the user must choose to opt-in to the collection of data and provide adequate detail on the information being tracked.
When complying with the GDPR, businesses must also comply with a set of rights with regards to personal information being collected. These include:
- The right to disclose and access the information collected
- The right to request for a correction of the information
- The right to request the erasure of personal information
- The right to register a complaint on the handling of personal information
- The right to request a restriction in the processing of personal information
- The right to object to the method in which your information is being processed
- The right to retrieve personal information and transfer it to another party, and
- The right not to be subject to a decision that is based on automated processing and has an adverse legal effect on the user
Factors is aligned with GDPR rules and regulations. At present, Factors stores its data in US-based cloud-company servers. Note that the GDPR does not mandate the storage of data of EU citizens and residents within the EU. Additionally, while Factors collects IP addresses for high-level enrichment such as coarse geolocation (city, state-level) and account identification, this data is purged. We do not store IP or firmographic data in our database.
CCPA (California Consumer Privacy Act)
The California Consumer Privacy Act is a state-wide data privacy law that regulates how organizations handle personal information (PI) of California residents. Under the CCPA, the collection of personal information does not require opt-in consent for adults. That being said, just like the GDPR, users under the CCPA have the right to access personal information being collected and the right to opt out of the sale of personal data to third parties.
Factors is CCPA compliant. In fact, by design, we do not have the ability to share, sell, or store personal data to third parties.
PECR (Privacy and Electronic Communications Regulations)
The Privacy and Electronic Communications Regulations (PECR) represents the UK's law on how businesses are allowed to market to UK consumers using electronic technology. This regulation deals with unsolicited marketing, which includes things like cold calls, fax, text and emails, etc. PECR does not apply to solicited marketing — or marketing messages that are voluntarily requested. Even if a person has opted-in for marketing from your businesses, there are still instances that are defined as unsolicited, which would have to comply with PECR. As a marketer that relies on email marketing, detailed information on the consent must be provided to the person you are emailing. Consent must be received in the form of an action, whether it is written or ticked on a box.
The rules of PECR slightly differ for B2B, where there is an exception to retrieving consent for emails and text messages. If you intend on the processing of personal information of corporate subscribers (B2B) or/and individual subscribers (B2C), the rules of UK GDPR apply.
Surprise, surprise — Factors is also aligned with PECR regulations.
SOC2 Compliance
While marketing under the aforementioned regulations would advocate a fair degree of privacy assurance to your users and necessitates consent. A Service Organization Controls 2 or SOC 2 compliance raises the stakes on the safety and confidentiality of customer data. SOC 2 is a set of criteria that define how a business should go about managing customer data and the examination of relevant controls in accordance with those criteria. While it is not legislation for data privacy, an SOC2 certification is the cherry on top of your data privacy practices and the forefront of establishing security standards as a part of being a privacy-first organization. It works on 5 trust principles:
- Security: This involves the use of tools such as application firewalls and two-factor authentication for the protection against unauthorized access of systems.
- Availability: This refers to the software, systems, or information that is available and is being maintained at a minimum acceptable performance level.
- Processing integrity: This ensures that a system completes its objectives in a valid, timely and authorized manner with no errors in the system processing.
- Confidentiality: Using encryption and limited access of data to ensure its disclosure is only restricted to a few people.
- Privacy: This refers to the personal information of the system that is being collected, retained, used, disclosed and disposed of in compliance with the organization’s privacy notice and GAPP (Generally Accepted Privacy Principles).
Factors.ai is also SOC2 compliant.
Playing the long game — B2B Marketing Privacy In 2024 & Beyond
As more intent and uses of personal information by businesses get discovered, postmodern norms for regulation on the safe collection of data gets more rigid. Falling short on the compliance of these regulations will lead to the obstruction of marketing efforts. Here are some reasons as to why marketers should consider becoming privacy-first:
- Data privacy and being privacy-first is bound to become an industry standard for marketing considering that web analytics is more of a necessity than a value adding requirement.
- The legality of data privacy regulations will severely affect the operational efficiency, and even the going concern of the business. Data privacy under legislation is an obligation.
- The conception of regulation for data collected and processed by artificial intelligence caused by an inevitable surge in automated workload is well underway.
Today, Google Analytics is illegal in Austria, Italy, Sweden, Denmark, and other European countries because the CLOUD Act allows US authorities to demand personal data from Google, Facebook, Amazon, and other US providers — even when they’re operating in external locations (like the EU). Regulation will only get more stringent — like the new revisions of the CCPA under the CPRA which goes into more detail on the sharing or disclosure of personal information. Being compliant early will help you stay ahead of the game.
More businesses will need to prioritize being privacy-first by building a decision framework around the management of personal information. This means making data privacy, its regulation, and the control of user data for the long haul the cornerstone of your business and marketing efforts.
.webp)
Build Vs. Buy for B2B Marketing Analytics (Part I)
The following is a two-part blog on aiding your decision between building and buying a B2B marketing analytics and attribution solution. Part I deals with understanding the need for B2B marketing analytics and attribution. We also breakdown the technical requirements for an in-house solution, and what it would take for an off-the-shelf solution to deliver a similar experience.
Part II takes a logistical standpoint. There, we explain the practical resources required for a robust B2B marketing analytics and attribution solution. We also break down the opportunity cost of building and buying such a solution. Hopefully, this leaves you with valuable insights in cementing your build vs buy decision.
1. DEFINING THE NEED
Before we get into the nitty-gritty, we need to understand the need for marketing analytics and attribution under a business’s marketing function. This in turn necessitates the requirement of an off-the-shelf or in-house solution. This can be boiled down to two needs — tracking and optimization.
Tracking: In recent years, marketing has been losing its gravity as a core function of a business’s operations. As a result, justifying its revenue contribution is becoming increasingly vital. With lengthy B2B sales cycles that stretch across several months, waiting on revenue is simply not an option. This is where the use of marketing analytics with indicative metrics and KPIs (such as CPA, CTR, CPL, and web traffic analytics, etc) help in tracking and justifying the ROI of the marketing function before having to wait on your closed-won revenue contribution.
Optimisation: The optimisation need can be summarized as the need to quantify performance at a channel/campaign level and determine what to invest more or less in. Multi-touch attribution is used to facilitate this need. The requirement to optimize B2B marketing efforts will vary depending on the length of your sales cycle — but is nonetheless indispensable. Attribution is a tentative requirement, while Tracking is usually an everyday thing.
2. UNDERSTANDING YOUR REQUIREMENTS
Now that we have defined the need for a marketing analytics and attribution solution, choosing to build or buy comes next. The problem here is acknowledging that when you’re considering a solution, different marketers have different needs and resources. While some marketers only need the bare minimum, others may opt for more sophisticated solutions.
The presupposition here is that the following part of the blog on your technical requirements will always highlight more than just the bare minimum, while also zeroing on what an off-the-shelf alternative has to offer.
TECHNICAL REQUIREMENTS
Tracking and Collection
Your primary requirement for an in-house marketing analytics and attribution solution is to track user data and user interactions. There is a wide array of data that is to be tracked — page views, URL changes, web events, web sessions, CTAs, button interactions, form downloads, demo scheduled, and more. While you could limit what you track, it’s always advisable to track as much as you possibly can, as long as it is relevant to your analytics.
Ideally, your in-house solution should be able to track all of the above. There are two ways of building this. You could either opt for a CDP like Segment to automatically collect this data or construct a solution with developer dependency.
The developer will need to be able to create an event into your analytics stack every time an action occurs. The biggest concern with this approach is that it is risky. Especially when there are changes on the website, as it is too meticulous to be able to scale. That being said, you want to have a solution where your marketing team is not too dependent on your engineering team. Else this will only cause more harm than good.
SDK Requirements
The general concern with using an SDK is understanding that it will have to work with different website frameworks — like single-page applications (SPC) and normal web applications. Additionally, as websites are developed using different technologies like React JS, WordPress, CMS HubSpot, you’ll have to ensure that your SDK is sufficiently compatible.
Your SDK will need to be fine-tuned to be able to send data to your server. Webpages have to load A LOT of content including images, animations, text, etc. Your SDK will need to be able to capture events and put them in a queue to be sent at a later time. It will also have to be optimized for different internet speeds — mobile internet vs broadband. These factors should not be taken for granted. Failing to optimize your SDK could either crash the client website or result in the collection of incomplete data. Your goal here is to engineer a light yet effective SDK that captures and sends data without a compromise on user load time.
Tools like Segment and Google Analytics will help you track the events. However, these solutions are not fully automated and will require developer dependency. Factors.ai is tailor-made for marketing analytics. We also facilitate an advanced SDK that empowers robust web tracking, zero developer dependency, and more.
Data Handling and Cleansing
For a marketing analytics use-case, your in-house solution will need to be able to handle different types of data. More specifically 3 types of data:
1. Campaign reports from ad platforms
2. Event tracking data from your website
3. Objects from your CRM
Your goal is to build a solution that can handle all 3 of these data types. Doing this will prove to be challenging. At a base level, you will need to understand the objects of your CRM and how they are connected. Salesforce, for example, records accounts, contacts, opportunities, leads, products, campaigns, users, and dashboards as their standard objects. You can also create custom objects. You will then need to model your web analytics events against the users on your CRM customer data. Not to mention a separate data stack for ads data from Facebook, LinkedIn, Google Ads etc.
Data cleansing could be best explained with an example: In most off-the-shelf web analytics solutions, a web session will have some parameters set to distinguish itself from other sessions. For example, when a user is inactive for more than 30 minutes on your website, it will be tracked as a new session. Another one is when a user visits your website through an ad and a session begins, but then clicks on another ad to the same site shortly after. In this case, they will be considered as separate sessions as they come from different ad sources.
In other words, designing web sessions based on a period of inactivity or distinct UTM parameters are examples of data cleansing. Failing to do this, and other such data cleansing practices, will result in a lot of nuanced difficulties.
While most off-the-shelf solutions will handle such cleansing and data categorization, note that most of these analytical solutions usually handle only one of the three data types. Factors.ai, on the other hand, consolidates all three.
Data Storage and Warehousing
As a business running data analytics, it is important to acknowledge that data warehousing is a core need. Unfortunately, companies that adopt a data warehousing solution are still in the minority. One could argue that they could rely on application databases. This, however, will result in processing constraints and logistical difficulties. Alternatively, most data warehousing solutions process analytical queries in a more effective, columnar fashion. They also serve as a centralized data hub for all your workflow data. Modern data warehouses also make it cost-effective to scale your data warehousing. Therefore, it would be preferable if your analytics solution had an export to a data warehouse like Google BigQuery.
Attribution and Presentation
The previous tracking and handling data requirements form the basis for a robust marketing and web analytics. But what about marketing attribution?
For an attribution solution, you will first have to refer to the contacts on your opportunity account in your CRM. Then identify all data touch-points you encountered with those contacts — these could be webinars attended, demos scheduled, white paper downloads, field events, etc. These are all website sessions that are driven from different ad campaigns, email campaigns, etc. After accumulating all this data over a certain time frame, there will be an X amount of opportunity value that can be attributed to these touch-points. You will have to credit them and to do that you can utilize several existing multi-touch attribution models — refer to this blog to learn more. You could even implement a custom model — for example a model that attributes more credits to contacts with job titles past a certain level, and fewer credits for one below that level.
Presenting your marketing analytics and attribution reports requires breaking down, summarizing, and visualizing an extensive amount of data. For this, you would have to set up a dashboard and operate a data visualization tool — like Tableau and Looker. This requires a fair amount of expertise to assemble. What makes this process challenging is building out all the SQL queries for these reports.
Ensuring the correct data and the right quantity of data is being delivered to your dashboard is key. An overcomplicated dashboard or several superfluous dashboards won’t run efficiently. Ideally, you don’t want your team of data engineers to be preoccupied with operating existing data pipelines.
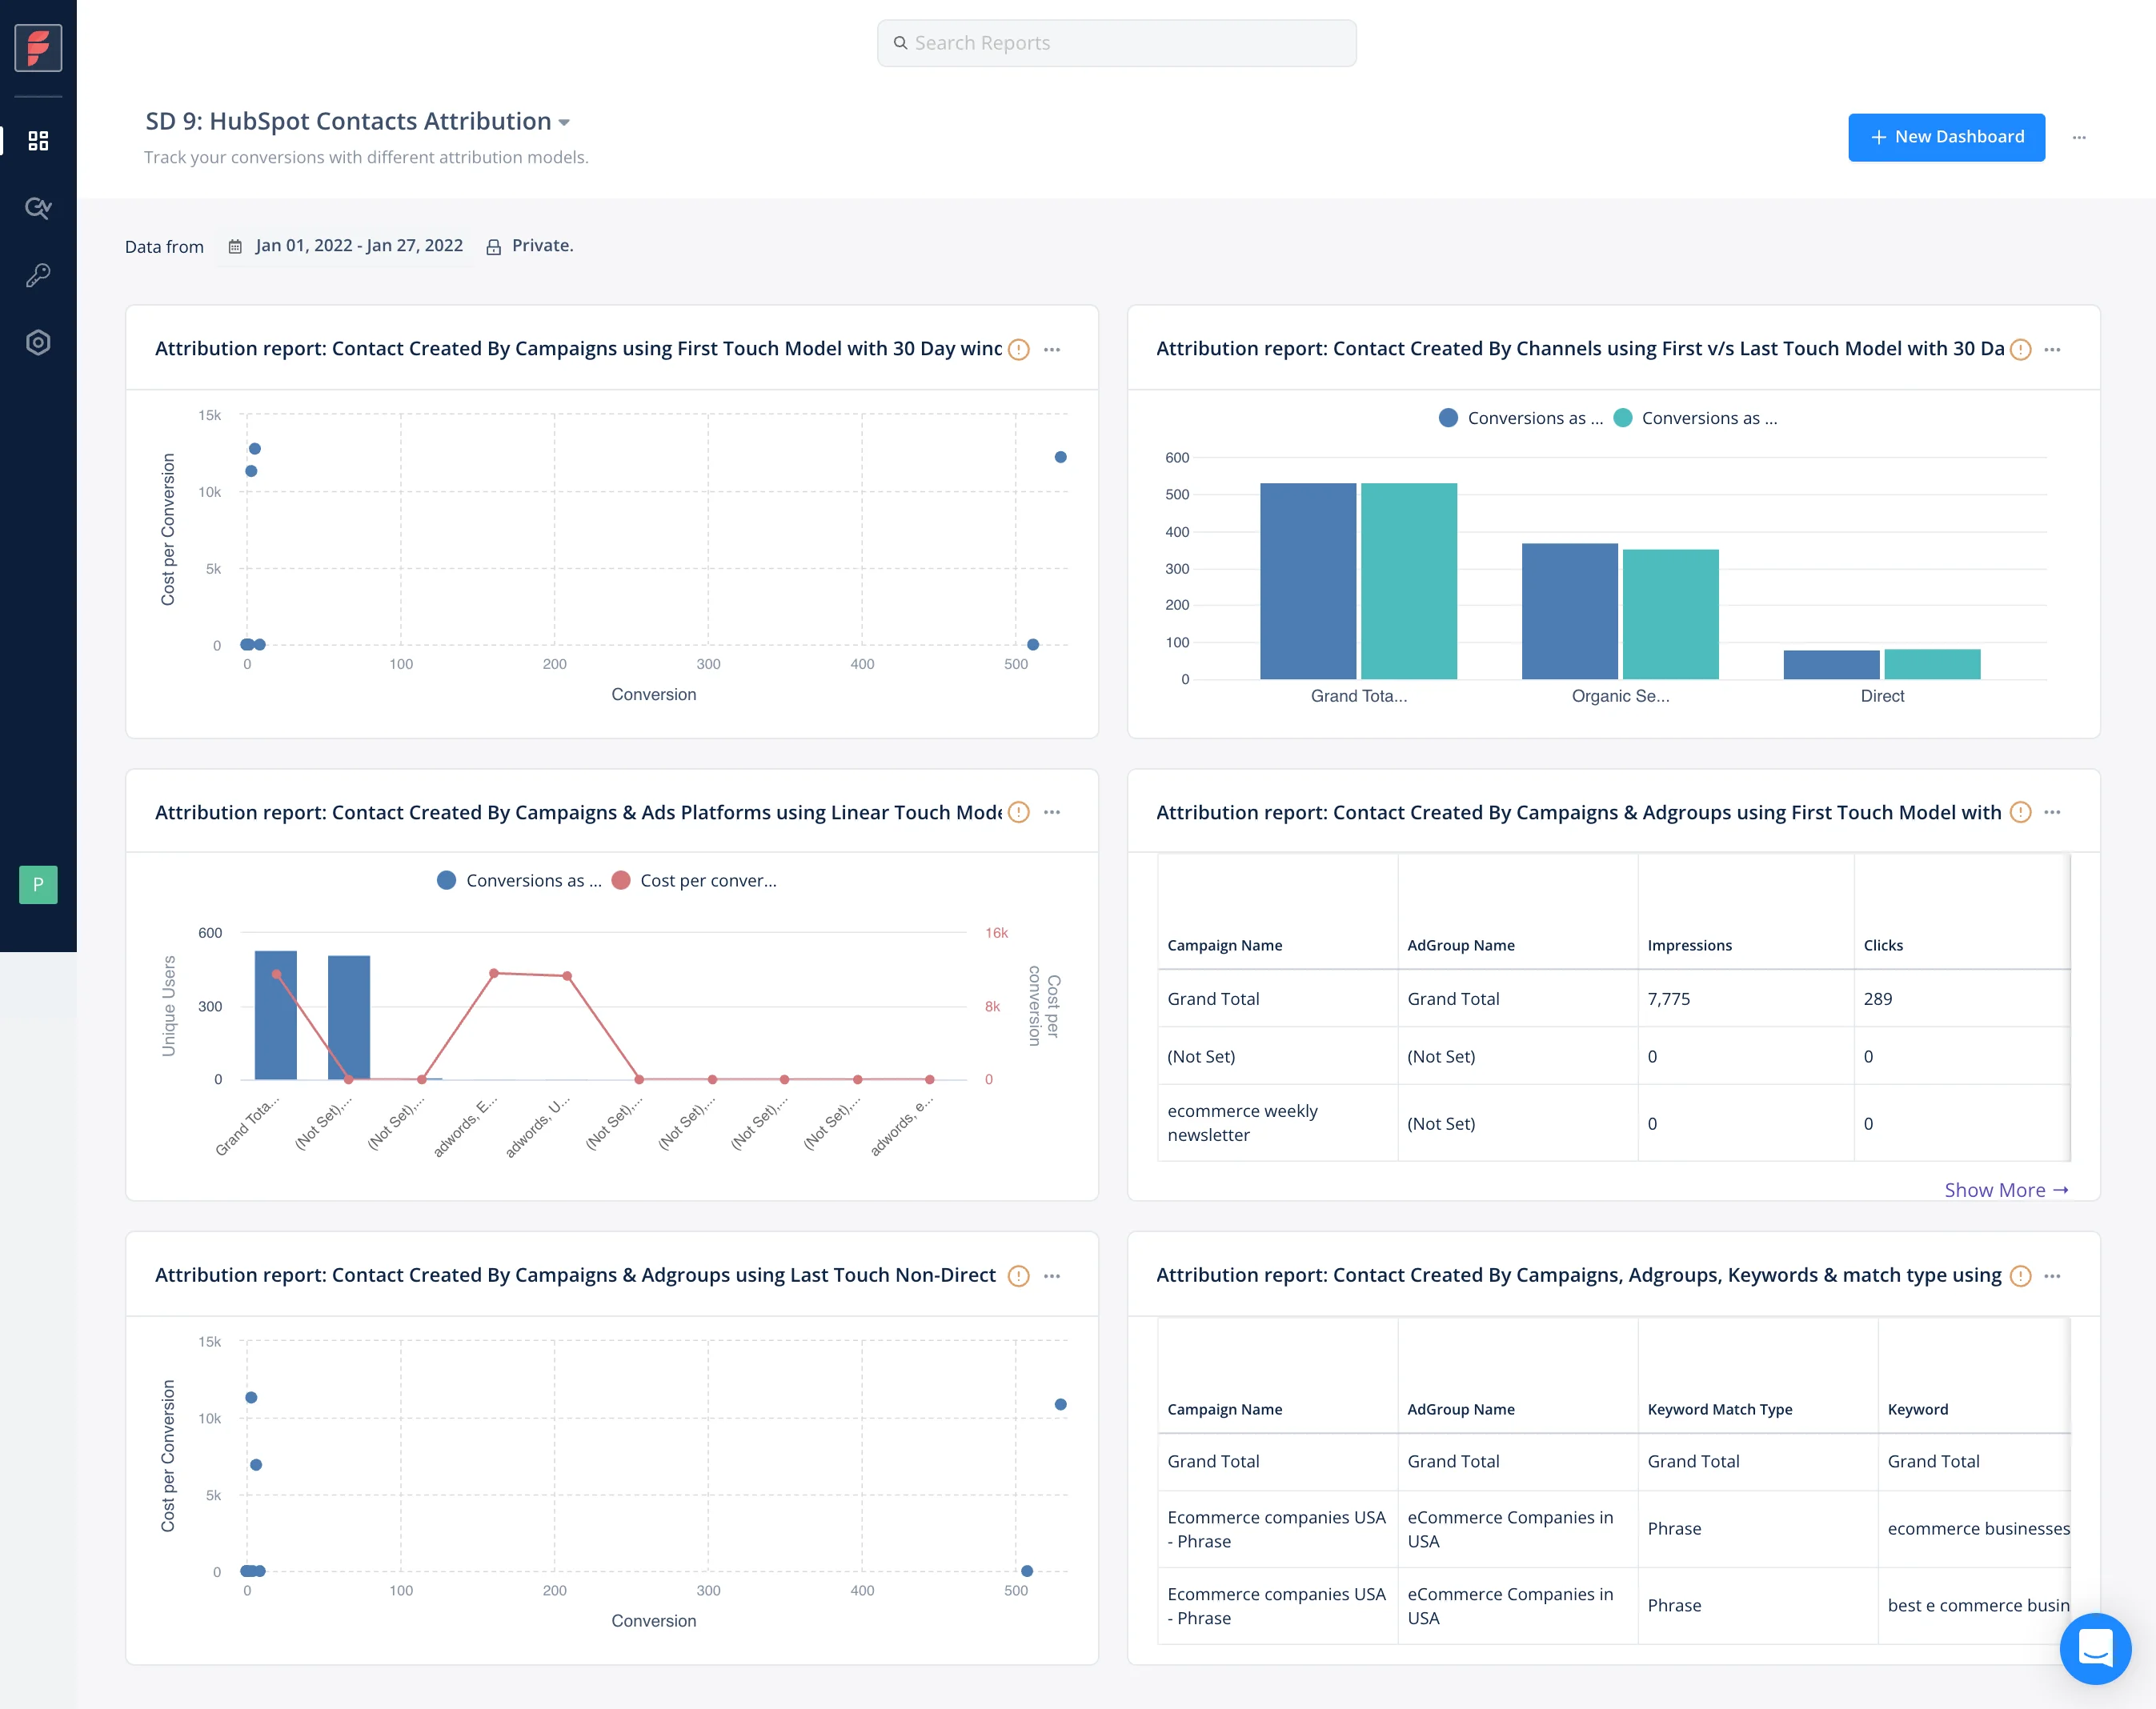
Factors.ai comes with a powerful attribution engine. With it, you can use, compare, and customize several single-touch and multi-touch attribution models. Factors attributes touch points across ad platforms, website events, and CRM. Factors also supports real-time reports and insights, a unified and customizable dashboard, and a wide range of data visualization under one roof.
Maintenance
When you build an in-house marketing analytics and attribution solution, there is a need for continual maintenance to ensure operational efficiency. Especially the maintenance of integrations across your SDK, CRM, Ads platforms, API version updates, etc.
Optimizing your SDK from an engineering perspective as mentioned before is a trial-and-error process. You will have to adjust your data pipeline to effectively deliver data to your dashboards. You’ll even have to keep your techstack up to date. Not to mention that there will always be tech debt and bugs to troubleshoot over time. This is never a one-and-done situation. As time passes you would have to modify your queries while you bring in more data all while optimizing your process.
Integrations, data concerns, troubleshooting and all of the aforementioned maintenance can be administered without developer dependency with Factors.ai.
3. INTERPRETATION
The purpose of part I is to illustrate the challenges in setting up the technical requirements for building a solution — optimizing your SDK, building a data layer and a solution that is compatible with all types of data, building a solution that can export to a data warehouse, assembling a dashboard, maintenance, etc. This way you can have a fair idea of not only what to decide on, build or buy. But also know what to look for when opting for an off-the-shelf solution.
If you were looking for a comprehensive conclusion, then look no further than part two. The next part highlights the opportunity costs for an in-house and off-the-shelf solution and takes into account the cost, time, planning, and even the technical requirements of this piece.
Build Vs. Buy for B2B Marketing Analytics (Part 2)
The following is the second half of a two-part series about the factors involved in building and buying a B2B marketing analytics and attribution solution. This post deals with the cost and time requirements for an in-house and an off-the-shelf solution. It also compares the opportunity costs of building and buying a solution.
Be sure to check out part one which talks about the need for a B2B marketing analytics and revenue attribution solution. Along with a breakdown of the technical requirements for each solution.
Costs Involved
This segment is an overview of the costs involved in building an in-house B2B marketing analytics and revenue attribution solution. While there are certainly other costs involves, we cover 5 of the most prominent ones:
· Cost of ETL
· Cost of Data Warehousing
· Cost of Data Processing
· Cost of Data Visualization
· Cost of Staff
Cost of ETL
Extract, Transform and Load (ETL). Extracting structured or unstructured data from a source — this could be data from your CRM or Google Ads. Transforming includes processes like cleaning, duplication, sorting, etc. and ensuring data integrity and compatibility. Loading involves placing all of the transformed data into a data repository or a data warehouse. The data could be either loaded completely or at predetermined intervals.
This is the cost of maintaining a data pipeline. While it is possible for your engineering team to set up a data pipeline, some companies find it cost effective to use an ETL tool. These tools include tools such as Hevo, Fivetran, Google Dataflow, Pentaho, etc.
Fivetran, foe example, lists a range of pricing tiers. The starter tier’s price (which is for a small team’s data stack or the bare minimum for an in-house solution), would depend on the number of rows you update. This will range anywhere from 2 million total rows at a monthly estimated fee of $120, to 500 million total rows at an estimated $4,628 per month.
Cost of Data Warehousing
In the previous blog we talked about the need for a data warehouse from an analytics perspective. We discussed why relying on application databases is not scalable. While you could invest in a local data warehouse, there are a multitude of benefits to investing in a cloud data warehouse. Ultimately, this will prove to be convenient when building an in-house solution. Scaling operations would be expensive as it requires more ram (and in all likelihood, a dedicated database manager). That being said, cloud-based data warehouses like Google Cloud Storage, AWS Redshift, Microsoft Azure, and Snowflake fit the bill.
Cloud data warehouse storage prices vary depending on a range of factors. Google Cloud Storage, for example, has options varying in region and class — the class of storage, standard, nearline, coldline, and archive is determined by the frequency of access to the storage. In the region of US-central Iowa, at the standard class, warehousing will run you about $0.020 per GB per month.
Cost of Data Processing
Most cloud-based data warehouse services also include processing data. This is the cost to process SQL queries, scripts, functions, and more. This is in addition to the cost of loading data that you are processing in storage. Processing data is usually handled by a database management system like Bigquery, AWS Redshift, Oracle, Singlestore, etc. These services offer Cloud database as a service.
The cost involved in the pricing of these services includes the use of vCPU, Memory and cloud storage. Singlestore, for example, on its standard plan has a starting price of $0.65 per hour and will increase depending on the number of vCPUs and memory used. A vCPU of 16 and 128GB of memory will cost you $3,796 per month.
Cost of Data Visualization
In the previous blog, we talked about the presentation of your reports to your end-user. This requires a data visualization tool. A skilled engineer could purchase data visualization libraries and build them out. But for the sake of time, a lot of businesses resort to data visualization tools like Tableau, Looker, and PowerBI.
A data visualization tool like Tableau will cost you $70 per month per license.
Cost of Staff
Staff will, by far, be your most expensive costs. To build a marketing analytics and attribution in-house solution, you would at the very least require a small team of 3 full time data engineers and 1 data scientist. You will require experts with experience across programming language and ETL. In the US, the break down is as follows: on average a data engineer’s CTC is $116,772 per annum, along with a $5,000 cash bonus and other non-cash benefits as of 2022. The average CTC of a data scientist in the US will cost $102,865 as of 2022. (Indeed.com). These costs will have to be multiplied by the number of data engineers and scientists hired.
In terms of cost an off-the-shelf solution like Factor.ai will as of this date cost you $1,188 per annum on the starter plan which includes web analytics, multi-touch attribution, funnel mapping, Metric reports and more. Their growth plan on the other hand will cost you $5,988 an AI powered “Explain feature”, automated weekly insights and a dedicated customer success manager
Time
To build a fully operational in-house B2B marketing analytics and revenue attribution solution, with a team of 3 full time data engineers and 1 data scientist will take anywhere between 9 to 12 months.
An off-the-shelf solution like Factors.ai can be set-up in minutes. It requires no professional services for onboarding either.
So...Build or Buy?
Now, we're all caught up about the resources required to build an in-house B2B marketing analytics and attribution solution, as well as what to expect from an off-the-shelf solution. So should you build or buy? This section runs through the opportunity cost of building and buying. Essentially, what are you missing out by choosing whether to build or buy.
Opportunity Cost of Building:
By choosing to build an in-house solution you forgo the benefit of:
· The cost savings earned from buying a solution
· The time saved from not having to set up an in-house solution
· No-code integrations and developer dependency
· Maintenance and innovations handled by the service
· Using an advanced SDK, and not having to optimize SDK
· Data cleansing handled by the service
· Data visualization within the same product
· Unified Dashboard
Opportunity Cost of Buying:
By purchasing an off-the-shelf solution you incur the following opportunity costs:
· Product may not fulfill very unique analytics aspects of your business
· Product may not deliver on their promises
· Certain products may not fulfill your data privacy requirements (learn more)
· If a vendor liquidates or gets acquired, you cannot ensure data ownership and continuity of business
In Conclusion…
The most important point to take away from this is that when you build an in-house solution, you would have to weigh the risk of doing so. The average tenure of a CMO is about 40 months. Would they prefer to spend the first 9 to 12 months of their tenure waiting on a solution that isn’t proven to meet their need, or have a solution that is up and running within a week for a fraction of the cost of building one?
In my opinion there is too little to gain and a lot to lose when buying. Most of the opportunity costs of buying could be avoided with modern solutions like Factors.ai. Where custom plans can be built to fulfill your business’s unique needs. A demo of the product can be requested to ensure if the product delivers on its promise. Factors.ai uses first party cookies and is GDPR, CCPA, PECR and SOC2 compliant. And Factors.ai can send their client’s data to their Bigquery instance on demand giving full data ownership to the client.
Still on the fence? Book a demo with Factors.ai now.
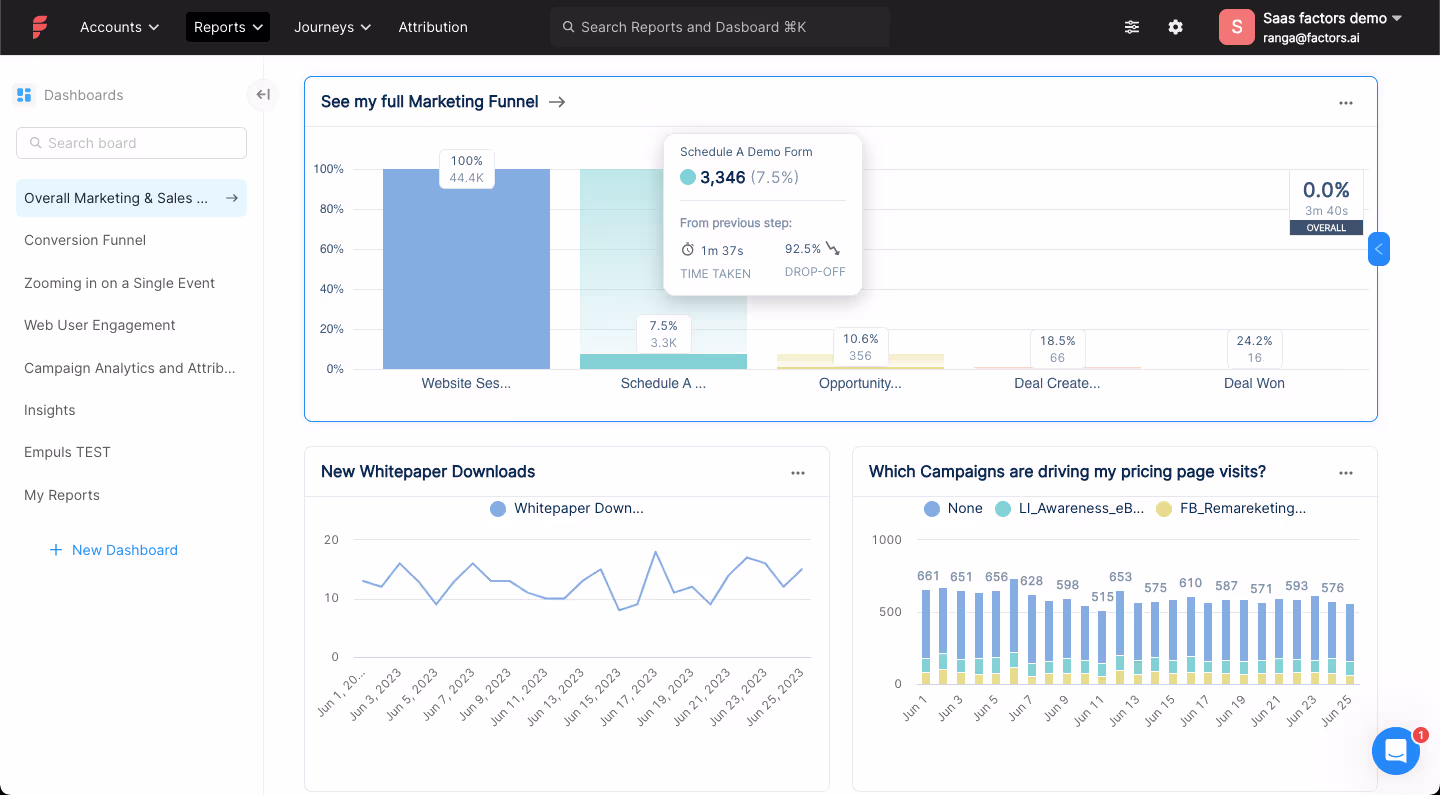
The B2B Sales Funnel Unveiled: Insights & Best Practices
Understanding the B2B Sales Funnel
When it comes to B2B marketing, qualifying your sales leads is not an easy job. Given the several steps involved in a B2B customer journey, visualizing each one as a funnel can be insightful (and actionable). It identifies what’s helping and hurting conversion rates along a prospect’s journey to becoming a customer. Which in turn, helps optimize the journey and improve conversion rates.
What is a B2B Sales Funnel?
A B2B sales funnel is a visual model that illustrates a prospect’s journey. The funnel graphically represents the proportion of prospects present in all stages. It can also represent customer engagement and break down each interaction from first-touch to deal-won. Here’s why a B2B funnel differs from a B2C funnel:
* Unlike in B2C, a B2B prospect is composed of several decision-makers who would have to greenlight an investment.
* The sales cycle in B2B is considerably longer than a B2C one. This is not only because of the layers of approval required but also the meticulous research, review, and demos, and larger contract values.
* In a B2B endeavor, customer retention and the need to build a long-term relationship with clients are critical for long term success. Hence, brand building is placed on a pedestal for B2B customer engagement.
Breaking Down the Stages of the Funnel
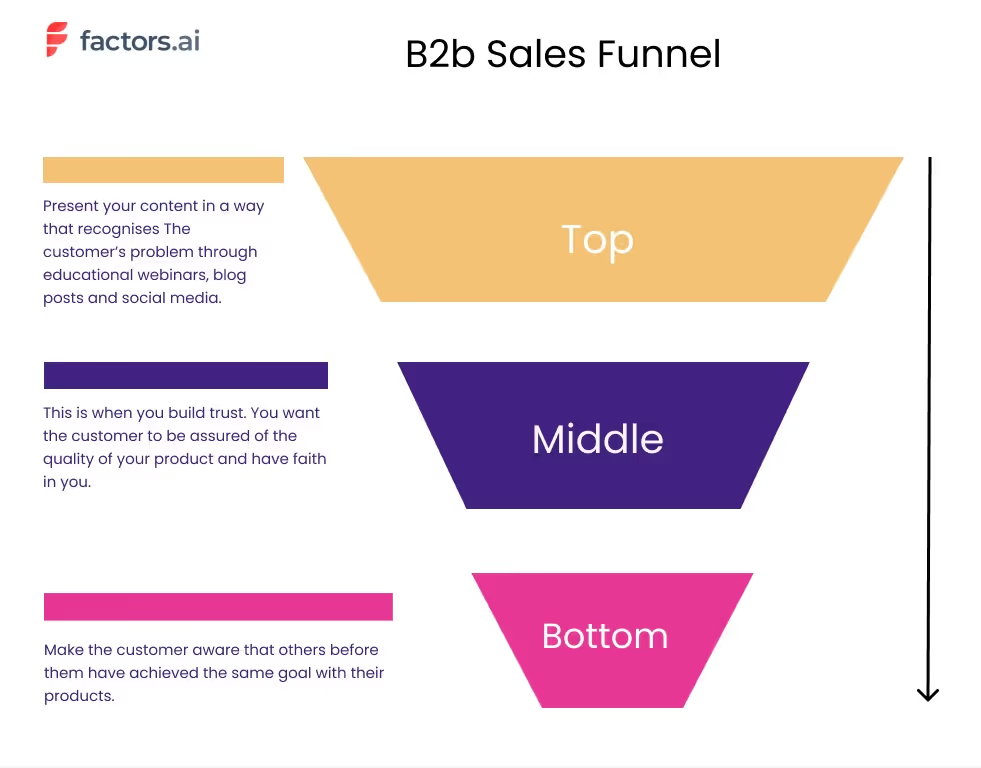
Several terms exist for the different stages of the funnels. Functionally, however, most of them are relatively synonyms. For the sake of simplicity, a B2B sales funnel can be divided into 3 levels:
1. Top of Funnel (ToFu)
2. Middle of Funnel (MoFu)
3. Bottom of Funnel (BoFu)
Picture of funnel broken in three parts; top middle bottom. On the left of the funnel write down what is buyer intent?
On the right side of the funnel; list down the marketing efforts commonly used at that stage; like top stage is content marketing and blogs.
When guiding your users through the funnel, there are several you can use to assess whether you’re doing it successfully. These metrics can help you evaluate past performance, predict future trends and optimize your current efforts. Some of these are click- through- rate, conversion, content shares and SEO metrics. Analytics software like Factors and Google Analytics can be used according to your campaign goals, content channels and campaigns.
Top of sales funnel
The top of funnel level deals with the awareness and interest stage in a prospect’s journey. The objective of this stage is to consistently bring in fresh, new traffic. At this stage, prospects may not be entirely aware of the problem you’re solving. From a B2B standpoint, this not only involves your advertising, but is heavily centered around content marketing, educational content creation, & building a strong organic presence.
B2B prospects commonly require significant nurturing before going further down the funnel. For example, a company like Salesforce revolves their content strategy around CRM among other things educating prospects on all things CRM related and more.
Common top-of-the-funnel marketing touchpoints include:
- Blogs
- Podcasts
- E-Books
- Webinars
And key top-of-the-funnel metrics to track include:
- Number of site visits
- Web session duration
- Bounce rate
- Keyword rankings
- CTR
- Mail open rate
Middle of Sales Funnel
"This level of the funnel corresponds with the engagement stage of a prospect’s journey. After creating awareness and defining the problem, prospects would now evaluate their solutions. At this stage, you would need to build your brand authority and elucidate how your solution is the superior option." - says Milosz Krasinski, Managing Director at Chilli Fruit Web Consulting.
The approach to marketing changes at this level. Here, content becomes increasingly brand-oriented and employs lead magnets or gated content to bolster your brand authority. This can also be ensured by hosting webinars, events, and live-demos. MoFu blogs also tend to be more product heavy as opposed to industry-specific.
Common middle-of-the-funnel touchpoints include:
- Comparison articles
- Retargeted ads
- Product reviews
- Trial sign-ups
Bottom of Sales Funnel
Not to be confused with the expression “being at the bottom of the barrel”. The bottom of the funnel is a crucial stage in the buyer’s journey. It’s where you would ultimately want to guide all your prospects towards. It is known as the conversion stage because at this stage prospects make a purchasing decision and possibly convert into customers.
It must be noted that bottom of funnel prospects can vary depending on your conversion goal. It could even include prospects that sign up for a demo, make an account, mail a product query, or anything that expresses high engagement with the brand or product. Based on historical trends, you could identify which conversion goal is conducive to a prospect becoming an MQL, an SAL, or an SQL.
At this level, the sales team starts to get involved. It’s the combined effort of sales and marketing that ultimately onboard customers through promotional offers and strategies. Considering the B2B sales cycle, this is still a long, arduous process. The bottom of the funnel also helps form the ideal client profile which serves in identifying target accounts with ABM (account-based marketing).
How to Guide Users through the Sales Funnel
The core objective of the funnel is to help guide potential B2B customers through the process, without spending too much or overdoing it and driving them away from making a purchase. However, once you have identified what stage your customers are at- what next? It is important to take advantage of this new information to adapt your content to target your customers better.
Along each stage of the sales funnel, content must be curated to drive up customer engagement. And the type of content that customers expect differs at different stages of the funnel. Let’s look at how buyer intent differs across the three stages of the funnel:
1. Top of the funnel: The customer has arrived at your ad because there is a problem that they are facing. Present your content in a way that recognises their problem through educational webinars, blog posts and social media.
2. Middle of the funnel: Remember that at this point, your customer is still looking for a solution. This is when you build trust through content marketing campaigns, blog posts. You want them to be assured of the quality of your product and have faith in you.
3. Bottom of the funnel: In this last stage, make them aware that others before them have achieved the same goal with their products. Use testimonials, product USPs and case studies to drive your point home.
Flipping the Funnel: An Alternate Way
Instead of using the conventional B2B funnel, Binnet and Field suggest flipping the funnel. This means to think of the funnel as ‘in market’ and ‘out market’ buyers. Instead of looking at your B2B customer journey as a funnel that has a narrower customer base at each stage, focus on different aspects like ‘activation’ or ‘branding’ at the in market and out market stages respectively. Find out more about this alternate perspective here.
In Conclusion…
The stages of a B2B marketing funnel are diverse. Each stage adopts different types of content strategy, tactics, interactions, and analytics. This makes it all the more essential to compartmentalize efforts into an organized funnel, making the process disciplined.
The funnel not only keeps track of your prospects at each level but also identifies different pain points that limit prospects from moving down the funnel. Measuring your funnel helps distinguish your leads better too, which can be quite useful given that 79% of MQL are never converted to sales.
From a B2B angle, the funnel highlights the importance of efforts like SEO, building domain authority for TOFU and long-form product heavy blogs for MOFU, etc. Given the nature of B2B prospects, all these factors contribute to the movement down the funnel.

Unlocking the Secrets of Lead Scoring Models
What do you do when you’re stuck nurturing countless leads that drive few conversions? Lead scoring has emerged as an effective solution forthis customer conversion challenge. Studies show that B2B organizations that utilize lead scoring realize a 77% increase in lead generation ROI compared to those that don't. If this piques your interest, know that scoring your leads and determining a lead scoring model is not a cut and dry process. The following post explains what lead scoring is and explores some commonly used lead scoring models.
What Is lead scoring?
Lead scoring is the procedure of quantifying the conduciveness of a lead generated by a business. To put it simply, it is used to determine if a lead is more likely to convert or not by assigning scores to the leads. By doing so, you ensure that both your marketing and sales teams are seeding the right prospects, all while getting to understand who your ideal lead is in the process.
So far, it seems simple right? Well, scoring leads is not all black and white. Figuring out your buyer persona is a multifaceted challenge. It not only requires a boatload of data but constant revisions and maintenance over time as well.
To help with that, here is how you build your lead scoring model:
Determining lead scores
First, we need to figure out the criteria for scoring, and how many points to reward or deduct for each criterion. Here are a couple of steps to establish that:
1) Picking your KPIs and Traits: The first step in lead scoring is selecting what you need to be judging. This involves the KPIs (key performance indicators) and common traits of leads that convert. An example of this would be that an important KPI is the number of views on the review page for a product. And a common trait could be a particular company size.
2) Assigning the Value: It is important to understand which traits are more significant than others — like the lead’s company size over the industry. This way you can reward certain traits higher than others. You should even determine the points to be rewarded per trait — which company size converts the most and which ones convert the least, etc. You can do this by calculating the conversion rates of the leads with different levels of the same trait and comparing them to the average. The same can be done for KPIs as well.
With all these in place, you can now determine the score for each lead attribute. Remember that you must never only rely on one attribute to score your leads. The more the merrier, as the following lead scoring models deal with a wide variety of data.
Lead scoring models
A lead scoring model is nothing but the basis of evaluation for your scoring or the system on which it is predicated. With that said here are some common lead scoring models:
1) Implicit Scoring (Activity/Engagement): Implicit scoring is used to grade leads based on their level of activity and engagement with the business, its brand and its content. It utilizes a lot of tracking data across several platforms and compared to explicit scoring it is a continual process. Here are some examples of implicit scoring:
- Number of webpage visits or leads that visited the pricing page.
- Content engagement, including views, downloads, etc.
- Email engagement, email click-through rate and bounce rate.
- Social media interactions, involving likes, comments, followers, etc.
- Leads that requested for product demos and free trials.
- Leads that attended webinars.
- Form submissions, and more
2) Explicit Scoring (Suitability): Explicit scoring is used to evaluate a lead based on their business-related profile like the lead’s company size and job title. This information is used to determine the suitability of your lead’s business profile to that of a lead that converts. Explicit scoring is more commonly used in B2B interactions, given the importance of assessing the companies they deal with. Here are some examples of explicit scoring:
- Company size, which can allude to how many decision-makers are involved in the buying decision.
- Job titles that are awarded different points depending on the level of influence.
- The company’s revenue could help identify companies that are more in line with your average contract value.
- The lead’s company industry.
- The location and other demographics of the lead.
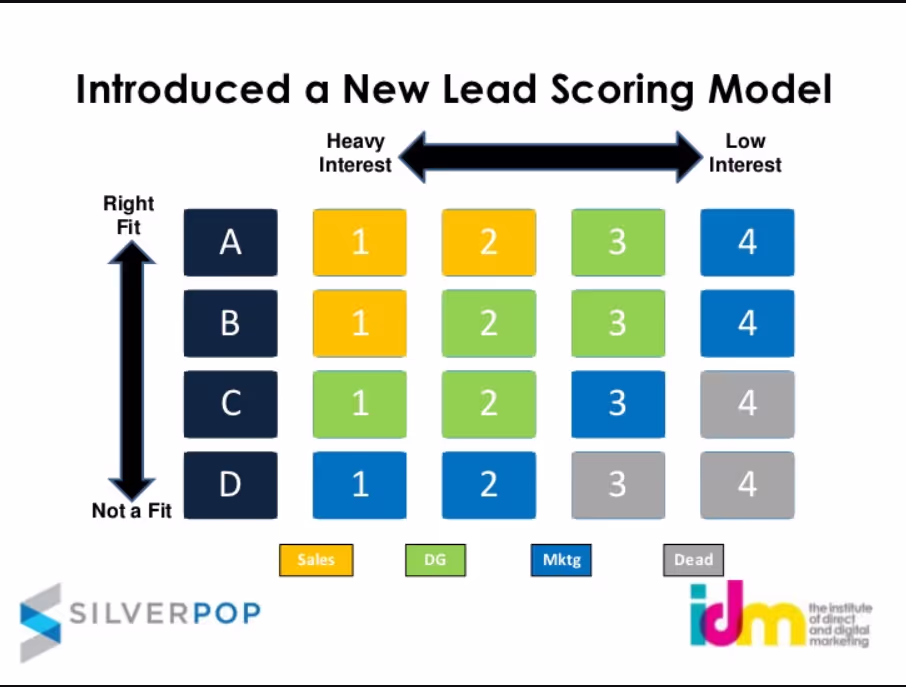
3) Matrix (Combination of Implicit and Explicit Scoring): This model is called a matrix model because it uses an incidence matrix combination of implicit and explicit scoring. This means that we evaluate a lead based on combinations of implicit and explicit traits at varying degrees. For example: A lead that is considered highly suitable based on explicit business profile traits like company size and industry can be scored poorly due to its low activity and engagement levels. The same could be said about a lead with high activity but low suitability.
The importance of both these dimensions varies based on your ideal client profile (ICP). The use of this matrix model, including models with other dimensions, are quite common in lead scoring solutions used today. Like Silverpop’s scoring system.
4) Negative Scoring: A negative scoring model implements a deduction of points to your lead scores based on unfavorable interactions and intentions. Negative scoring involves a multitude of aspects. From the low levels of activity or interest found in leads, to prospects consuming your content for all the wrong reasons. The biggest advantage of implementing this model is that it avoids inflating a lead’s score. And allows your sales team to focus more on better leads. Here are some examples of negative scoring:
- Inactive or stagnant leads that have not interacted with the business in a while.
- Leads that unsubscribe to your company newsletter.
- Rival companies researching your company.
- Visitors that consume your content with no interest in the product, but for other reasons (academic/employment)
Regardless of which model you pick, you’re more likely to adopt a combination of these models so long as it meets your scoring requirements. And as long as you fine-tune your method in conjunction with newer customer data, you can ensure that your lead scores will always stay credible.

How to do B2B account scoring
The following blog is an overview of account scoring. It goes over the basic steps in creating a scoring scheme as well as the various functions of an ICP (Ideal Client Profile). It also distinguishes account scoring from ABM (Account-Based Marketing) and assesses how lead scoring and account scoring deal with different B2B clients.
Catch our previous piece on lead scoring models explained here!
What is account scoring, and how is it different from account based marketing?
You might have heard that account scoring is somewhat analogous to ABM (Account-Based Marketing). This isn’t far from the truth. Think of account scoring more as a means to improving ABM. In that sense, they are consubstantial. ABM is a broader approach to marketing that targets key accounts or accounts that are most likely to convert and generate the most revenue. This is based on using an ICP (Ideal Client Profiles) which states the attributes of those target accounts. ABM also deals with compartmentalizing those key accounts, designing the method of engagement, and collaborating with other departments.
Meanwhile, account scoring is a method of ranking and sorting your target accounts based on a scoring scheme. Just like in ABM, account scoring uses an ICP as a filter to identify your target accounts. By scoring your target accounts you can better ascertain the value of organizations, on which you can expend your limited resources on. Account scoring is comprehensive with its scoring schemes by prioritizing unique attributes of target accounts.
Steps to create account scoring:
1) Ideal Client Profile: Your ICP in account scoring has two functions. The first is to use your ICP to make target accounts or rather filter out a range of target accounts before scoring them. The second function of ICP acts like an explicit scoring model as in lead scoring. This means using your ICP as a benchmark while scoring organizational traits, like the size of the company, ACV, location, etc. This becomes an inevitable part of your scoring scheme.
2) Creating a Scoring Scheme: A scoring scheme is nothing but the basis of assigning a score to a target account. As mentioned in the previous step, your ICP has the role of designing your explicit scoring. With that sorted, you can establish some implicit scoring criteria. Such as rewarding points based on email engagement, content download, and web analytics. For example, an organization visiting a review page could earn 3 points, while traffic generated through PPC could earn 7 points. The value of certain touch points and engagements can be determined by using a revenue attribution tool.
3) Customisation: A scoring scheme is never linear. All elements within a scheme might not apply to every organization. Different organizations and stakeholders might have different uses for your services and different valuations for their touch points. Hence, it is important to measure the relative impact of the scoring scheme on your target accounts. It is also crucial to revise your ICP, rearrange their permutations, create several ICPs, and compare them.
Account scoring vs lead scoring
One could argue that both these scoring methods are somewhat similar. Both their scoring models have an implicit and explicit element to them. So, is it just a matter of what they’re called? The most important distinction here is that account scoring deals with organizations while lead scoring deals with individual leads.
Account scoring views a client as an organization with several decision makers involved. While lead scoring is better suited for dealing with a single decision maker. This is why lead scoring is the better choice for clients with a lower ACV, this implies a low level of decision making involved, with only one or few decision makers. And because of its individualistic nature, lead scoring has a stronger emphasis on engagement.
Account scoring on the other hand is better suited for high ACV organizations with more decision makers. This necessitates the need to create key accounts for an organization rather than scrutinizing an individual lead. It also works better with ABM and account-based engagements. The use of ICP has more prominence in organizations and takes the number of stakeholders and ACV into account.

