

A Comprehensive Guide to Marketing Attribution
Ever poured budget into campaigns, only to wonder which one drove results? For B2B marketers, this isn’t just a frustration but a roadblock to smarter decisions. With long sales cycles, multiple stakeholders, and countless touchpoints, it’s tough to know what’s really working. That’s where marketing attribution earns its place.
According to a study by Gartner, B2B buyers spent only 17% of their time meeting with potential suppliers and merely 5-6% of the entire time with the sales representative of each vendor. This means that the sellers have little opportunity to influence the buyer's decisions.
Buying decisions in B2B typically involve six or more individuals. And they prefer to do their own research instead of relying on the vendor's sales team. Their research includes industry publications, blogs, case studies, pricing, and customer reviews put out by the vendors. They often engage back and forth, moving from your website to your competitors. They take their time, compare, and decide on the best choice.
Hence, the interaction with the sales rep usually happens late in the buyer's journey. Marketing hence plays a much larger role in influencing the buying group's decision.
The back-and-forth engagement also results in multiple touchpoints across many channels. And by using marketing attribution models, a marketer can determine which touchpoints contribute to the conversion.
Many B2B marketing attribution software has emerged in recent years. But the big question is, how can these help? Why is it important for marketers? And which models should your marketing team be using?
This guide will explore the details of B2B marketing attribution. It will give you the knowledge and tools to handle this complex area. Whether you're new to this or want to improve your current strategies, learning about marketing attribution is key for any B2B marketer who wants to grow and succeed. Let’s get started!
TL;DR
What is Marketing Attribution?
Marketing attribution determines what marketing actions help a business reach its goals, like getting leads or growing revenue.
Suppose you're a marketing manager for a software firm. Your goal is to get more leads and earn more revenue.
To do this, you use various marketing channels such as Google search, organic search, LinkedIn ads, and so on. Meanwhile, the sales team contacts potential customers through emails and calls.
However, it can be challenging to know which channels work best and which need improvement. This is where marketing attribution comes in.
Attribution software acts like a GPS for your marketing efforts, helping you track the performance of every channel and campaign.
For instance, say your LinkedIn ads get the most leads, but your webinars don't perform as well. You can see this with the help of attribution software and change your strategy. Instead of putting more investment into an ineffective channel, you can focus on the channels that bring in leads and revenue.
Attribution shows which channels, messages, and interactions influenced a lead, moved them down the funnel, or closed the deal. The main goal of attribution is not to prove the marketing team's value but to help the team improve their efforts and get better results.
What's the difference between marketing attribution, revenue attribution, and digital marketing attribution?
When it comes to attribution, chances are you've come across a whole range of terms—namely, the following three.
- Marketing attribution
- Revenue attribution
- Digital attribution
Well, be relieved to know that all these terms virtually mean the same things. They simply differ in terms of context.
Marketing attribution refers to the process where you can quantify the influence of your channels on business metrics such as meetings, pipeline, and revenue.
Revenue attribution is identical in essence but has a slightly different perspective. Here, the focus is more on assigning value to channels to estimate their revenue impact.
And finally, digital marketing attribution is centered around attributing digital touchpoints. It exclusively focuses on the digital customer journey.
Why is marketing attribution important (and useful)?
Have you ever heard the saying, "you can't manage what you can't measure"? Well, that's exactly what marketing attribution is all about.
Imagine a company, ABC, that sells enterprise software solutions to other businesses. The company has a sales team, a digital marketing team, and a trade show presence to generate leads and close deals. The sales team receives leads from a variety of sources, including:
- The company's website through a contact form
- A trade show where the company had a booth
- An email campaign sent to target prospects
- A referral from a satisfied customer
In this scenario, it's important for ABC to understand which campaigns are driving the most conversions. This way, they can allocate their budget and resources more effectively.
For example, let's say the company's sales team closed a deal with a lead that came from the trade show. It's difficult to determine whether the trade show was solely responsible for the conversion or if other marketing efforts also played a role. This is where B2B marketing attribution comes into play.
With marketing attribution, ABC can identify the marketing touchpoints that drove most conversions. This further allows the company to see which marketing channels are the most effective in driving sales.
The tool helps the company to measure and attribute the success of your campaign and optimize and improve your strategies.
What are the functional benefits of marketing attribution?

1. Marketing ROI Optimization
With marketing attribution, B2B teams achieve a better and broader picture of each channel's cost-to-revenue ratio or ROI.
By understanding every channel's influence on lead conversion, pipeline, and revenue in relation to their cost, you can effectively quantify marketing performance. Ultimately, this leads to our next point — prudent marketing investment and spending.
2. Improved Marketing Spends
Using marketing attribution can make a significant impact on your marketing investment. This is because it provides crucial information about the performance of different marketing channels and tactics. Armed with this information, you can optimize your spending to achieve the end business objectives. Instead of distributing your investments evenly, you can double down on the channels that are actually performing better.
Consider this example. Imagine you have $10,000 to spend on a marketing campaign. Without attribution, you might split the money evenly between different channels. But with attribution, you might find that Linkedin conversational ads work best and are responsible for 80% of your conversions. So, in this case, you could put 80% of your budget towards Linkedin conversational ads and the rest towards other channels.
In short, marketing attribution helps you make decisions based on data instead of guessing. By knowing what's working, you can spend your money in the best way possible and get the biggest return on your investment.
3. Attribution and Content Marketing
Content marketing remains the best way to communicate effectively with customers and educate them about your offerings. And with the help of marketing attribution, you can take content marketing to the next level.
How?
Your content should engage with the target audience and drive demand for your products/services at every stage of the buying journey. For that, you need to create content that's tailored to your Ideal Customer Profile (ICP).
Marketing attribution plays a crucial role in this process. It provides insight into which content resonates with your audience and leads to more conversions. Traditional CRM and MAP systems credit conversions to content only by a First Touch model (if the content was the first interaction the prospect had), which can be very misleading.
You can also track how different pieces of content contribute to your pipeline and revenue. This allows you to optimize your content strategy.
For example, you may find that a particular blog post is driving a lot of traffic to your website but is not resulting in any conversions. In this case, you can analyze why this is happening and make changes to the content to increase its effectiveness.
Keep reading to learn more about the ROI of B2B content.
4. Mapping Out The Customer Journey
The use of attribution isn't limited to understanding channel influence on conversion. It's also a powerful tool to make sense of marketing's impact across each step of the funnel.
You can use it to identify the relationship between channel interactions, which touchpoints work together, and their relative probability of occurrence down the funnel. All of which help you map out your buyer's typical journey.
Marketing attribution models
Attribution models allow you to understand the different touchpoints in the customer journey and how each of them influenced your prospect to convert. The main goal of attribution models is to help marketers determine their campaigns' performance
For example, consider the following.
A customer reached your website through a LinkedIn ad. Then, the customer further engages with your website content, like blogs and case studies, before becoming a lead. And finally, they are converted (booked a demo) after clicking on a retargeting ad.
Now, depending on your business goals, the attribution model you choose assigns credit to different touchpoints.
If your objective were to create awareness of your brand or product, the credit would be assigned to the first touchpoint. In this case, the LinkedIn ad. But if you were looking at conversion alone, the credit will be given to the last touchpoint, which is the retargeting ads.
There are other scenarios too, where you assign credit to multiple touchpoints. But as we said, it depends on your business objective.
With that said, there are mainly two types of attribution models.
- Single touch models
- Multi-touch model
Types of attribution models
Single-touch
As the name indicates, allocate the credit to a single touchpoint. Some types of single-touch attribution models are;
- First touch
- Last touch
- Last non-direct touch
.webp)
These types of attribution models are used mainly by businesses with a clear and straightforward marketing funnel and want to track the impact of specific touchpoints on conversion
Multi-touch
Again, as the name implies, multi-touch models allocate credit to multiple touchpoints in the customer journey. The main focus of this model is to give a more accurate picture of your marketing channels' impact on conversion.
Some of the types of multi-touch attribution models are:
- Linear attribution model
- Time-decay attribution model
- U-shaped attribution model
- W-shaped attribution model

Here, take a look at our take on the seven types of attribution models with examples that can help you understand the attribution models better.
So, how to choose the suitable model for your business?
Choosing the right model for your business can be a challenge. As the saying goes, ‘all models are wrong, but some models are useful. But it's essential to select the one that helps you answer the specific questions you have in mind.
With that said, let's look into the factors that affect choosing the model and how to select the right one for your business.
Some factors that affect the choice of attribution model are as follows.
- The nature of the buyer journey cycle - This includes the length of the sales cycle and the number of decision-makers.
- The nature of the product. Does the product belong to an established category or a new one?
Here are seven steps to help you choose the right attribution model:
- The first and foremost thing to do is to understand your business goal. Ask yourself, "What do I want to achieve with attribution modeling?". The answer can help you select a model that aligns with your business goals.
- Speak with your customer to understand their customer journey and the touchpoints involved. Anecdotal assessments of how each touchpoint contributed to conversion can help you select an appropriate model.
- Evaluate different attribution models. Compare the strengths and weaknesses of each model and see how they align with your business goals.
- Do A/B testing. Test each model and compare the results. This will give you a better understanding of the model that will work best for you.
- Some attribution models require more data than others. So, consider the data you have and select the model that aligns with the data you have.
- Constantly review and adjust the models. It's crucial to ensure that your model is relevant and accurate. So, as your business grows and evolves, you should review the current one and make the necessary changes.
- Evangelize the results of the selected attribution model and get buy-in from relevant teams - field marketing, digital marketing, and sales so that all equally accept the results from the model you select.
Common challenges with marketing attribution
Whilst the benefits of attribution analysis are clear and unquestionable, there are certain challenges and limitations which need to be highlighted. We will briefly discuss a few B2B attribution challenges here. You can follow up on the link to learn more about the B2B attribution challenges and how to overcome them.

Complex customer journey:
B2B customers often go through a lengthy and intricate buying process. There is usually a group of 4-6 people researching and deciding between vendors before moving to purchase. Not to mention the multiple touchpoints across many channels that influence decision-making.
Marketers can't determine which touchpoints are affecting the sales pipeline and revenue without proper attribution. This makes it hard to track the success of their campaigns and make improvements.
However, attribution makes it easier to see all the touchpoints, even if the customer journey is complex. Also, when choosing an attribution software, ensure that it includes the deanonymization feature. This can help track the entire journey of all the buying committee members, even if they browse anonymously.
Longer sales cycle:
B2B purchases require a significant investment. Hence the decision-making process is more rigorous and complex than B2C sales. On top of that, there are contractual agreements, regulations, and budget approvals that further add up the time.
According to Klipfolio, around 75% of B2B companies take an average of 4 months to onboard a new customer. And depending on your sales process, the time can be longer or shorter.
Because the B2B sales cycle is complex and lengthy, it can be difficult to find out which touchpoints influenced the prospect to convert. Moreover, it can take months or years to see the results of your marketing activities. Thus, making it harder to attribute the conversion to a specific campaign.
By using multi-touch attribution models, marketers can understand the impact of their campaigns. This would help them prioritize marketing investments and create a more engaging customer experience.
Multiple touchpoints:
Customers often interact with your company through multiple channels before purchasing. These can be both online and offline interactions. Also, a customer can engage with your company at different stages of the buying journey.
For example, a customer may receive an email about a product. They then visit the company's website for more information, only to later attend a trade show and have a follow-up conversation with a sales representative. Each touchpoint could have a different impact on their decision-making process.
But, determining which touchpoints had the most significant impact can be difficult. One solution is to use an attribution tool that can track all these diverse channels and bring all the interactions together in one place.
Tracking and defining offline touchpoints:
In a B2B sales process, the customer engages with the vendors through both online and offline touchpoints. This makes it difficult to track and attribute conversions accurately, as you now need to stitch data across systems..
For example: consider a set of B2B customers. They attended a trade show and got on a call with your sales team. Afterward, they sign up on your website and complete the purchase. Here, it will be hard to determine credit for a touchpoint if you don't have the right attribution solution.
Marketing analytics software, like Factors, enables tracking of both online and offline touchpoints. Factors has a click-and-select UI through which the offline touchpoints can be set up from your CRM / MAP platform. This ensures that you have a detailed view of the customer journey.
Sales-Marketing alignment:
Alignment between Marketing and Sales teams is essential to maximize returns. However, this is easier said than done. In many B2B companies, there's a lack of communication between the two teams, making it hard to reach potential customers. Fighting for credit can be a reason for this disconnect, as each team believes their efforts to be the reason for closing a deal.
Bridging this alignment divide can be achieved in two ways.
- Emphasize that both teams are not independent but part of a larger go-to-market function.
- Unify the customer journey data across marketing and sales touchpoints.
Sophisticated Marketing Attribution solutions such as Factors can help here by providing a clear and consistent view of the customer journey. On top of the unified data foundation, teams can get answers to questions such as
- How many touchpoints did it take to convert a deal? How many of these were sales vs. marketing touchpoints?
- Were marketing efforts able to drive engagement with the right stakeholders in these accounts?
- When is the right time for sales teams to intervene so as to convert an account?
Furthermore, each team can review and analyze the attribution data to understand which of their strategies are working and which are not. From a sales perspective, such analysis can help in defining the frequency and content of email sequences, calls, and meetings that lead to maximum impact.
Why should CMOs consider marketing attribution?
As a CMO, you are often asked to achieve better results with limited resources. Meanwhile, the buyer's journey has become complex, with more channels, stakeholders, and a longer buying cycle. Attribution Software can be a valuable guide, helping you in the following ways.
Better decision-making
By understanding the customer journey, you can determine the channels to focus on and how to allocate your limited budget.
Improved ROI
Attribution lets you know which channels effectively drive conversions. Therefore, it allows you to allocate expenditures accordingly and generate better results.
Increased accountability
You can unambiguously measure and track your marketing effort's impact. Good or bad, you can hold yourself and your team accountable for the results while continuously finding ways to improve.
Enhanced customer understanding
You can gain a deep understanding of customer behavior and interactions with marketing and sales initiatives. You can know what types of content your customers are seeking, the landing pages they interact with, and more. This enables you to optimize future campaigns to align with the customer's interests.
You can read more about the importance of marketing attribution for CMOs here.
How to Build a B2B Marketing Attribution Model?
Here’s how to build a strong attribution model that delivers actionable insights:
Step 1: Audit Your Existing Marketing Ecosystem
Start by identifying all current marketing channels and touchpoints. From ad impressions and content downloads to email interactions and sales calls, every engagement should be tracked. This initial audit helps uncover gaps in tracking and ensures you’re capturing the complete customer journey.
Step 2: Define Clear Business Objectives
Your attribution model should align with specific goals, whether that’s improving lead quality, shortening the sales cycle, or boosting customer lifetime value. Defining these goals upfront helps you choose the right model and metrics to measure success.
Step 3: Map the Complete Customer Journey
Carefully map each stage of the journey: awareness, consideration, evaluation, and decision. Assign touchpoints to each stage and evaluate their potential influence. Consider using lead scoring systems to highlight which touchpoints contribute most to sales-ready leads.
Step 4: Select the Right Attribution Model
Based on your sales cycle complexity and goals, choose an attribution model that fits. For example:
- First-Touch Attribution can help identify effective top-of-funnel channels.
- W-Shaped or Full-Path Attribution is better suited for tracking engagement across long B2B buying cycles.
- Custom or Data-Driven Models offer flexibility and accuracy for organizations with mature data operations.
Step 5: Leverage the Right Attribution Tools
Use analytics and attribution tools that integrate easily with your CRM, marketing automation, and ad platforms. Tools like HubSpot, Marketo, and Google Analytics (alongside more advanced tools like Factors.ai or Wicked Reports) help track user interactions across multiple platforms.
Step 6: Integrate with Your CRM and Sales Stack
Connect your attribution system with your CRM (like Salesforce or HubSpot) to unify marketing and sales data. This centralization ensures teams are working from the same insights, which improves alignment and leads to handoff efficiency.
Step 7: Customize Reporting and Optimize Over Time
Build dashboards that focus on the KPIs that matter to your business, such as cost per lead, deal velocity, campaign ROI, etc. Attribution is not static: regularly analyze performance, identify patterns, and adjust strategies to stay aligned with changing market dynamics and buyer behavior.
Pro Tip: Start with a simpler model and gradually evolve toward more advanced approaches as your data maturity grows.
By following these steps, you can create an attribution model that improves marketing results.
Key Touchpoints in the B2B Customer Journey
In B2B marketing, understanding and optimizing the key touchpoints throughout the customer journey is essential for driving qualified leads and closing deals. Each touchpoint represents a critical moment of interaction that influences a buyer's path toward becoming a customer. Here's a closer look at the four most important touchpoints in the B2B journey:
1. First Engagement
This is where the journey begins. The first engagement typically happens when a potential buyer interacts with your brand through a blog post, social media ad, webinar invite, or a piece of gated content. This stage is crucial for creating awareness and positioning your brand as a valuable solution to the buyer’s problems. The goal here is to capture interest and drive the user to learn more.
2. Last Marketing Interaction Before Lead Capture
This touchpoint occurs just before a prospect converts into a known lead, often when they fill out a form, request a demo, or download a whitepaper. Identifying this moment helps marketers understand which final nudge (campaign, CTA, content piece) was most effective in prompting conversion. It’s an indicator of what messaging and channels are best at turning interest into action.
3. Opportunity Creation
At this stage, the lead transitions from a Marketing Qualified Lead (MQL) to a Sales Qualified Lead (SQL). It’s the point where marketing hands the lead off to the sales team, often based on engagement metrics, firmographic fit, or behavioral triggers. This handoff is critical: aligning attribution around this milestone helps validate which marketing efforts truly generate sales-ready opportunities.
4. Closed (Won or Lost)
The journey's final and most definitive touchpoint is when a deal is closed. Whether the opportunity results in a win or a loss, this stage reveals which interactions had the most impact on influencing the purchase decision. Attribution here allows you to analyze which marketing strategies contributed to revenue and what might need improvement for future deals.
By tracking and analyzing these key touchpoints, B2B marketers can optimize each stage of the funnel, better allocate budgets, and align more closely with sales teams. This leads to smarter campaigns, higher-quality leads, and ultimately, improved ROI.
Best Practices for Implementing Marketing Attribution
To implement marketing attribution well, follow a clear plan.
1. Centralize Your Data Sources
Start by unifying marketing and sales data into a single system. This ensures consistent tracking across all channels and touchpoints. A centralized data hub often built around a CRM like HubSpot or Salesforce reduces fragmentation, eliminates data silos, and enables deeper insights into the customer journey. Integration with marketing automation tools, ad platforms, and website analytics is also essential.
2. Choose the Right Attribution Model
Select an attribution model that reflects your sales cycle, buyer behavior, and strategic goals. In B2B, where decisions involve multiple stakeholders and longer timeframes, multi-touch attribution models (e.g., Linear, W-Shaped, or Full Path) usually provide the most balanced view. However, start simple if you're new to attribution and evolve your model as your capabilities grow.
3. Continuously Test and Refine
Attribution isn’t a “set it and forget it” system. Buyer journeys shift with new market trends, technologies, and buyer expectations. Regularly review and refine your attribution models to ensure they reflect real user behavior. Use A/B testing, conversion tracking audits, and periodic performance analysis to fine-tune your approach.
4. Foster Cross-Department Collaboration
Effective attribution depends on input from multiple teams. Align marketing, sales, revenue operations, and customer success around shared metrics and definitions of success (e.g., what qualifies as a lead, opportunity, or conversion). This collaboration leads to more accurate attribution reporting and more cohesive strategies across the funnel.
5. Ensure Privacy Compliance
With evolving data privacy regulations (like GDPR, CCPA, and others), it’s crucial to use attribution tools that respect user privacy. Prioritize platforms that offer privacy-friendly tracking (like server-side tagging, consent-based data collection, and anonymized tracking) to stay compliant while still gathering actionable data. This builds trust and protects your brand reputation.
How to choose the right marketing attribution tool?
Choosing a marketing attribution tool requires careful consideration of several factors. Some of the key considerations are
- Data Integration: Ensure the tool integrates easily with your existing data sources. This includes your CRM, marketing automation platform, web analytics, CDPsand advertising platforms.
- User-friendly interface: Make sure the tool is easy to set up, track campaigns, and analyze results.
- Model flexibility: Choose the tool that offers a range of attribution models. This way, you can choose the most appropriate one aligning with your business goals.
- Reporting and analysis: Check whether the tool provides robust reporting and analysis capabilities. This is important for you to understand the impact of your campaigns on lead generation and conversion.
- Customer support: Check the quality of the customer support offered by the vendor. It's best to choose the one who provides good technical support and training.
- Security: Ensure the tool has robust security measures to protect your data.
- Cost: Consider the cost of the tool in relation to the value it can deliver to your business.
Ultimately, the right attribution tool for your business will depend on your specific needs and goals. Consider your budget, the data you want to track, and the level of analysis you need.
Factors is one of the leading marketing analytics and attribution tools purpose-built for the B2B segment. It can help businesses make data-driven decisions by accurately attributing conversions to the most influential touchpoints. Some of the highlights of Factors include
- Enables attribution of offline touchpoints such as webinars, field events, and so on.
- You can visualize the customer journey at an Account and User Level.
- Easily integrates with tools like HubSpot, Salesforce, Marketo, 6sense, Segment, and Rudderstack
- Supports Account Level Analytics and Attribution natively
- You can compare attribution models and select the one most aligned with your business objectives
- Provides an extensive set of filters and breakdowns to create rapid, relevant ad hoc reports in seconds.
- AI-fueled insights into performance, anomalies, and fluctuations.
If you’re looking for a marketing analytics tool that facilitates all your attribution needs, look no further than Factors.ai. Sign up for free to learn more about Factors, or book a personalized demo today!

Top 9 Types of Attribution Models for You to Try in 2025
Think about spending a lot on marketing but not knowing which efforts actually lead to sales. Many marketers face this problem when trying to improve strategies and justify spending. Marketing attribution models can help. They show the journey from first contact to final sale, highlighting the role of each step.
Attribution modeling is a key approach to measuring marketing performance, especially in the complex, long sales cycles typical of B2B contexts. It provides a framework for assigning credit to various interactions throughout the customer journey, helping businesses identify which touchpoints contribute most to conversions. While no attribution model is perfect, each offers different levels of usefulness depending on the context. In B2B marketing, where customer interactions are numerous and extended over time, the right attribution model offers invaluable insights into which channels drive sign-ups and what content influences conversions, allowing businesses to better understand and optimize their marketing strategies.
Today, customers connect with brands in many ways, using different platforms and devices. Knowing their journey is more important than ever. Marketing attribution models give you a clear way to examine this journey. They help you spot key steps and adjust your strategies.
This guide will cover the top 9 marketing attribution models. Each one has its own strengths and uses. By learning about them, you can pick the one that fits your business goals and customer journey. Whether you are experienced or new to marketing, understanding these models is vital for boosting ROI and growing your business.
TL;DR
Attribution modeling evaluates how different marketing touchpoints contribute to conversions. In B2B with long sales cycles, this can be complex, and while all models have limitations, they offer valuable insights. Single-touch models like First-Touch and Last-Touch give full credit to one interaction, while Multi-Touch models distribute credit across multiple touchpoints. Time-Decay models emphasize recent interactions and Influence Attribution credits, all touchpoints that impacted the deal. Choose a model based on your sales cycle, business needs, and desired insights.
How Attribution Models Benefit Your B2B Marketing?
Here’s how your business benefits from using marketing attribution models:
1. Smarter Budget Allocation: Identify high-performing touchpoints and channels to invest your marketing budget where it matters most.
2. Deeper Customer Journey Insights: Understand how customers engage across different channels and which interactions influence their decisions.
3. Personalized Marketing: Use insights from attribution data to tailor messages, improve the customer experience, and build stronger brand loyalty.
4. Data-Driven Decision Making: Evaluate the effectiveness of each channel to optimize current campaigns and plan future strategies more effectively.
5. Improved Team Collaboration: Align marketing and sales with a shared view of customer interactions, helping both teams work toward common goals.
6. Increased ROI and Efficiency: Focus on strategies that drive results, reduce waste, and improve overall marketing performance.
In summary, marketing attribution models are vital tools for businesses aiming to refine their marketing strategies and achieve lasting success.
What are attribution models?
Attribution models are frameworks that help analyze the customer journey and assign credit to the various touchpoints prior to the conversion. The method for assigning the credit is different for each attribution model depending on either the position of the touchpoint in the customer journey or a data-driven estimation of the significance of that touchpoint.
Additionally, businesses may need to configure these attribution models to suit their unique circumstances - such as considering an attribution window of, say, 60 days or 365 days depending on their sales cycle or performing the attribution analysis at a contact or opportunity, or account level depending on their sales motion.
With the help of these models, marketers are able to identify channels and tactics that drive more conversions and revenue, driving higher ROI for the business.
The following are some of the main reasons why attribution modeling is important.
- They provide insight into channels and campaigns that drive conversions and revenue
- They help plan and distribute spending to the right marketing channels
- Also, they help us identify the most influential channels and campaigns for each stage of the marketing and sales funnel.
There are different types of attribution model available for marketers, and we will dive into each in the coming sections.
Categories of Attribution Models
Before delving into how some of the most popular attribution models work, it’s worth understanding the mechanics of attribution modeling. A general categorization of attribution models would include two types. They are -
- Rule-based attribution models
- Data-driven attribution models.
1. Rule-based attribution models
These models use predetermined rules for assigning attribution credits to touchpoints. These pre-defined rules determine the weightage or credit for a touchpoint primarily based on its position in the customer journey. Hence, these models are also called Position based Attribution Models.
In addition to the position, you can also define custom logic to assign differential weights based on the seniority of the customer representative involved in the touchpoint (say Director and above gets higher weight) as well as the amount of effort expended by the buyer in that interaction (attending a webinar required higher effort from a buyer than clicking on a paid search ad).
2. Data-driven attribution models
These models assign attribution credits to touchpoints based on an algorithmic estimation of the significance of that touchpoint in converting the customer. Some of the popular algorithmic techniques are Markov Chain models and Shapely value-based models. Whilst data-driven attribution is seen as the north star of Multi-Touch Attribution, they are also more expensive to compute, require a large volume of conversions and touchpoints not to be biased, and are harder to debug.
Whilst each approach has its own pros and cons, a combination of these models may be leveraged to identify marketing leakage and improve ROI.
What are the different types of attribution models?
Single-Touch attribution models

Single-touch attribution models are among the most straightforward approaches used to evaluate marketing performance. These models focus on one touchpoint in the customer journey and assign all credit for the conversion to that one. While straightforward, these models might only sometimes provide a complete picture, especially in scenarios involving complex sales cycles.
Some of the most common types of single-touch attribution models include:
1. First-Touch Attribution
The first-touch attribution model assigns full credit to the initial interaction that brought the customer into the marketing funnel. This model is particularly useful for businesses with simple, transactional sales processes, such as SaaS sign-ups. By understanding which initial touchpoints are most effective at attracting prospects, marketers can better focus their efforts on top-of-the-funnel activities.
However, the limitation of first-touch attribution becomes apparent in longer sales cycles. For example, if a potential customer interacts with a brand through a blog post, attends a webinar, and finally makes a purchase, first-touch attribution would credit only the initial blog post. This approach overlooks the influence of subsequent interactions that may have been crucial in nurturing the prospect through the funnel.

Key benefits:
- Ideal for campaigns focused on lead generation and brand discovery.
- Helps you evaluate which channels introduce the most prospects.
- Misses the influence of nurturing and closing interactions.
- Works best for businesses with short sales cycles or fewer touchpoints.
2. Last-Touch Attribution
Conversely, the last-touch attribution model gives full credit to the final interaction before the conversion occurs. This model is beneficial when trying to identify what specifically triggered the conversion. For instance, if you want to determine whether a blog post, a LinkedIn ad, or a webinar was the last factor that led a prospect to book a meeting, last-touch attribution can provide clarity.
While last-touch attribution can offer valuable insights into what ultimately led to a conversion, it has drawbacks. This model can skew results by ignoring the role of earlier touchpoints. For example, in a long B2B sales cycle, if a prospect finally signs a contract after several months of interaction, attributing the entire credit to the final step—such as a contract-signing tool like DocuSign—may not accurately reflect the contributions of earlier interactions. This can lead to an incomplete understanding of the marketing efforts that influenced the final decision.

Key benefits:
- Good for identifying conversion-focused channels like retargeting or email.
- Simplifies reporting and is easy to implement using most analytics tools.
- Ignores the impact of earlier touchpoints that shaped intent.
- Often leads to over-investment in bottom-funnel efforts.
3. Last Non-Direct Touch Attribution:
This model assigns 100% attribution credit to the last non-direct touchpoint. A non-direct touchpoint is an interaction that is guided by a specific source the business sets up (like an ad, email campaign, newsletter, etc.).
When your website traffic doesn’t come from a known source, they are considered direct traffic (traffic that came from prospects directly entering the company URL into the browser, for example).
Let’s assume that a lead interacted with your brand 5 times, each touchpoint is as given below.
- Touchpoint 1 - Prospect clicks on a PPC ad
- Touchpoint 2 - Prospect arrives at your site’s landing page
- Touchpoint 3 - Prospect subscribes to your newsletter
- Touchpoint 4 - A week later, your prospect clicks on a newsletter campaign
- Touchpoint 5 - Prospect directly visits the website and initiates a free trial before purchasing a subscription
Touchpoints 1, 2, 3, 4, and 5 constitute all the prospect’s interactions with your brand that led to them purchasing your product. Keep in mind that, in reality, businesses deal with numerous prospects interacting with several touchpoints, making the process of mapping the customer journey far more convoluted.
So if we consider the above-given example, this model would assign 100% sales credit to touchpoint 4 or the newsletter campaign clicked on, as that was the last non-direct source before the sale. This model assumes that every interaction is a consequence of the non-direct campaign, hence making it the most influential.

Key benefits:
- Useful for identifying the performance of non-branded campaigns (e.g., PPC, referral).
- Reduces bias from loyal repeat visitors or brand-aware customers.
- Often used in tools like Google Analytics for more realistic insights.
- Still ignores multiple other influential touchpoints.
4. Last AdWords Click Attribution:
This model credits the last interaction with a Google Ads campaign before conversion. It’s designed to help marketers optimize their paid search investments.
Let’s say a customer journey looks like this:
- Clicks a Facebook ad
- Visits via organic search
- Clicks a Google ad
- Converts
Last AdWords Click Attribution will assign 100% of the credit to Step 3 (Google ad click) — ignoring the earlier touchpoints.
Key benefits:
- Highlights which specific search campaigns drive conversions.
- Helps maximize ROI from PPC spend.
- Ignores contributions from organic search, social, or email.
- Can lead to siloed decision-making if used alone.
Is Single-Touch attribution an INEFFECTIVE model?
Many businesses and marketing aficionados are of the opinion that single-touch attribution is not an effective model on its own. It is often considered to be a one-dimensional approach that fails to faithfully represent a customer’s conversion journey down the funnel.
As we have discussed, while single-touch models may have their own relevant use cases (like for products with shorter sales cycles), it may not be as effective in identifying the most influential touch-point in a B2B customer journey.
If big data in marketing has proved anything, it's that customer journeys can be non-linear, sophisticated paths spanning several channels and mediums. Assigning 100% of the credit to a single touchpoint will rarely be sufficient.
Multi-Touch Attribution Models
To address the limitations of single-touch models, multi-touch attribution models distribute credit across multiple touchpoints in the customer journey. These models offer a more nuanced view of how various interactions contribute to conversions, making them particularly useful for complex sales processes.
Linear Attribution

The linear attribution model assigns equal credit to every touchpoint the customer interacts with along their journey. This approach highlights the importance of each interaction, providing a balanced view of how various touchpoints contribute to the final conversion. In a B2B context, where a customer may engage with a company through several channels before making a purchase, linear attribution helps ensure that no single interaction is undervalued.
However, linear attribution can also have its drawbacks. By giving equal weight to all touchpoints, this model may overvalue less significant interactions and fail to capture the varying levels of influence each touchpoint has on the conversion. For example, if a customer interacts with a blog post, attends a webinar, and then downloads a white paper before making a purchase, linear attribution would attribute equal credit to each of these touchpoints, potentially overlooking the unique impact of each interaction.
U-Shaped Attribution

The U-shaped attribution model provides more weight to the first interaction and the touchpoint that leads to conversion while giving less credit to intermediate interactions. This model strikes a balance between acknowledging the importance of initial engagement and recognizing the significance of conversion-driving touchpoints. For B2B businesses with longer sales cycles, the U-shaped model can offer valuable insights into which early touchpoints attract prospects and which final touchpoints are crucial in closing the deal.
The U-shaped model is particularly useful when you want to understand the relative importance of initial and final touchpoints. However, it may not fully account for the influence of touchpoints in between, which can also play a crucial role in nurturing the prospect through the sales funnel.
W-Shaped Attribution

The W-shaped attribution model adds more granularity by assigning credit to the first touch, the lead conversion touch, and the final deal-closure touchpoints. This model is designed to provide a comprehensive view of the customer journey, capturing the influence of key stages along the way. In a B2B setting, where a prospect's journey may include various touchpoints such as content downloads, webinars, and sales meetings, the W-shaped model ensures that significant interactions at each stage receive appropriate credit.
While the W-shaped model offers a detailed view of the customer journey, it can also be complex to implement and interpret. The model’s emphasis on multiple key touchpoints may lead to a more detailed understanding of the customer journey but may require more sophisticated tracking and analysis.
Time-Decay Attribution Model

The time-decay attribution model assigns more credit to touchpoints closer to the conversion event, assuming that later-stage interactions significantly impact the final decision. This model recognizes that earlier interactions are essential but less influential than those closer to the conversion point.
The time-decay model can help identify which touchpoints are most influential in the final stages of the customer journey. For instance, if a lead interacts with various marketing channels over several months, the time-decay model would attribute more credit to the interactions that happen closer to the conversion date while still acknowledging the role of earlier touchpoints.
However, it may undervalue early interactions that played a crucial role in initial engagement. By focusing more on recent touchpoints, this model may not fully capture the cumulative impact of the entire customer journey.
5. Linear Attribution
A linear attribution model assigns attribution credits evenly among all touchpoints. While this model is far more illustrative than any of our single-touch attribution options, it's a relatively simplistic approach when compared to its nonlinear variants.
Let’s assume that the total number of touchpoints in our PMS example is four: An advert, a blog, a review, and a retargeting campaign. Linear attribution would reward 25% of attribution credits to each of these touchpoints.
Of course, in reality, the number of touchpoints a B2B customer goes through is significantly higher — so the weights for each one are likely to be far smaller.
6. U-Shaped Attribution
The U-shaped model assigns attribution credits to all touchpoints — but assigns higher credits specifically to the first and last touchpoints. This would imply that your customer’s first and last interactions prior to the conversion milestone are the two most valuable touch-points in their journey.
Consider the same four touch points as with the previous example (Ad, Blog, Review, and Retargeting campaign). This time, maybe 40% of the credits will be assigned to the first and last touch points each. The two touchpoints in-between will receive only 10% each as they are deemed less influential to the conversion decision.

The model laid out in a bar graph takes the shape of the letter ‘U’, hence the name.
Key benefits:
- Balances the value of initial awareness and final action.
- Great for mid-length customer journeys with 3–6 touchpoints.
- It can be customized depending on your funnel structure.
- Doesn’t consider lead qualification or deeper CRM stages.
7. Time Decay Attribution
Time decay attribution assigns attribution credits in an ascending cascade.
What this means is that each touchpoint is given progressively higher credit, with the first touchpoint having the least credit and the last touchpoint having the most. This is an effective tool in mapping out a customer’s conversion journey.
The model works on the assumption that touchpoints closer to the conversion were far more influential than touchpoints further away from the conversion. Again, using our handy four touchpoint PMS example, a time decay model would assign attribution credits in this manner: 5% for the advert, 15% for the blog, 20% for the reviews page, and 60% for the retargeting campaign.

7. W-shaped attribution
This type of attribution model is similar to the U-shaped model we discussed earlier.
The first and the last touchpoints are also given importance in this model, just as in the U-shaped model. But during the middle of the sales funnel, if you generate quality leads, then that touchpoint is also considered influential. And therefore is given equal importance as that of the first and last touchpoint.
So, if there are 5 first touchpoints in total, the first, middle, and last touchpoints will be given 30% each and the rest only 5%.
To give you a clear-cut idea, take five touchpoints. For example, an advert, a blog, a case study, reviews, and finally, retargeting campaign.
A prospect got in touch with your business through an advertisement, prompted to read your blogs, where they decide to subscribe to your business’s newsletter. Thereby generating a lead towards the middle of the process. The lead then continued to follow up on their research by constantly staying in touch with the business through newsletters. And finally, the lead converts by signing up for a free trial. Following is an example of a graphical representation of the W-shaped attribution model for the given example.

8. Lead Conversion Touch Attribution
This model attributes full credit to the touchpoint that converted a visitor into a lead, such as filling out a form or subscribing. It’s especially relevant for lead generation campaigns. It credits multiple touchpoints across the buyer journey, not just one.
It's commonly used by marketing and demand gen teams to understand what activities helped generate leads, even if those leads haven’t converted to customers yet.
For instance, consider this user journey:
- Clicks a LinkedIn ad → No lead
- Downloads a whitepaper from organic search → Still not a lead
- Clicks a retargeting ad → Fills out a demo form → Becomes a lead
- Sales calls and closes the deal
Lead Conversion Touch Attribution would distribute credit across Steps 1–3 (touchpoints before lead conversion) but exclude Step 4, since it happens after lead creation.
Influence Attribution
Influence attribution, or custom attribution, is a flexible approach that assigns credit to all touchpoints that have influenced the deal. This model allows marketers to analyze the impact of different channels and interactions on the final conversion, providing a comprehensive view of how various touchpoints contribute to the customer journey.
While influence attribution offers valuable insights into channel impact and the relative effectiveness of different marketing efforts, it carries the risk of double-counting revenue. By assigning credit to all touchpoints involved in the conversion process, this model may attribute more value to each touchpoint than is warranted, potentially leading to inflated performance metrics.
Choosing the Right Attribution Model

Selecting the right attribution model depends on several factors, including the complexity of your business, the length of your sales cycle, and the specific insights you want to gain. Here are some key considerations to keep in mind:
- Business Complexity and Sales Cycle Length
Single-touch models may provide sufficient insights for simple, transactional businesses. For more complex B2B sales processes, multi-touch and time-decay models offer a more detailed understanding of how various touchpoints contribute to conversions.
- Key Insights
Determine what questions you want to answer. Are you interested in understanding what drives initial sign-ups, or do you need to know which touchpoints are most effective in closing deals?
- Ease of Implementation
Choose a practical and feasible model for your marketing and sales teams to implement. While multi-touch models provide more detailed insights, they may require more sophisticated tracking and analysis.
- Goals and Metrics
Adapt your attribution model based on whether your goal is to track revenue, measure the effectiveness of touchpoints, or evaluate overall marketing performance.
Here’s a summary table to help you choose the right attribution model based on your needs:

Limitations of Attribution Models
Single-touch attribution models (like first-touch, last-touch, and list non-direct touch) are simple to implement but have several disadvantages. They oversimplify the customer journey by assigning credit to a single touchpoint, ignoring the contributions of other touchpoints. Similarly, these models also neglect the aggregate effect of multiple touchpoints over time. What results is inaccurate credit allocation, because the model disregards individual customer behavior and other factors.
On the other hand, multi-touch attribution models are definitely more complex because they work with complicated algorithms and technology. This often requires expert knowledge and pro- marketing knowledge of marketing software. The impressions from data can be misleading because of shortcomings like wrong assumptions and wrong weightage assigned to each marketing activity. To add on, while multi-touch attribution models are efficient for data- rich digital marketing campaigns, they are not equipped to measure external factors like word-of-mouth, seasonality or pricing.
Like single touch attribution models, multi-touch attribution models can also miss out on giving the full picture. Linear attribution models assume that all touchpoints have equal influence on customer behavior, which is not always the case. U-shaped, W-shaped and Time-Decay models run the risk of oversimplifying the customer journey since they assign more credit only to some touchpoints, while neglecting others. This could cost the model some valuable insights and paint an incomplete picture. The time-decay attribution model considers the recency of the customers close to the conversion event, but it can still overlook the significance of earlier touchpoints.
5 Marketing Attribution Tools For 2025
To use marketing attribution models well, you need the right marketing attribution tools to gather and analyze data from different channels. These tools help you understand the customer journey and improve your marketing strategies.
1. Factors.ai
Factors capture intent signals and automate tasks, with no-code integrations and strong support. It's useful for businesses wanting to simplify their attribution without needing technical skills.

Features:
- Multi-touch attribution with easy setup.
- Lead scoring and buyer journey mapping.
- No-code integrations with CRMs and ad platforms.
- Intent signal tracking from anonymous and known users.
- Automated reports and insights.
- It has a free version. The paid plan starts at $399 per month.
2. Google Analytics
It is a common choice. It shows where traffic comes from and how users behave. It supports basic models like Last Click and Linear Attribution, making it good for businesses new to attribution analysis.

Features:
- Supports Last Click, Linear, and Time Decay attribution models.
- Real-time website traffic monitoring.
- Integration with Google Ads and Search Console.
- Funnel and goal tracking capabilities.
- Free and accessible for businesses of all sizes.
- Public pricing is not available.
3. Adobe Analytics
It offers advanced modeling, including multi-channel analysis and data-driven insights. It's ideal for large businesses needing detailed analytics across many touchpoints.

Features:
- Multi-channel and cross-device tracking.
- Custom attribution modeling and segmentation.
- Predictive analytics using AI and machine learning.
- Real-time data visualization and reporting.
- Seamless integration with Adobe Experience Cloud.
- Pricing details are not available.
4. LeadsRx
LeadsRx focuses on multi-touch attribution and customer journey analytics. It provides a clear view of how different channels lead to conversions. It's great for businesses wanting to understand the full customer journey.

Features:
- Unified view of marketing channels and conversions.
- Cross-device and cross-domain tracking.
- Integration with CRM, ad, and marketing automation tools.
- Real-time attribution and performance reports.
- Clean, visual journey mapping interface.
- Paid plan details are not publicly disclosed.
5. Wicked Reports
Wicked Reports specializes in revenue-focused marketing attribution, particularly for e-commerce and subscription-based businesses. It helps marketers link marketing activities to actual sales, focusing on long-term ROI.

Features:
- Tracks full customer journeys with multi-touch attribution models.
- Measures true ROI using customer lifetime value (CLTV) tracking.
- Offers detailed attribution for email, paid, and organic channels.
- Integrates with platforms like Shopify, Klaviyo, Google Ads, and Facebook Ads.
- Provides cohort-based analysis to track marketing effectiveness over time.
- Paid plan starts at $500/month.
Choosing the right tool depends on your business size, budget, and specific needs. Look at these tools based on their features, pricing, and integration abilities to ensure they fit your marketing goals and data setup.
Also, read this guide on common challenges in B2B attribution and their solution.
Takeaway
Needless to say, all attribution models are not appropriate for all use cases. Different attribution models aid different types of marketing campaigns and can reveal different insights into the customer journey.
In the end, a lot of the use cases for these types of attribution models are subjective. The decision to opt for a specific model can be based on several reasons spanning from the nature of your product to the extent of your brand equity. It may also vary based on the specific kind of insight you want to achieve.
More often than not, you will find yourself using more than just one model with several stipulations and custom values for each variant. Fortunately, the progressive ingenuity of AI and constant innovations around attribution modeling will render your experience less of a trial by fire and more of an intuitive, insightful practice.
Leveraging the right marketing analytics platform will be the first step in deciding the attribution model required for your company/business. As we said, it's best to rely on more than one model to improve your desired results. And for that, you will need an expert team, like Factors, that understands your requirements and guides you in leveraging the right techniques.
With Factors.ai, you can easily track the effectiveness of your campaigns and content, identify which channels are driving the most conversions, and optimize your marketing efforts for maximum results. The tool also offers a user-friendly interface and customizable dashboards, making it easy for you to access and interpret your data.
Interested? Sign up here for a FREE trial, or contact our team to get a Free consultation now. Here is the contact email for your reference - solutions@factors.ai
Bonus FAQs
1. How do I choose the right attribution model for my business?
In order to choose the right attribution model, you will need to know the target market, the target audiences, and so on. And once you have everything set, consider the following.
- Define your business goals. The attribution model you select must align with your business goals. Is it sign-ups? Leads? SQLs? Or just organic traffic.
- Once you have defined the goal, understand the types of attribution models and how each model allocates credits to the touchpoints.
- Evaluate the data you have to get an idea of the current touchpoints where your business is driving conversions [goals].
- Test out different models to see which is more effective.
- And finally, constantly review the results and update the models according to the business needs.
2. How do attribution models help find the gap in the customer journey?
As we discussed earlier in the blog, each attribution model provides insights into your customers' touchpoints with your business. Which itself gives the different paths each customer has taken to reach your service.
Thereby helping you understand the customer journey and find the touchpoints you missed during your initial marketing campaign.
3. How do attribution models help in improving the conversion rate?
Attribution models help improve the conversion rate by identifying which touchpoints in the customer journey are most effective in driving conversions.
They enable data-driven decisions helping businesses optimize their marketing budget and allocate resources efficiently to boost conversion rates.

8 Common Revenue Attribution Mistakes You Should Avoid
Marketing’s transformation from a cost-centre to a revenue powerhouse — coupled with a boom in digital channels — means that marketers, now more than ever, require a granular account of their influence on pipeline and revenue.
Enter: Revenue Attribution.
B2B companies are prioritizing revenue attribution to measure their marketing performance and ROI, and track customer journeys. In fact, 76% of all marketers find that they currently have or will have in the next 12 months, the capability to employ a robust revenue attribution platform (Think with Google). Conceptually, the function of attribution is straightforward, but there are several mistakes that could easily skew your results and limit your progress when it comes to accurate, actionable revenue attribution analysis.
With that in mind, here are 8 common mistakes to avoid for your revenue attribution regime:
1. A lack of an attribution strategy
Despite the automation solutions that are embedded in most attribution tools today, it becomes easy to forget that your input plays a huge part in producing relevant results. Formulating a strategy is essential in being able to derive actionable insights from your attribution. At the end of the day, the relevance of tracking different channels and campaigns in a customer’s conversion journey is incumbent upon you.
Get organised! Start by cataloguing relevant channels to track as per your conversion goals. Label your channels and campaigns and assign budgets so that all your data across all your tools is coherent. Tracking irrelevant channels (or not tracking relevant ones) is a part of trial and error, but reliance on such incomplete data is a big red flag. One common example of this is: tracking only the performance of ad campaigns without testing its performance relative to other channels.
Communicating with the appropriate personnel and others involved in the strategy to gain better insight on what to track and what not to is a good start.
2. Excessive reliance on preliminary revenue attribution models
The tendency to rely on preliminary attribution models — single-touch models like first and last touch or the popular last-click model — may produce quick and simple results to measure your ROI. This, however, can be an expensive mistake. Don’t get it twisted, single-touch models have their use cases — attributing PPC and short sales cycles to name a couple. But relying solely on preliminary models for all your marketing decisions will likely do more harm than good. Single-touch models are linear in nature, which is not conducive to most customer behaviour. Attribution is more effective when you strive to get as close as possible to analysing a customer’s journey across several touch-points. And having one touchpoint attributed to a customer’s conversion gives a vague, and often inaccurate, image of their journey.
3. Not testing multiple attribution models
This mistake is likely to be a consequence of the previous point — excessive reliance on preliminary models. But why is it important to test other models? When it comes to rule-based attribution and multi-touch attribution models, the general reasoning behind adopting a model is the nature of the product, the number of marketing channels, the length of the sales cycle, etc. While there’s nothing explicitly wrong with this, we cannot only rely on those factors.
There are several omitted variables around the intent of your attribution — measuring the functionality of different campaigns in conjunction with other channels, the relative probability of channel interaction, opportunity cost of campaigns, or just simply mapping out the most influential channel and ROI. Even the type of campaigns and the medium through which the customer interaction occurs could affect your decision in choosing a model. Some models are more applicable than others in producing reliable results, and the only way we’ll identify this is by testing out what works and what doesn’t.
4. Not understanding the limits of rule-based modelling
In practice, administering a combination of rule-based attribution and data-driven attribution is an effective way of producing reliable results. That being said, if you’re for the most part dependent on rule-based modelling, you’re unlikely to have transparent results. Rule-based modelling is limited, as the weights in the models would need to perfectly represent the influence of each channel in a customer’s conversion journey. This is highly unlikely as no two customers are the same. For example, a time decay attribution model will assign credits in ascending order regardless of the type of campaign or prospect’s actual behaviour. So, to help identify your most influential channels on average, data-driven attribution can be used to give credibility to different channels by assessing their KPI’s. This in turn will help you draft a custom model that makes sense to your attributing pattern.
5. Misaligning attribution data and customers/lead quality
In the pursuit of using your attribution data to aid your marketing decision making, sometimes you forget to categorize our data considering the customers involved or their lead quality. To make better sense out of your attribution data, we need to pair the interactions with customer IDs to avoid duplication of leads and accurate credit distribution across marketing channels.
Tracking our customers even helps assess the quality of their leads. What this means is some customers are likely to be more interactive and engaged with your brand than others. This even dictates if some of them become recurring customers or only ever interact with your business once. Tracking customer interactions helps you distinguish the quality of their leads. These values also contribute to calculating the LTV (Lifetime Value) of your customers.
6. Ignoring the bias
These mistakes have to do with certain biases that might compromise your decision-making pertaining to attribution. The most common ones are:
Correlation Bias
When attributing credit to different channels along your customer journey, there is a possibility for certain interactions to conceive other interactions (or at least a level of other interactions). One could over/underestimate the influence of channels with other channels simply because of the natural conversion of targeted customers. A conscious consideration of correlation vs causation must always be kept in mind.
Confirmation Bias
A confirmation bias is the proclivity to seek out information, and the interpretation of said information, to favour your results and personal beliefs. This type of bias is prevalent in attribution as it involves having to attribute your channels in accordance with the result that favour you. This would eliminate the organic element of attribution to favour your marketing ideals, ultimately leading to inaccurate findings and conclusions.
7. Failure to understand the channel intent
When you fail to recognize your channel’s intent, you fall short in gauging how much it facilitated a customer’s conversion. This could lead to poor decision making as a consequence. Some channels facilitate interactions with other channels more than they do sales — like a blog versus a targeted email campaign. Hence, it would be unfair to discredit the channels that did not directly contribute to sales — or other predominant goals — but probably contributed significantly to a customer’s decision to convert.
8. Attribution is not the Be-All End-All of your marketing analytics journey
As convenient and resourceful as attribution is, they will never provide a holistic, extensive picture. While attribution is valuable in showcasing a blueprint of your campaigns, channels, and marketing performance. You still require other analytics tools — Funnel analysis, Anomaly detection, SEO optimization, CRM, and other web analytics tools that help assess channels using premeditated metrics. These tools will ultimately compliment your data-driven attribution for a far more comprehensive analysis of your campaign and channel performance. In order to do this effectively, you will have to use these tools cooperatively and in real-time.
Acknowledging these limitations and making a conscious effort to mitigate them will help equip and optimize your marketing attribution journey. Don’t let the idea that there is so much that could go wrong make you apprehensive about trying out marketing attribution to begin with. Undoubtedly, it’s a steep learning curve, but the rewards far outweigh the risk involved.
And there you have it! If you’re interested in understanding how some of the most popular single-touch and multi-touch attribution models work, you might enjoy this blog piece.

How to go about Search Engine Optimization (SEO)
Search Engine Optimization
It is reported that 75% of users never visit the second page on their search results. As search results become increasingly concise and filtered, it’s easy to forget how ruthless and saturated search engine rankings can be. Hence, it isn’t an understatement that the accessibility of your page on a search engine should be an integral precursor for your marketing value proposition. Accordingly, marketers are prioritising SEO as part of their inbound efforts. This post expands upon the theory, practice, and importance of SEO in an ever-growing digital marketplace.
What is SEO?
SEO, or search engine optimization, refers to the process of increasing the likelihood of your website, content, product, etc. appearing close to the top of your SERP — search engine results page. The objective is to direct more traffic to your webpage by increasing its ranking on a user’s search engine index, either organically or with minimal monetary investment.
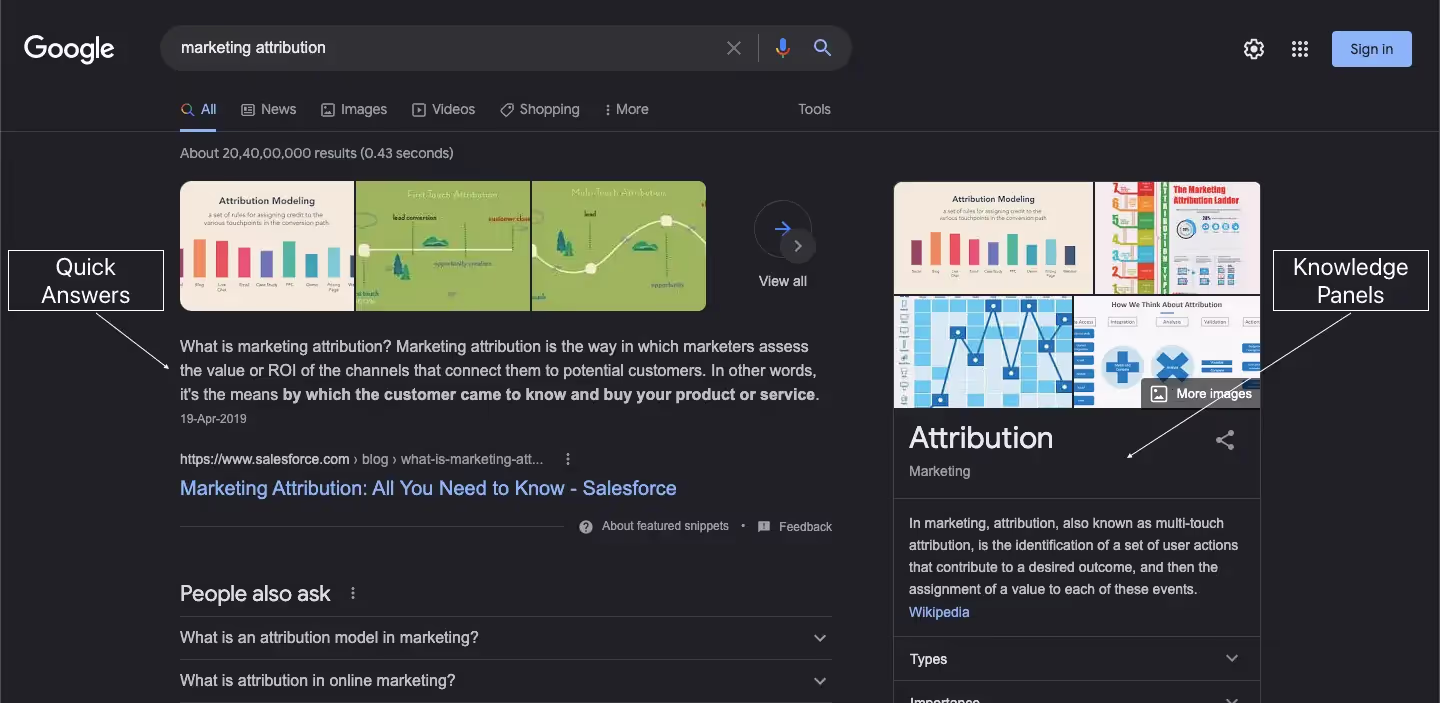
Search engine results page or SERP is a constantly evolving geography. Search results — especially those pertaining to inquiries now feature quick answers and knowledge panels that direct clicks away from low-ranked domains. For instance, if you were to google ‘marketing attribution’, you would be presented with a quick answer in the form of a short description directly below. Additionally, other relevant, consolidated information is presented on the right within knowledge panels. Note that Google and many other search engines prioritise having their users spend more time on their SERP without having them navigate away as much. This is why marketers need to capitalise on their rich results and SERP ranking.
CRAWLABILITY AND INDEXING
Before we look at what your search engine prioritizes when ranking, it’s well worth understanding what crawlers are and how search engine indexing works:
Crawling is the process of your search engine sending out crawlers, which are bots that are used to discover new web pages. The crawlers start by following a certain number of web pages followed by then routinely navigating content and new links within these web pages. Thereby discovering a series of new web pages which it reports back to its respective server. A website’s crawlability thus refers to a crawler’s viability in a website or web page. More on increasing crawlability below.
All this information that the crawlers obtain is then stored in a database known as a search engine index. The data is then organised, analysed, and prepped for retrieval on a search engine results page — this process is known as search engine indexing.
The Ranking Algorithm: PageRank
Before indexed information is retrieved into a search engine results page, it is ranked by several factors in order to obtain the most relevant sources of information. While this piece will cover some critical success factors for your SEO, it is important to understand that Google ranks their websites based on relevancy and an algorithm. Understanding the algorithm is fairly complicated as it is continually evolving. That being said, PageRank is an algorithm that is still being used by Google to rank websites and will help provide an idea of how the ranking algorithm works.
PageRank uses an algorithm that helps rank web pages based on their relative importance. It does this by estimating how many times a web page is visited or linked from other web pages and also measures the quality of these links. For example, your web page is more likely to be ranked higher if it is linked by relatively important web pages — like Forbes or the NYT — than it is if it was linked by many less "relevant" web pages — like The Onion or ArticleIFY.
The importance of a web page is assessed using a random surfer model and a damping factor that estimates how many times a web page is visited by a random surfer and assigns a percentage to all web pages visited. All you need to know is that the model and damping factor helps eliminate any way in which people can artificially inflate their web page’s importance.
SEO CSF — CRITICAL SUCCESS FACTORS
This segment will explain a few critical success factors for your SEO in the form of good keyword practices, indexing and crawlability, and more:
Keyword CSFs
Keywords play a surprisingly significant role when it comes to SERP ranking. Certain niche keywords could be the reason your web page is ranked higher in a SERP. But what keywords should you use? Before you choose your keywords, you need to establish your search intent. Understanding your web traffic, and what they’re looking for is key when it comes to search intent. Ask yourself what people would specifically search for and what words or phrases they’d use — for instance, 8% of all search queries are in the form of questions.
Once you have an idea of some appropriate keywords, it would help to know what their search volume is. You could administer the help of a keyword research tool — like Jaaxy, GrowthBar, SEMrush, Google Keyword Planner, etc., which are tools that help gauge how popular/relevant certain keywords are. They could even compare and recommend other related keywords.
The largest barrier here is the competition of high volume and short-tail keywords — or search phrases consisting of only one or two words. Industry-leading brands are often ranked higher for short-tailed keywords due to their relative importance. However, there are some advantages in using long-tail keywords (i.e. search phrases that are longer with three to five words). The consensus is that, while high volume and short-tail keywords tend to involve highly-competitive broad search queries, long-tail keywords account for more convertible traffic as their search phrases are specific. Hence, you’re likely to garner more traffic with niche low volume, long-tail keywords than if you were to compete using high volume keywords. For example, you’re more likely to earn traffic from a search phrase like ‘Accounts receivable automation software’ than you do for ‘Accounting software’. Remember, if your keywords are too obscure, you risk losing your spot on a SERP.
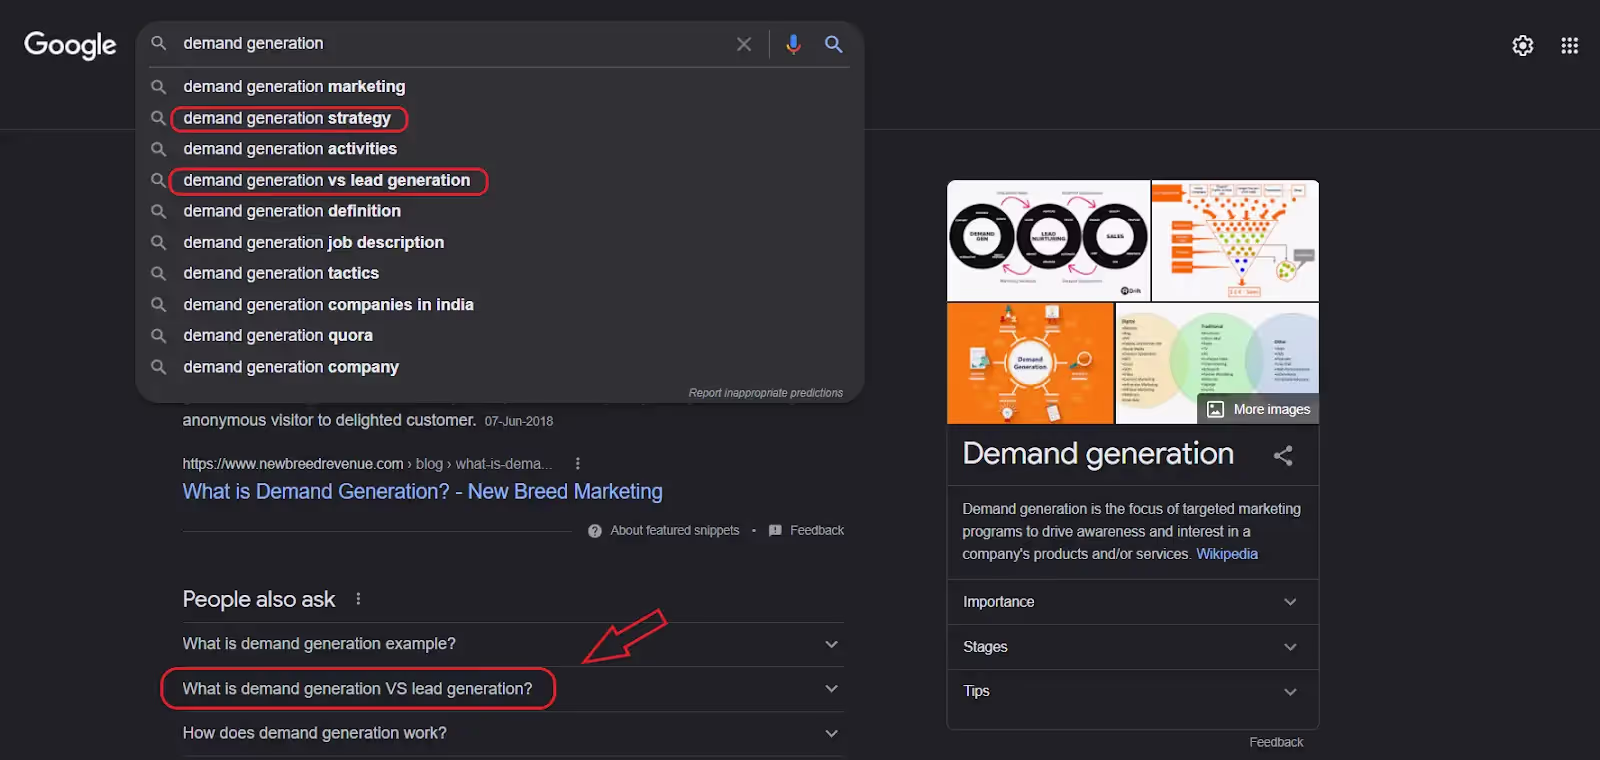
LSI or latent semantic indexing keywords may also be useful. LSI is a tool used by Google to understand synonyms and can contextualize keywords by linking them with relevant ones. This means that a synonym does not necessarily have to be an LSI keyword, and can be anything relevant in the context of your content. For instance, Googling ‘demand generation’ would have related searches for strategies and comparisons with lead generations. LSI has helped Google in identifying and contextualizing content on web pages better, which is a win when it comes to SEO.
Crawlability and Indexing CSFs
It is essential to know what affects your crawlability. The first is your site and internal link structure. It is imperative to make your search engine’s job of locating your site as easy as possible. For this, you must ensure that your site structure has an appealing UI and makes navigating across different pages intuitive. This way, crawlers will not find it difficult to get by. For the crawlers to do a comprehensive search on your website, ensure that a fair amount of internal link resources are prevalent for the crawlers to fully cover your website. It is also important to block crawlers’ access to irrelevant pages to avoid saturating the context of your content.
Besides your site and internal structure, making sure that other interferences such as slow site loading speeds are resolved as they add to the crawlability of your website. If you are unsure about your site’s visibility on a SERP, using tools like Google Search Console will help monitor your site’s presence on Google SERP.
Other Important CSFs
Recalling the mechanics of Google’s PageRank algorithm, you will know that your web pages’ networking with other pages is of paramount importance. Having external links from other sites that link to your site — especially higher quality links that come from important sites — along with understanding your competitors’ backlinks and utilizing them will help improve your ranking.
Rich results is a feature that showcases information that is not only important in giving a brief description to a user but also helps crawlers identify your site and the purpose of the content because of its metadata. Rich results have a title, meta description, favicon — and depending on what the page is about it could even show pricing, specifications, and a rating. All of which aid in the crawlability and a user’s understanding of the web page.
Another simple but effective factor is the quality of the content on your page. The use of unique, engaging, and informational content with ample visual representations in the form of high-quality images and video. Google prefers sites with content, and good content at that. The better the quality of the content is, the more favorable you become in Google’s algorithm.
With these factors in place, you’re one step ahead in your SEO journey. When it comes to SEO, being consistent, putting out new content, and following good practices will be sure to help out in the long run. Just remember that SEO is always changing, and if you want to take the bull by the horns — keep updating your methods, and stay ahead of the status quo.

Measuring the ROI of your B2B Content
If you find ROI measurement of your content marketing efforts a challenge, you’re not alone. Only 8% of B2B marketers believe they are successful at gauging their content's ROI and influence on revenue. With the content marketing industry constantly growing, making up between 25%-40% of B2B marketing budgets, it only seems fair to understand its metrics and incorporate ROI measurement into your content marketing strategy.
Ends That Justify Your Means — Why Do You Need To Measure Your Content Performance?
If It Won’t Convert, It Won’t Matter:
Content marketing has contributed substantially to the B2B marketing sphere. Blog posts, podcasts, infographics, etc. all play a major role in a business’s marketing efforts. But there’s a fine line between good content and content that promotes lead generation. The end goal of content marketing is generating traffic and influencing the conversion of said traffic. So, a conscious effort to measure your content helps lay the groundwork for a content marketing strategy that prioritises the goal and justifies the cost of doing so.
If It Does Convert, By How Much?
When it comes to B2B marketing, your prime audience is pretty specific. Hence, your content is likely to have a larger impact on pipeline and revenue. 71% of B2B customers consume a blog before making a purchase. Quantifying information like this is effective in distinguishing your leads from your sales. The difference and variety of metrics available for your content provide valuable insights. Understanding the extent to which each metric attributed your leads is an essential aspect of painting a clear picture of your ROI. A classic example of this is to resort to vanity metrics such as organic search traffic to evaluate your content’s success rather than its bounce rate or impressions made which are more conducive in assessing an MQL — marketing qualified lead.
What You Could Expect for The Future:
Trial and error is an expected component of your content marketing track record. The data you amass by monitoring your metrics will prove to be insightful in the formation of your content marketing strategy and budget — including the provision of answers to common questions like “what type of content generates the most traffic?” “Which content influences the most revenue and pipeline?” and “Which content had the most effective link building and/or SEO rankings?”
Understanding The Metrics
Historical Data and Monitoring:
A common barrier to entry for content marketing ROI is your access to customer historical data. To elaborate, your access to said data also includes the cost of acquiring it, the risk associated with losing it, and the availability of precise data when needed — relating to interactions with content. Most software available to track customer metrics like the touch attribution of content, the number of contacts from email, the revenue generated per customer, etc., are fragmented across different software with limited storage of customer data and are behind a paywall. There is even the risk of losing this data because of these stipulations. For this, it is recommended that businesses house their customer data using a data warehouse to retain the historical data of their customers and to use a customer data platform that will organise customer data and behaviour across various software in real-time into a comprehensive format suited for content ROI.
Lead Conversion:
The first step in measuring your content’s ROI is to establish what your lead conversion is. Or in other words, identify what customer action is considered a worthy result of your content’s purpose. This would vary depending on the product and what business it is being targeted to — so organising your leads or conversion goals in conjunction with your products is crucial. Some examples of conversion goals would be — signing into your website, downloading a demo, subscribing to a newsletter, or even a sale, etc.
Lead conversion rate: The number of leads relative to the number of visitors on a webpage. Divide the total number of leads by the total number of visitors.
Landing Page:
Your landing page is the first page of your website which is visited by a prospective customer. There are certain metrics that can be used to assess the attribution of your landing page to your conversion goal. Your landing page’s page views indicate the number of visits that have occurred on your landing page. The number of unique visitors helps you identify the number of people visiting your landing page, this is different from page views as it only counts the number of visitors and not the number of their visits.
Other useful metrics for evaluating attribution in your landing page include your bounce rate — which is the number of visitors that navigated out of your page after viewing only one page. Your average session duration is the average time lapsed during a session — a session being a user’s regular interactions — on your landing page. These metrics illustrate the authenticity of your content’s applicability for conversions.
Email Traffic:
81% of B2B marketers utilize email newsletters as a part of their content marketing strategy — making it the third most popular form of B2B content. If your business sends out newsletters, these metrics are important to track: An email’s open rate measures the percentage of emails opened, and if you link your content webpage in your email, a click-through rate distinguishes the number of users who’ve clicked on the aforementioned link and those who did not.
Social Media Traffic:
The most popular form of content (95%!) implemented in a content marketing strategy by B2B marketers is organic social media posts. On channels such as Twitter, LinkedIn, Instagram, and YouTube, Audience engagement on your posts in the form of Likes, Shares, Comments, and even Follows are useful metrics to assess the influence and engagement of your posts. Of course, click-through rate may be tracked as well.
The Nitty-Gritty — Measuring Your Content’s Influence and ROI:
Once we have gathered all the relevant data, we can now measure our content’s ROI. But before doing so, we need to assign a monetary value to your MQLs. If your conversion goal is a sale, then it is the revenue generated from that customer’s sale. If it is a campaign goal like demo scheduled, it is the forecasted revenue from prospective customers that’s most relevant.
Once this is established, organise this data in a coherent manner to measure its ROI. Start by isolating landing pages or content pages to measure them individually. Then we will allocate their respective data to them. For the sake of comparison and future content marketing strategy, it is imperative to distinguish your MQLs from your visitors. The last step is to assign your revenue to your MQLs, whether it be the revenue generated from sales or the forecasted revenue of a particular lead or conversion goal. And finally, we can calculate the ROI with our MQL revenue — the ROI calculation here would be the revenue generated from the MQL divided by the cost of production of the landing page’s content.
To illustrate — let’s say that you were measuring the ROI of one of your landing pages at the end of the month. Perhaps a blog in your payment gateway service company. Organically your blog has amassed 500 unique visitors, and around 300 through social media posts and email campaigns. Out of the 800 visitors, 60 of them signed up for a demo, whose forecasted revenue amounted to around $5000. Using the formula mentioned above and dividing the $5000 with the cost of the production of the content, you will measure your B2B content’s ROI.
Evidently, measuring the ROI of your B2B content is a tough nut to crack, and as I mentioned earlier, trial and error is an expected component of your content marketing track record. While quantifying your means will expedite your strategy, functional results take time and mistakes, and if you’re patient enough, they’ll yield.

Optimizing ABM with Revenue Attribution
In an age where the functionality of the B2B marketing landscape becomes increasingly volatile, account-based marketing (ABM) and Revenue Attribution rise to the occasion. The adoption of ABM as an alternative to traditional demand generation is becoming progressively prevalent in the B2B space. Despite its increased use in recent times, the conception of several new and complex channels is promoting the need for ABM practitioners to be able to appraise their investments and optimise their ABM strategies. The incorporation of Revenue attribution in account-based marketing deciphers this challenge.
Understanding Account Based Marketing
What is ABM?
Account-based marketing or ABM is a strategic marketing approach wherein marketing resources and campaign efforts are directed towards targeted/key customer accounts. More specifically, ABM earmarks Ideal Client Profiles (ICPs) that would generate the most revenue.
ABM is known to be collaborative in nature, as most functional ABM efforts work in conjunction with other teams such as sales, operations, customer success, etc. This collaborative work is done during the earlier and final stages of ABM, the former of which involves scrutinizing your target accounts by soliciting the data (i.e. profitability, ACV, retention rates of customers, technographic characteristics etc) in order to build your ideal customer profile. With this data, one can identify target accounts as well as target contacts within those accounts.
While businesses *could* work with this list of prospects, most marketers further compartmentalize these accounts and contacts into tiers that rank prospects based on ratings assigned for revenue potential. This, ultimately, would help distinguish your marketing approaches — one-to-one, one-to-few, and one-to-many etc.
The final stages of ABM involve engaging with your preferred accounts. What’s important here is that you integrate other prominent teams like sales, customer success, and operations to ensure an aligned execution of efforts.
When is ABM Necessary?
Given the sheer magnitude of money, time, research, and personal campaigns invested into ABM, generating an ROI for your ABM strategy necessitates its investment. The problem is that the efficacy of your marketing efforts will not be the same for all key accounts, but that’s obvious. What’s noteworthy here is that your marketing efforts on key accounts should have the lowest risk and the highest viability. This however only becomes feasible depending on the quantity and mostly the quality of the target market. The higher the number of key accounts available to target, and the better the revenue potential of each key account, the more suitable ABM will become for your targeted accounts. There are a couple of ways in which you can measure this:
- Measuring the annual contract value of your key accounts will help gauge the potential ROI if you were to use ABM, the higher the better your ROI.
- For account quantity, a larger number of key accounts accumulated is preferable — if ABM is your main/exclusive marketing strategy — as they increase the probability of lead generation per account.
- The TAM or total addressable market will help you gauge if your target market is too broad or narrow for a manageable audience for personalized marketing efforts, the smaller the size of the TAM the more serviceable the personalized engagement becomes.
The Relevance of ABM
While account based-marketing is not a novel strategy, its emergence over the last couple of years has been excellent thanks to its adaptation to technology, automation, and the utilisation of tools by an increasing number of businesses. Enabling better synergy for its collaborative prospects as discussed earlier.
As of 2021, over 70% of marketers reported the use of ABM, 15% of whom grew from the previous year alone.This is owing to an overhaul of your standard marketing approaches partly as a consequence of the global pandemic causing a loss in value for traditional lead generation and volume-oriented targeting. What made ABM stand out is its versatility and its adaptability to its customer needs. This is because ABM focuses more on quality than the quantity of your broader customer base. Prioritising retention and marketing efforts on their targeted accounts instead of a broader miscellaneous customer base that would have a higher chance of disqualification. The businesses that utilised ABM before and during the COVID-19 outbreak, adapted to the changes — relating to industries like tourism and food service that took a hit based on PD — by reconstructing their key accounts and ideal customer profiles based on new factors, showcasing its versatility and popularity in choice in a changing economic climate.
Attributing ABM
How does Revenue Attribution enhance ABM?
The following are ways in which revenue attribution can help overcome some of the shortcomings of ABM and maximise its utility in practice:
Measuring ABM Activities and Tracking ROI:
One of the core principles of ABM is that it prioritises and invests in appeasing your best revenue-generating key accounts through personalised engagement programs, this warrants the need to measure the engagement and campaign’s success. A common challenge in ABM and legacy ABM tools is that they fail to provide these insights. That being said, the utilisation of revenue attribution and attribution models accommodates this need as it provides insights into what channels drive revenue and can highlight poor performing channels and campaigns throughout all your key accounts’ pipelines. Tracking your account-based campaign’s ROI, and optimising your customer acquisition cost through those insights are all part of its preliminary functions. Not to mention, identifying a reliable cost per lead (CPL), allowing ABM practitioners to set a more practical CPL limit on their channels for their key accounts.
Key Account Mapping:
The steps involved in an ABM strategy are complex, yet straightforward. Your plan of action is to identify your ideal customer profile (ICP) and use that as a blueprint to locate your key accounts. But what about the people or stakeholders within an account? — 75% of ABM practitioners can’t find the right contacts at companies matching target profiles. And along comes the next challenge. How do we identify the stakeholders involved in the buying process? The solution to this problem involves rigorous research into key accounts and organisational structure. Revenue attribution embellishes this process thanks to its sheer detail in the compartmentalisation of the customer journey by analysing several touchpoints mapping out a multi-stakeholder journey. Highlighting all the stakeholders involved in the buying process, which will facilitate better planning by engaging with the right stakeholders and the optimisation of campaigns based on these insights.
Incorporating Data Attribution in ABM:
The incorporation of data attribution facilitates the ability to measure the impact of account-based activity over the lifecycle of your key accounts or customers and help increase the productivity of these activities. Identifying the right data using a few metrics will make it possible to understand if you have targeted the right accounts. For example, the progression rate and pipeline velocity will illustrate the rate or speed at which your MQL or marketing qualified leads among your key accounts move through the pipeline in their life cycles. But before doing so, it is imperative to associate the right data with your attribution. A lot of the data solicited through various touchpoints are unstructured, identifying intent and buyer interest using metrics such as bounce rate, click-through rate, lead conversion rate, etc., are all essential in data attribution.
Aligning Sales and Marketing:
The functionality of ABM is highly dependent on the collaborative efforts of various teams involved in the approach, especially the sales team. 42% cannot effectively run their ABM program as they find it difficult to align their sales and marketing teams. Meanwhile 86.7% of marketers that utilize multi-touch attribution state that they have a good relationship with their sales team. Why is this? This is because of the lack of shared data and leads. A majority of MQL or marketing qualified leads that pass-through sales teams get disqualified. Only a small percentage (27%) of those leads turn to SQL or sales qualified leads due to not getting a hold of the right stakeholder or decision-maker in the purchase decision. As mentioned earlier, r attribution streamlines this problem through multi-stakeholder tracking aligning MQLs with SQLs. Revenue attribution also enables better communication between the teams through reporting. Through revenue attribution, marketers can report on revenue numbers instead of other marketing vanity metrics.
Implementation
The problem with implementing attribution in ABM is starting out. Laying the groundwork for attribution is usually a trial-and-error process if you want to find the most efficient way to utilize attribution. Deriving an attribution strategy, deciding on what models to implement, testing other models, etc., are all common problems faced when implementing attribution into anything. These are inevitable and will cost money and time. In order to stay one step ahead of the game there is a way in which a marketer can anticipate preferred campaigns by targeted accounts and stakeholders. It is through the use of intent data. Regardless of the manner through which it is obtained, it can be very insightful for understanding the channels your targeted account stakeholder is deriving their buyer intent from. This data will prove to be useful in the formation of your attribution models as will be able to premeditate your own channel activity due to the information obtained through the intent data.
Once you have laid the groundwork. It is time to start tracking your engagement. Using multi-channel or multi-touch attribution makes a big difference. Considering the proportion of the investment and the degree of personalisation being used in your account-based engagement, single-touch models will not do an effective job attributing all of your activities — keep in mind that this is dependent on several factors like the number of channels, opportunity cost of channels, the channel intent, etc. In fact, a lot of marketers focus on bottom-of-the-funnel attribution investing in sales enablement to convert customers, while not realising that there are so many other factors to consider. The goal here is to organise your customers into accounts and map out the complete customer journey through the pipeline of said accounts. Pairing this with data obtained from your tech stack will enable you to identify the stakeholders involved in buying decisions within each account.
As mentioned earlier the functionality of ABM is heavily reliant on the collaborative work of other departments, and the same holds true with the use of revenue attribution. While the use of revenue attribution itself facilitates this alignment, that alone should not give you a reason to disregard it. Ensuring that both the marketing and sales teams are working with the same metrics and also the same stakeholders play a vital role in your ABM’s campaign success. Revenue attribution tools also benefit from data across teams, as mentioned earlier, the utilisation of your tech stack which would include things like your sales data and CRM data, etc., are essential in the functionality of your revenue attribution in ABM.
Challenges with ABM and Attribution
A lot of the challenges that arise from attributing ABM have to do with problems and mistakes marketers face when using attribution. Finding the most efficient model that is applicable for your ideal customer profile is not an easy task and has several hurdles. Identifying stakeholders will also only get more difficult considering the constant increase of the number of stakeholders involved in a B2B buyer decision due to sales cycles becoming increasingly bigger in size. Multi-touch attribution, in general, is a complicated and tedious process with more complex channels arising convoluting the entire journey. To overcome this, advancements in marketing technology have enabled us to accompany the right attribution tool that consolidates complex information into useful insights that will save time and effort in practice. Better yet, an AI-powered attribution tool that will eliminate the skill gap required to effectively utilize an attribution tool. With all the necessary tools and know-how available, you should be well equipped in attributing your account-based marketing.

