Factors Blog
Insights Across All Things B2B Account Intelligence & Analytics
.webp)
Build Vs. Buy for B2B Marketing Analytics (Part 2)
The following is the second half of a two-part series about the factors involved in building and buying a B2B marketing analytics and attribution solution. This post deals with the cost and time requirements for an in-house and an off-the-shelf solution. It also compares the opportunity costs of building and buying a solution.
Be sure to check out part one which talks about the need for a B2B marketing analytics and revenue attribution solution. Along with a breakdown of the technical requirements for each solution.
Costs Involved
This segment is an overview of the costs involved in building an in-house B2B marketing analytics and revenue attribution solution. While there are certainly other costs involves, we cover 5 of the most prominent ones:
· Cost of ETL
· Cost of Data Warehousing
· Cost of Data Processing
· Cost of Data Visualization
· Cost of Staff
Cost of ETL
Extract, Transform and Load (ETL). Extracting structured or unstructured data from a source — this could be data from your CRM or Google Ads. Transforming includes processes like cleaning, duplication, sorting, etc. and ensuring data integrity and compatibility. Loading involves placing all of the transformed data into a data repository or a data warehouse. The data could be either loaded completely or at predetermined intervals.
This is the cost of maintaining a data pipeline. While it is possible for your engineering team to set up a data pipeline, some companies find it cost effective to use an ETL tool. These tools include tools such as Hevo, Fivetran, Google Dataflow, Pentaho, etc.
Fivetran, foe example, lists a range of pricing tiers. The starter tier’s price (which is for a small team’s data stack or the bare minimum for an in-house solution), would depend on the number of rows you update. This will range anywhere from 2 million total rows at a monthly estimated fee of $120, to 500 million total rows at an estimated $4,628 per month.
Cost of Data Warehousing
In the previous blog we talked about the need for a data warehouse from an analytics perspective. We discussed why relying on application databases is not scalable. While you could invest in a local data warehouse, there are a multitude of benefits to investing in a cloud data warehouse. Ultimately, this will prove to be convenient when building an in-house solution. Scaling operations would be expensive as it requires more ram (and in all likelihood, a dedicated database manager). That being said, cloud-based data warehouses like Google Cloud Storage, AWS Redshift, Microsoft Azure, and Snowflake fit the bill.
Cloud data warehouse storage prices vary depending on a range of factors. Google Cloud Storage, for example, has options varying in region and class — the class of storage, standard, nearline, coldline, and archive is determined by the frequency of access to the storage. In the region of US-central Iowa, at the standard class, warehousing will run you about $0.020 per GB per month.
Cost of Data Processing
Most cloud-based data warehouse services also include processing data. This is the cost to process SQL queries, scripts, functions, and more. This is in addition to the cost of loading data that you are processing in storage. Processing data is usually handled by a database management system like Bigquery, AWS Redshift, Oracle, Singlestore, etc. These services offer Cloud database as a service.
The cost involved in the pricing of these services includes the use of vCPU, Memory and cloud storage. Singlestore, for example, on its standard plan has a starting price of $0.65 per hour and will increase depending on the number of vCPUs and memory used. A vCPU of 16 and 128GB of memory will cost you $3,796 per month.
Cost of Data Visualization
In the previous blog, we talked about the presentation of your reports to your end-user. This requires a data visualization tool. A skilled engineer could purchase data visualization libraries and build them out. But for the sake of time, a lot of businesses resort to data visualization tools like Tableau, Looker, and PowerBI.
A data visualization tool like Tableau will cost you $70 per month per license.
Cost of Staff
Staff will, by far, be your most expensive costs. To build a marketing analytics and attribution in-house solution, you would at the very least require a small team of 3 full time data engineers and 1 data scientist. You will require experts with experience across programming language and ETL. In the US, the break down is as follows: on average a data engineer’s CTC is $116,772 per annum, along with a $5,000 cash bonus and other non-cash benefits as of 2022. The average CTC of a data scientist in the US will cost $102,865 as of 2022. (Indeed.com). These costs will have to be multiplied by the number of data engineers and scientists hired.
In terms of cost an off-the-shelf solution like Factor.ai will as of this date cost you $1,188 per annum on the starter plan which includes web analytics, multi-touch attribution, funnel mapping, Metric reports and more. Their growth plan on the other hand will cost you $5,988 an AI powered “Explain feature”, automated weekly insights and a dedicated customer success manager
Time
To build a fully operational in-house B2B marketing analytics and revenue attribution solution, with a team of 3 full time data engineers and 1 data scientist will take anywhere between 9 to 12 months.
An off-the-shelf solution like Factors.ai can be set-up in minutes. It requires no professional services for onboarding either.
So...Build or Buy?
Now, we're all caught up about the resources required to build an in-house B2B marketing analytics and attribution solution, as well as what to expect from an off-the-shelf solution. So should you build or buy? This section runs through the opportunity cost of building and buying. Essentially, what are you missing out by choosing whether to build or buy.
Opportunity Cost of Building:
By choosing to build an in-house solution you forgo the benefit of:
· The cost savings earned from buying a solution
· The time saved from not having to set up an in-house solution
· No-code integrations and developer dependency
· Maintenance and innovations handled by the service
· Using an advanced SDK, and not having to optimize SDK
· Data cleansing handled by the service
· Data visualization within the same product
· Unified Dashboard
Opportunity Cost of Buying:
By purchasing an off-the-shelf solution you incur the following opportunity costs:
· Product may not fulfill very unique analytics aspects of your business
· Product may not deliver on their promises
· Certain products may not fulfill your data privacy requirements (learn more)
· If a vendor liquidates or gets acquired, you cannot ensure data ownership and continuity of business
In Conclusion…
The most important point to take away from this is that when you build an in-house solution, you would have to weigh the risk of doing so. The average tenure of a CMO is about 40 months. Would they prefer to spend the first 9 to 12 months of their tenure waiting on a solution that isn’t proven to meet their need, or have a solution that is up and running within a week for a fraction of the cost of building one?
In my opinion there is too little to gain and a lot to lose when buying. Most of the opportunity costs of buying could be avoided with modern solutions like Factors.ai. Where custom plans can be built to fulfill your business’s unique needs. A demo of the product can be requested to ensure if the product delivers on its promise. Factors.ai uses first party cookies and is GDPR, CCPA, PECR and SOC2 compliant. And Factors.ai can send their client’s data to their Bigquery instance on demand giving full data ownership to the client.
Still on the fence? Book a demo with Factors.ai now.
Build Vs. Buy for B2B Marketing Analytics (Part I)
The following is a two-part blog on aiding your decision between building and buying a B2B marketing analytics and attribution solution. Part I deals with understanding the need for B2B marketing analytics and attribution. We also breakdown the technical requirements for an in-house solution, and what it would take for an off-the-shelf solution to deliver a similar experience.
Part II takes a logistical standpoint. There, we explain the practical resources required for a robust B2B marketing analytics and attribution solution. We also break down the opportunity cost of building and buying such a solution. Hopefully, this leaves you with valuable insights in cementing your build vs buy decision.
1. DEFINING THE NEED
Before we get into the nitty-gritty, we need to understand the need for marketing analytics and attribution under a business’s marketing function. This in turn necessitates the requirement of an off-the-shelf or in-house solution. This can be boiled down to two needs — tracking and optimization.
Tracking: In recent years, marketing has been losing its gravity as a core function of a business’s operations. As a result, justifying its revenue contribution is becoming increasingly vital. With lengthy B2B sales cycles that stretch across several months, waiting on revenue is simply not an option. This is where the use of marketing analytics with indicative metrics and KPIs (such as CPA, CTR, CPL, and web traffic analytics, etc) help in tracking and justifying the ROI of the marketing function before having to wait on your closed-won revenue contribution.
Optimisation: The optimisation need can be summarized as the need to quantify performance at a channel/campaign level and determine what to invest more or less in. Multi-touch attribution is used to facilitate this need. The requirement to optimize B2B marketing efforts will vary depending on the length of your sales cycle — but is nonetheless indispensable. Attribution is a tentative requirement, while Tracking is usually an everyday thing.
2. UNDERSTANDING YOUR REQUIREMENTS
Now that we have defined the need for a marketing analytics and attribution solution, choosing to build or buy comes next. The problem here is acknowledging that when you’re considering a solution, different marketers have different needs and resources. While some marketers only need the bare minimum, others may opt for more sophisticated solutions.
The presupposition here is that the following part of the blog on your technical requirements will always highlight more than just the bare minimum, while also zeroing on what an off-the-shelf alternative has to offer.
TECHNICAL REQUIREMENTS
Tracking and Collection
Your primary requirement for an in-house marketing analytics and attribution solution is to track user data and user interactions. There is a wide array of data that is to be tracked — page views, URL changes, web events, web sessions, CTAs, button interactions, form downloads, demo scheduled, and more. While you could limit what you track, it’s always advisable to track as much as you possibly can, as long as it is relevant to your analytics.
Ideally, your in-house solution should be able to track all of the above. There are two ways of building this. You could either opt for a CDP like Segment to automatically collect this data or construct a solution with developer dependency.
The developer will need to be able to create an event into your analytics stack every time an action occurs. The biggest concern with this approach is that it is risky. Especially when there are changes on the website, as it is too meticulous to be able to scale. That being said, you want to have a solution where your marketing team is not too dependent on your engineering team. Else this will only cause more harm than good.
SDK Requirements
The general concern with using an SDK is understanding that it will have to work with different website frameworks — like single-page applications (SPC) and normal web applications. Additionally, as websites are developed using different technologies like React JS, WordPress, CMS HubSpot, you’ll have to ensure that your SDK is sufficiently compatible.
Your SDK will need to be fine-tuned to be able to send data to your server. Webpages have to load A LOT of content including images, animations, text, etc. Your SDK will need to be able to capture events and put them in a queue to be sent at a later time. It will also have to be optimized for different internet speeds — mobile internet vs broadband. These factors should not be taken for granted. Failing to optimize your SDK could either crash the client website or result in the collection of incomplete data. Your goal here is to engineer a light yet effective SDK that captures and sends data without a compromise on user load time.
Tools like Segment and Google Analytics will help you track the events. However, these solutions are not fully automated and will require developer dependency. Factors.ai is tailor-made for marketing analytics. We also facilitate an advanced SDK that empowers robust web tracking, zero developer dependency, and more.
Data Handling and Cleansing
For a marketing analytics use-case, your in-house solution will need to be able to handle different types of data. More specifically 3 types of data:
1. Campaign reports from ad platforms
2. Event tracking data from your website
3. Objects from your CRM
Your goal is to build a solution that can handle all 3 of these data types. Doing this will prove to be challenging. At a base level, you will need to understand the objects of your CRM and how they are connected. Salesforce, for example, records accounts, contacts, opportunities, leads, products, campaigns, users, and dashboards as their standard objects. You can also create custom objects. You will then need to model your web analytics events against the users on your CRM customer data. Not to mention a separate data stack for ads data from Facebook, LinkedIn, Google Ads etc.
Data cleansing could be best explained with an example: In most off-the-shelf web analytics solutions, a web session will have some parameters set to distinguish itself from other sessions. For example, when a user is inactive for more than 30 minutes on your website, it will be tracked as a new session. Another one is when a user visits your website through an ad and a session begins, but then clicks on another ad to the same site shortly after. In this case, they will be considered as separate sessions as they come from different ad sources.
In other words, designing web sessions based on a period of inactivity or distinct UTM parameters are examples of data cleansing. Failing to do this, and other such data cleansing practices, will result in a lot of nuanced difficulties.
While most off-the-shelf solutions will handle such cleansing and data categorization, note that most of these analytical solutions usually handle only one of the three data types. Factors.ai, on the other hand, consolidates all three.
Data Storage and Warehousing
As a business running data analytics, it is important to acknowledge that data warehousing is a core need. Unfortunately, companies that adopt a data warehousing solution are still in the minority. One could argue that they could rely on application databases. This, however, will result in processing constraints and logistical difficulties. Alternatively, most data warehousing solutions process analytical queries in a more effective, columnar fashion. They also serve as a centralized data hub for all your workflow data. Modern data warehouses also make it cost-effective to scale your data warehousing. Therefore, it would be preferable if your analytics solution had an export to a data warehouse like Google BigQuery.
Attribution and Presentation
The previous tracking and handling data requirements form the basis for a robust marketing and web analytics. But what about marketing attribution?
For an attribution solution, you will first have to refer to the contacts on your opportunity account in your CRM. Then identify all data touch-points you encountered with those contacts — these could be webinars attended, demos scheduled, white paper downloads, field events, etc. These are all website sessions that are driven from different ad campaigns, email campaigns, etc. After accumulating all this data over a certain time frame, there will be an X amount of opportunity value that can be attributed to these touch-points. You will have to credit them and to do that you can utilize several existing multi-touch attribution models — refer to this blog to learn more. You could even implement a custom model — for example a model that attributes more credits to contacts with job titles past a certain level, and fewer credits for one below that level.
Presenting your marketing analytics and attribution reports requires breaking down, summarizing, and visualizing an extensive amount of data. For this, you would have to set up a dashboard and operate a data visualization tool — like Tableau and Looker. This requires a fair amount of expertise to assemble. What makes this process challenging is building out all the SQL queries for these reports.
Ensuring the correct data and the right quantity of data is being delivered to your dashboard is key. An overcomplicated dashboard or several superfluous dashboards won’t run efficiently. Ideally, you don’t want your team of data engineers to be preoccupied with operating existing data pipelines.
Factors.ai comes with a powerful attribution engine. With it, you can use, compare, and customize several single-touch and multi-touch attribution models. Factors attributes touch points across ad platforms, website events, and CRM. Factors also supports real-time reports and insights, a unified and customizable dashboard, and a wide range of data visualization under one roof.
Maintenance
When you build an in-house marketing analytics and attribution solution, there is a need for continual maintenance to ensure operational efficiency. Especially the maintenance of integrations across your SDK, CRM, Ads platforms, API version updates, etc.
Optimizing your SDK from an engineering perspective as mentioned before is a trial-and-error process. You will have to adjust your data pipeline to effectively deliver data to your dashboards. You’ll even have to keep your techstack up to date. Not to mention that there will always be tech debt and bugs to troubleshoot over time. This is never a one-and-done situation. As time passes you would have to modify your queries while you bring in more data all while optimizing your process.
Integrations, data concerns, troubleshooting and all of the aforementioned maintenance can be administered without developer dependency with Factors.ai.
3. INTERPRETATION
The purpose of part I is to illustrate the challenges in setting up the technical requirements for building a solution — optimizing your SDK, building a data layer and a solution that is compatible with all types of data, building a solution that can export to a data warehouse, assembling a dashboard, maintenance, etc. This way you can have a fair idea of not only what to decide on, build or buy. But also know what to look for when opting for an off-the-shelf solution.
If you were looking for a comprehensive conclusion, then look no further than part two. The next part highlights the opportunity costs for an in-house and off-the-shelf solution and takes into account the cost, time, planning, and even the technical requirements of this piece.

B2B Marketing Budget 2022
Most B2B marketers will accept that the success of any marketing plan depends crucially on marketing budget allocation. It is the key to effective strategy implementation. The best-laid plans fall short if you do not have the right resources in the right places. Strategic budget allocation is necessary to make the move from meetings to real execution, iteration, and conversions. The following post discusses best practices when constructing a B2B marketing budget.
Why is marketing budget allocation core to marketing’s success?
Considering that all budgets come with the caveat of spending limits, getting your budget allocation right is key to having adequate reserves to efficiently implement plans. Marketers will often spend a lot of time validating their budgetary requirements because no organisation wants to misspend its revenue or capital. Resultantly, marketing budgets usually require inputs from multiple stakeholders across the organisation.
What should your marketing budget include?
Marketing budgets include everything that you and your team need to positively reach your target audience. This includes expenses related to campaigns, channels, platforms, wages, marketing technologies (CDPs, social media, data analytics, design, automation), advertising, PR, freelancers and consultants, conferences, trade shows, etc. Each of these elements needs to be accounted for in your budget with wriggle room for other revenue generation tactics.
How much should you spend on marketing?
Although the revenue spent on marketing differs a lot from industry to industry (and company to company), on average about 7-15% of a company’s revenue goes towards marketing. So all of your company’s unique requirements in terms of your revenue model, stage, funding, amongst other things factor into how much to spend on marketing. The ROI from your marketing activities also plays a role in budget allocation. As per a CMO survey conducted in 2019, on average, B2B firms allocate about 10-11% of the firm’s total budget toward marketing.
Another common question amongst marketers is: how to allocate across channels?
A common rule of thumb is the 70/20/10 rule-
- 70% of the marketing budget for channels goes towards proven strategies
- 20% of the budget for channels goes towards new strategies for growth
- 10% of the budget for channels goes towards experimentation with new or alternative channels as well as emerging channels.
How to create a marketing budget?
1. Establish your overall marketing goals
The first step to creating a budget is to determine your overall marketing goals. This involves setting your larger strategy and breaking it down to substeps. Make the steps you need to reach these goals as detailed as possible and determine the overall length or schedule of the plan. They say that the overall strategy and all its steps need to be specific, measurable, attainable, relevant, and time-bound (SMART). Elaborating on the acronym SMART and determining goals for each term is a preferred place to start.
2. Outline your plan for the year
The second step to creating your budget involves outlining the plan for the year for which you are budgeting. This involves determining the channels and strategies to be used over the year and includes SEO, PPC, web redesigns, social media, new employments — connect them with your overall marketing goals. Essentially, if the previous step is determining the long term goals, this step is all about determining your yearly goals.
3. Determine your budget
In the third step, you determine the spending to be allocated for each element of your strategy (marketing channels, SEO, PPC, etc). The process involves looking at past data of expenses to get a comprehensive roadmap of how much to allocate and then calculating the future expenses in light of your current goals. Calculate the expected costs for each initiative, account for potential expenses that could occur. Finally, divide the total budget into quarterly and monthly budgets.
4. Allocation
Allocation of the marketing budget across various channels, platforms, human resources, tools, and other marketing spending is where best practices come into play. Being efficient when determining how much to spend and what to spend is essential to reaching your marketing goals and getting in that ROI. We’ll be exploring the best strategies and practices for allocation in the next section.
5. Track your progress + Refine your strategy
This step becomes important during the actual implementation of the year’s marketing plans. Tracking your marketing activities in tandem with your budget is crucial in ensuring that you’re hitting your goals. If you find that your predictions don’t align with your actual outcomes, you can fine-tune or rework your plans to course-correct them. A marketing budget tracker essentially helps you see how your marketing plan is progressing. Moreover, comparing your progress against the predetermined goals helps ascertain the efficiency of the plan. To track progress on channels, channel-specific data like number of users, clicks on ads, website traffic, number of forms filled, registrations for webinars, downloads for whitepapers and more, can be used to check if your spends are giving you the desired returns.
6. Measure the ROI
Ultimately, your budget was created to improve revenue. So, apart from tracking your marketing budget and channel-specific metrics, one must also track and measure the ROI — this helps to see how successfully the marketing plan is progressing. If the money spent on items in the marketing plan is bringing in more returns, you can increase the budget allocation for that item next year. Vice-versa for items that are bringing in low returns.
Best practices for marketing budget allocation
Allocate more budget where you have a larger audience
A key step to creating a good budget is knowing your buyer’s journey — that is the steps that your potential customer takes on their journey from being a prospect to a paying customer. Understanding your buyer’s journey will give you key insights into which platforms and channels work best to reach your ICP (ideal customer profile), what forms of marketing ads and social media platforms your target audience prefers, and how they interact with your marketing. A few important questions to ask is how do your customers come across your product or service? What information do they need before they make their purchasing decisions? What is the cost of generating new leads and conversions? What is the revenue from each lead? — answering these questions can help you know where to allocate your budget and to better reach your customers.
The best way to ensure your buyer’s journey and what channels and touchpoints are more efficient is by investing in a good attribution system — may it be an in-house system or an attribution tool that saves both the time and effort that goes into mapping a customer journey so that the marketing team can focus on the strategy and execution of marketing’s goals.
Diversify your strategy with multi-channel campaigns + Experimentation
In the previous point, we mentioned the importance of allocating more funds to channels and platforms where your audience already exists or has a proven success rate. However, the world of digital marketing is ever dynamic with new channels and audience migrations being a regular phenomenon. In that case, diversifying your strategy with omnichannel campaigns becomes extremely important. The previously discussed 70/20/10 rule for channels is a good rule of thumb to ensure that all your eggs are not in one basket and your campaign strategies remain forward-looking.
Look out for hidden marketing costs
If you’re not careful with budget tracking and keeping an eye on where your money is going it is easy to miss out on marketing costs that may not be very evident to the campaign. Spending on product launches, promotional activities, market research, etc are critical in shaping campaigns and it is a good idea to account for additional marketing tactics.
Leverage your data: use data-driven marketing to guide your decisions
We spoke about using previous years’ data while determining your budget. However, apart from past data, the current data from tracking your metrics can be useful in determining what’s working and what isn’t. If something is not working, it is okay to cut losses and redirect those funds to strategies that are performing well. A data-driven marketing approach can help with efficient budget breakdowns as well as with course corrections where necessary. Use all the metrics available to determine the best channels as well as the potential of emerging channels.
Prioritise BO-FU marketing: this can minimise risk and improve your chances of better returns (ROI)
Prioritising BoFu (Bottom of the Funnel) marketing can minimise the risk and improve your chances of better returns or ROI as this involves targeting the bottom of the conversion funnel. The audience here is in that part in their buyer journey where they are closer to becoming paying customers and have higher intents for purchase. Ensuring that you allocate enough resources to BoFu marketing helps increase potential ROI and also minimises the risk associated with spending too much on the top of the funnel which is usually characterised by more misses than hits.
In Closing...
Budget allocation is a process that requires data and insights to figure out what channels should be allotted funds and how much. Relying on historical data and having a data-backed strategy is integral to getting desired returns from the budget allocated for marketing. Good attribution tools can simplify reporting for budgetary asks as well as clarify which channels and touchpoints are performing well and deserve more funds.
We hope this article helps you with your marketing budget allocation and helps you implement some time-worn budgeting best practices that can translate to better returns.

Measuring Marketing With Change Science (Part 1)
We all have heard the saying: “Change is the only constant,” which translates to the fact that everything changes, every time. While that is too philosophical, and since marketers – more so data-driven B2B marketers – are not really fans of philosophy, there is a need to “measure” change. And not just that, a business needs to “attribute”, “rank”, “predict”, “explain”, and hopefully even “bring about" change using data analytics. Since statistics is the mother of all real-world measurements, and probability is the grandmother thereof, the science of measuring change too lies somewhere close by.
Since surface (i.e., not deeply thought-out) definitions are easy to make but difficult to follow with real-world data, the real challenges are solved by taking support from the well-researched areas of data science and probability. One extreme is to discuss the topic of change with its extreme roots, but that could easily fill-up a book (which is under way), but we stick to measuring change w.r.t. marketing analytics.
The questions
The main questions from a marketing perspective are: “What main factors changed from last week to this?”, and “By how much did these main factors change?”. But before that, let us understand something even more basic.
Why to measure?
Marketers take various targeting decisions on a daily basis – which audience to target, how frequently, and with what kind of marketing campaigns. They also have to keep track of various prospective customers, their journey, their overall statistics, and most importantly, reasons why a particular technique worked (or didn’t work) – be it a campaign or a strategy. And there are various goals when it comes to marketing. While some techniques could be motivated towards increasing reach (where it’s important to maximize the number of eyeballs a webpage could get), others increase conversions (at various points in a funnel – form-fills, email cold/warm calls, prospects, pre-sales, sales, etc.).
The foregoing marketing goals are achieved by measuring both static marketing performances (i.e., what happened today / this week), and also more dynamic, time-aware ones. While analyzing performance over time is a comprehensive view of marketing goals’ achievements / shortcomings and hence makes it cumbersome to digest multiple metrics of interest in a single frame, summaries of the same are preferred. And one of the summaries of a dynamic measurement of marketing performance comes in the form of change – that is, what changed, by how much, and why. In this article, we would focus on measuring overall changes, and would dig deeper into measuring the causes for the same in a follow-up blog.
What to measure?
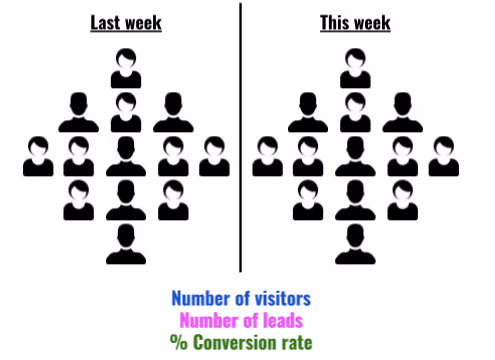
Based on the business requirements, marketers focus on tracking and eventually improving relevant KPIs (key performance indicators). For the scope of this article, we would explain change analysis taking the example of one important metric marketers are concerned about – the number of leads they generate every week. They achieve this by driving relevant visitors to their website every week. Any change in the number of leads that they get as compared to what they expected calls for an investigation on the reasons for the difference between expected and actual metrics.
Since the first step into any such investigation is to measure and compare (with last week) some global performance indicators measuring the reasons for change, the same is the focus of the current article. Hence, keeping a webpage in mind, we take the example of measuring the number of visitors (those who reached the website), the number of leads (visitors who reached target), and the conversion rate therefrom (leads per visitor).
When we perform these measurements for two given periods of time (say consecutive weeks), we could compare them. Let V1, L1, and C1 represent the number of visitors, number of leads, and conversion rate of week 1 respectively, and let V2, L2, and C2 represent the same measurements from week 2.
How to measure?
The four simple change measurements one could perform are the following:
- Total change: This is the most basic measurement of interest that preserves both the “unit” and the “sign” of change. For example, if the number of website visitors who filled out a form changed from 50 last week to 75 this week, we get an absolute change value as +25 form-fillers. In short, it answers the question: “How much more/less?”.
More formally though, one could measure absolute change in visitors (𝚫V = V2-V1), leads (𝚫L = L2-L1), and conversion rates (𝚫C = C2-C1). - Relative change: While absolute change remembers the unit of the entity one is measuring, it is – more often than not – more convenient to adopt a normalized change score. Taking the same example as before, change in the number of form fillers from 50 to 75 means a change value of +25, but the same is true if form-fillers had increased from 150 to 175 (viz., +25). What separates the two cases is relative change (i.e., how much did the unit change per unit original), which is +0.5 (=25/50) for the former (50→75), and +0.17 (=25/150) for the latter (150→175). The specialty of this score is that it remains a fraction between -1 and +1, and helps in comparing two “changes”. In a day-to-day language, a “percentage” variant of this metric is used by marketers.
Again, a formal representation of relative change in visitors (𝚫rV = 𝚫V / V1), leads (𝚫rL = 𝚫L / L1), and conversion rates (𝚫rC = 𝚫C / C1) would also help engrave the idea. - Percentage change: As described earlier, it’s easier to understand when one says “the number of visitors saw a 50% increase” (as opposed to saying the relative change of visitors was +0.5). Therefore, as a human-friendly change metric, the percentage variant is more popular than its math-friendly counterpart (relative change).
A notable caveat is as follows. “From X to zero” would mean a “100% decrease” (and vice-versa), but “from zero to X” turns out to be an “infinite% increase”, which is absurd. One workaround to rectify this is to call “from zero to X” as “from min to X”, where min could be set based on the metric of interest (e.g., min could be just 1). Another workaround is to call “from zero to X” as a “100% increase”. Another interesting point is that “no change”, it’s called a “0% change” – even if it is “from zero to zero”.
From the perspective of our current example, percentage change in visitors (𝚫pV = 100 x 𝚫rV), leads (𝚫pL = 100 x 𝚫rL), and conversion rates (𝚫pC = 100 x 𝚫rC) could be computed by simply multiplying the relative change by 100. - Factor change: Some marketers (and sometimes marketers) like to express change in percentage differences, and sometimes in factor increments/decrements (and some do both), and this is purely a personal/company-wide choice. Picking the same example from above, whether it is convenient to say “the visitors increased by 50%” or “this week’s visitors are 1.5x last week’s” differs from use-case to use-case, but is only a different way of expressing relative change.
Although one has to be cautious, however.
- “1x” means no change (a “0% change”). For example 100→100, 1→1, 0→0, etc.
- “0x” means a “100% decrease”, from, say 100 to 0, 5 to 0, but not from 0 to 0 (since we choose to call it a “1x” change.
- “2x” means a “100% increase”.
- “1.5x” means a “50% increase”.
- In general, “kx” means a “100*(k-1)% increase/decrease”, where it’s an increase when k > 1 and a decrease when k < 1.
- When saying “kx”, k never goes negative.
Going by the earlier example of website visitors, we could be interested in the factor change in number of visitors, (𝚫fV = V2 / V1), leads (𝚫fL = L2 / L1), and conversion rates (𝚫fC = C2 / C1).
Measuring overall change
Depending upon the business and the audience, there are multiple combinations of possibilities. We only cover some of them, summarizing overall (global) change. And as mentioned earlier, our next article on this topic would dive deeper into digging up the “reasons that drive this overall change.”
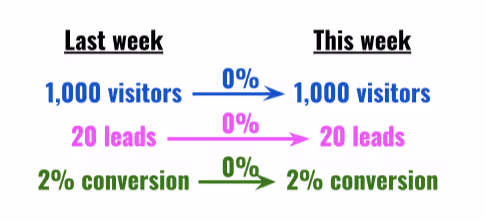
No change
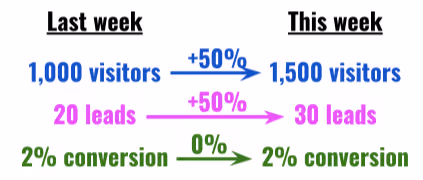
Let us start with a simple world, and slowly drift towards complex scenarios. Suppose our website had 1,000 unique visitors last week, and 1,000 new unique visitors this week (i.e., there was no change in the number of visitors). Of the 1,000 users last week, 20 signed-up for our newsletter, and the same trend continued this week as well. In other words, both last week’s and this week’s conversion rate was 2% (20*100/1,000). What does this tell us about this week’s performance over last? That it remained the same! In other words, there was a 0% increase/decrease in both reach and lead conversion rate.
Proportionate increase in visitors & leads
Now, if we had more visitors (say 1,500) this week as compared to the last, with a proportionate increase in leads so as to maintain the 2% conversion rate, it would amount to a 50% increase in visitors and leads, but a 0% change in conversion rate.
Increased leads, retained visitor count
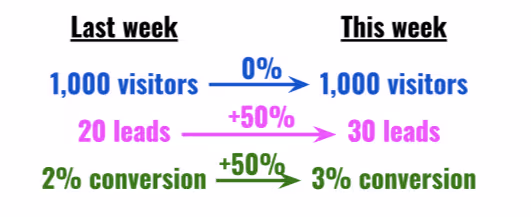
On the other hand, if the total number of visitors had remained the same, and leads would have increased by 50%, this would increase the conversion rate by 50%.
Increased visitors, no change in leads
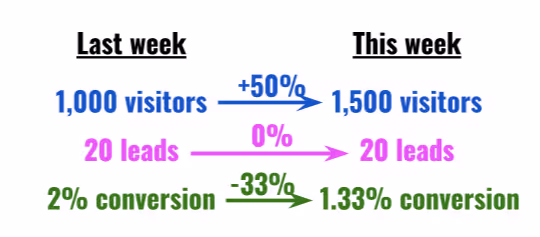
If, however, the number of leads would have remained the same despite an increase in visitors (by, say, 50%), we would see a 33% fall in conversion rate.
Disproportionate increase in visitors & leads
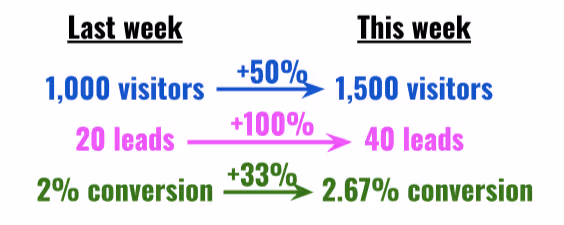
It is also possible that the number of leads increased by a disproportionate amount, which led to an increase in conversion rate.
Measuring change factors
We just discussed how measuring overall change is straightforward: simply report the signed/relative/percentage difference or factor change in visits, leads, and conversion ratio between the two weeks. But this is only half battle won. What is ideal is to measure the “causes” for the change. For example, we know that a 2x increase in visitors (V2 = 2V1) and 1.5x increase in leads (L2 = 1.5L1) – and hence a 25% drop in conversion rate (C2 = L2/V2 = 0.75L1/V1 = 0.75C1) – happened. But why it happened is one of the most important questions change science has to answer.
What causes change?
A seasoned marketer can quickly understand the main factors that led to a drop or a rise in scale (#visitors) or conversion (leads/visitor). But where data analysis comes in is in short-listing such factors from the rest, and hence help the marketer with her weekly (or periodic) decisions. In this article we only give an intuitive idea of what causes change (and how we measure it). In part 2 of this series on Change Science, we discuss the exact procedures and methods to measure factors that cause change periodically.
The more we know about our customers, the more our analysis benefits. While measuring change, as it was mentioned above, we usually track the number of visitors (V), the number of leads (L), and the respective conversion ratio (C). Along with mere counts, one ought to measure the profiles of such visitors and leads – in both weeks. For example, with a 2x and 1.5x raises in visitors and leads, to know what caused it, one has to track how the properties of visitors and leads have changed. The properties we are referring to are usual user/event based properties – from simple demographic ones such as Location (country, city, etc.), User Agent (browser, OS, etc.), etc. to marketing-oriented ones such as Referrer (domain, campaign, etc.) – along with their values (a “property=value” combination looks like “country=India”, for example). In summary, in addition to tracking overall statistics (visitor and lead counts), we also track counts “grouped-by” their properties.
Needless to mention, such properties are too many to count, and property=value combinations are even more. This is where Factors.AI comes in. We track-down each factor, measure the change attributed to the factor, and surface top insights. And we repeat the process for any event pair combination (in say, a funnel), for every property, and for every consecutive period of interest. We urge you to follow-up with us in the next article that describes how exactly we surface the main change factors via our very own Weekly Insights feature.
Stay tuned.

The State Of B2B Marketing Data Privacy
It’s no secret that data privacy is a macro trend that’s here to stay, and with good reason. As social interactions and business operations increasingly take place in digital spaces, users are rightfully concerned about the safety of their sensitive information.
Accordingly, government bodies and security experts have established comprehensive privacy guidelines to ensure the protection of user data. Privacy laws such as GDPR, CCPA, and PECR limit the extent to which websites and businesses can track user activity without explicit consent. While there’s no doubt that this is a win for end users, it may seem like a cause for concern to data-driven marketing teams.
In fact, 73% of GTM teams believe that data privacy regulations will negatively affect their analytical approach to marketing. This article highlights why this is not necessarily true. Let’s explore how privacy-first solutions like Factors empower data-driven marketers to flourish in 2024 and beyond.
Marketers need data. Here’s why.
Marketers need data to understand and improve the customer experience. This, in turn, results in better conversions and revenue. With data, analytics, and testing marketers can target the right audience with the right message and persuade prospects to become customers. Ideally, it's a win-win situation: marketers spend their budgets efficiently on campaigns that work, and buyers receive relevant promotions as opposed to spammy, spray & pray advertising. In truth, this is nothing new.

Data has been leveraged by marketers and advertisers since the days of Ogilvy, and with sweeping digital transformation, data tracking has become all the more prevalent. For example, mobile phones today constantly transmit precise gro location as a common user identifier across consumer apps. In comparison, B2B tracking has remained relatively benign — yet effective. B2B marketers have the ability to identify companies visiting their website, track their page visits, scroll depth, and other noninvasive metrics to be able to understand and improve the customer experience.
The dawn of privacy-first analytics
So far, this sounds great. However, while the intention with which marketers collect data is rarely malicious, the tools and techniques used in this process have been, until recently, without guardrails.
Fortunately, we’ve been seeing a dramatic improvement in data privacy and security in recent years. Today, privacy-first marketing intelligence and analytics tools (Like Factors 😉) honor privacy principles to ensure that data is used only for its intended purpose — to improve the customer experience. Even widely used tools like Google Analytics are having to rework their architecture to comply with regulations.
With tools like Factors, there’s no risk of data being collected without consent, shared with third-parties, or sold to advertisers. Even with this secure approach, marketers can continue to access everything they need to discover new prospects and optimize their performance without intruding on privacy.
The most important aspect for marketers is to be able to draw the line between reasonable and intrusive tracking. Collection of PII without consent or the ability to identify individual users across websites is illegal and would fall under the latter. As an important practice, marketers should vet their technology vendors keeping this in mind.
That being said, Factors and other privacy-compliant tools are secure by design. Customer information is protected without compromise on the quality of data, analytics, or insights derived. The following sections cover the basics of what you need to know about the most important marketing data privacy regulations — each of which should be considered when investing in marketing technologies.
1. First-party cookies
First-party and third-party cookies play important roles in the collection of user information. Here’s a quick overview of what cookies are and how first-party and third-party cookies differ from each other.
Cookies or HTTP cookies are tiny pieces of data that are sent to your browser from a web server. This data is stored locally on your device so that the next time you visit a website, it can identify you as the same user. So what’s the difference between first and third party cookies?
First-party cookies: FPC are set directly by the website you are browsing. Their primary purpose is to collect analytics data such as page views, button clicks, and form submissions to improve website functionality and enhance user experience. Without first-party cookies, a user would have to sign in to an account every time they visit a new page on the website or app. Even the most basic preferences like language setting would have to be reconfigured on every page without first-party cookies. In short, they’re entirely harmless and collect basic website data to help marketers eliminate areas of friction and improve website usability.
Third-party cookies: Third-party cookies are tracker cookies which are set by third-party servers (or ad servers) independent of the website a user is browsing. Third-party cookies are accessible to any website that can load the server’s script. More often than not, these cookies are used for unsolicited advertising and are set by ad networks like Google’s AdSense program.
Websites that accommodate ad spaces from servers such as Google’s “DoubleClick” also allow them to place third-party cookies. These cookies can track your browser history and identify interests to facilitate retargeting. That way, when you visit a website that also hosts a similar ad server, it will display a targeted advertisement using the same third-party cookies.

Factors.ai only uses first-party cookies to enhance your user experience with zero intention in building an interest profile or a third-party context with first-party cookies. More information on the usage of cookies here. Third party cookies are generally considered to be questionable and in some countries, illegal. This is because there’s no certainty as to what data these cookies are collecting and how that data is being used. Accordingly, it’s best to avoid tools that use third party cookies.
By design, Factors only uses first-party cookies to track visitor activity and enhance user experience. Tools like Factors have no ownership rights over your user data. They do not share or monetize first-party data collected from users in any way, shape or form.
2. GDPR Compliance
GDPR (General Data Protection Regulation)
General Data Protection Regulation is a privacy regulation standard that covers data protection andp privacy in the EU and European Economic Area. Under this regulation, businesses are required to receive voluntary or opt-in consent to collect personal information of customers, which needs to be clear and unambiguous.
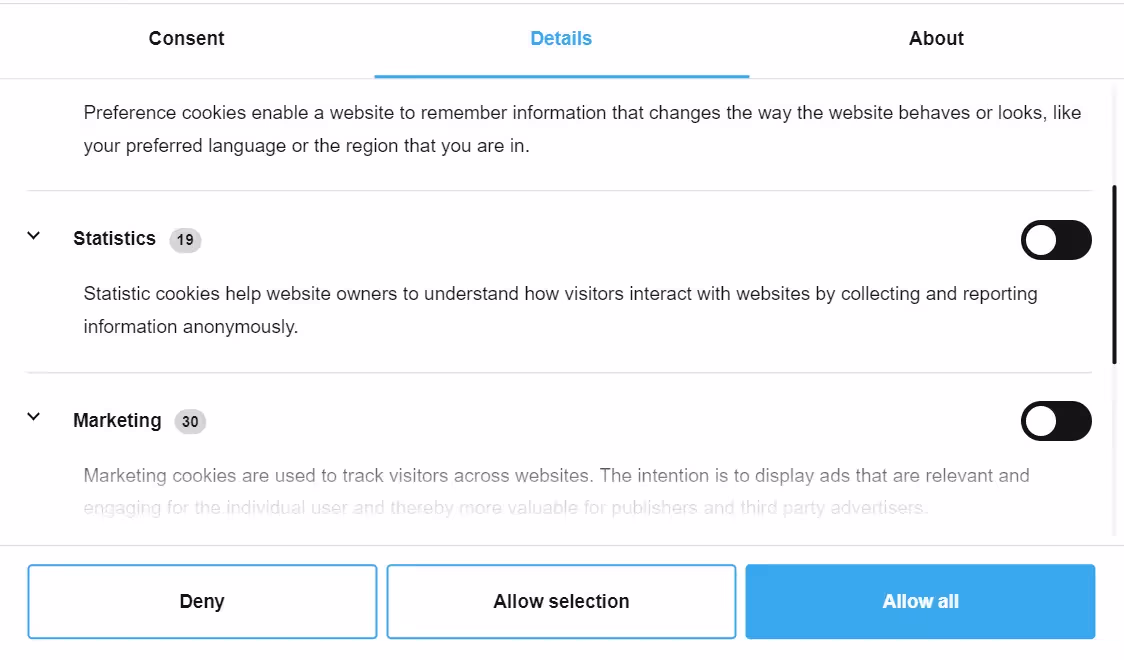
Personal information is defined by the GDPR as “any information which is related to an identified or identifiable natural person”. Information like IP addresses or any other data that can be traced back to a person is required for analytical purposes will require the user’s consent under the GDPR. This is why you may have noticed several privacy-compliant websites request consent on tracking personal information when you visit.
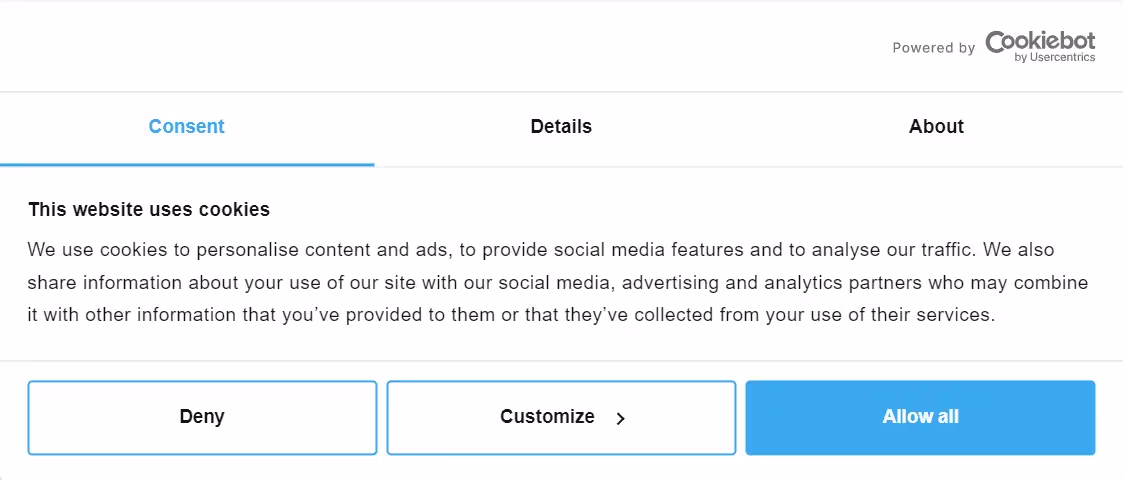
It is important to note that the consent of collecting personal information cannot be preordained or implied like in the form of pre-ticked boxes. Instead, the user must choose to opt-in to the collection of data and provide adequate detail on the information being tracked.
When complying with the GDPR, businesses must also comply with a set of rights with regards to personal information being collected. These include:
- The right to disclose and access the information collected
- The right to request for a correction of the information
- The right to request the erasure of personal information
- The right to register a complaint on the handling of personal information
- The right to request a restriction in the processing of personal information
- The right to object to the method in which your information is being processed
- The right to retrieve personal information and transfer it to another party, and
- The right not to be subject to a decision that is based on automated processing and has an adverse legal effect on the user
Factors is aligned with GDPR rules and regulations. At present, Factors stores its data in US-based cloud-company servers. Note that the GDPR does not mandate the storage of data of EU citizens and residents within the EU. Additionally, while Factors collects IP addresses for high-level enrichment such as coarse geolocation (city, state-level) and account identification, this data is purged. We do not store IP or firmographic data in our database.
CCPA (California Consumer Privacy Act)
The California Consumer Privacy Act is a state-wide data privacy law that regulates how organizations handle personal information (PI) of California residents. Under the CCPA, the collection of personal information does not require opt-in consent for adults. That being said, just like the GDPR, users under the CCPA have the right to access personal information being collected and the right to opt out of the sale of personal data to third parties.
Factors is CCPA compliant. In fact, by design, we do not have the ability to share, sell, or store personal data to third parties.
PECR (Privacy and Electronic Communications Regulations)
The Privacy and Electronic Communications Regulations (PECR) represents the UK's law on how businesses are allowed to market to UK consumers using electronic technology. This regulation deals with unsolicited marketing, which includes things like cold calls, fax, text and emails, etc. PECR does not apply to solicited marketing — or marketing messages that are voluntarily requested. Even if a person has opted-in for marketing from your businesses, there are still instances that are defined as unsolicited, which would have to comply with PECR. As a marketer that relies on email marketing, detailed information on the consent must be provided to the person you are emailing. Consent must be received in the form of an action, whether it is written or ticked on a box.
The rules of PECR slightly differ for B2B, where there is an exception to retrieving consent for emails and text messages. If you intend on the processing of personal information of corporate subscribers (B2B) or/and individual subscribers (B2C), the rules of UK GDPR apply.
Surprise, surprise — Factors is also aligned with PECR regulations.
SOC2 Compliance
While marketing under the aforementioned regulations would advocate a fair degree of privacy assurance to your users and necessitates consent. A Service Organization Controls 2 or SOC 2 compliance raises the stakes on the safety and confidentiality of customer data. SOC 2 is a set of criteria that define how a business should go about managing customer data and the examination of relevant controls in accordance with those criteria. While it is not legislation for data privacy, an SOC2 certification is the cherry on top of your data privacy practices and the forefront of establishing security standards as a part of being a privacy-first organization. It works on 5 trust principles:
- Security: This involves the use of tools such as application firewalls and two-factor authentication for the protection against unauthorized access of systems.
- Availability: This refers to the software, systems, or information that is available and is being maintained at a minimum acceptable performance level.
- Processing integrity: This ensures that a system completes its objectives in a valid, timely and authorized manner with no errors in the system processing.
- Confidentiality: Using encryption and limited access of data to ensure its disclosure is only restricted to a few people.
- Privacy: This refers to the personal information of the system that is being collected, retained, used, disclosed and disposed of in compliance with the organization’s privacy notice and GAPP (Generally Accepted Privacy Principles).
Factors.ai is also SOC2 compliant.
Playing the long game — B2B Marketing Privacy In 2024 & Beyond
As more intent and uses of personal information by businesses get discovered, postmodern norms for regulation on the safe collection of data gets more rigid. Falling short on the compliance of these regulations will lead to the obstruction of marketing efforts. Here are some reasons as to why marketers should consider becoming privacy-first:
- Data privacy and being privacy-first is bound to become an industry standard for marketing considering that web analytics is more of a necessity than a value adding requirement.
- The legality of data privacy regulations will severely affect the operational efficiency, and even the going concern of the business. Data privacy under legislation is an obligation.
- The conception of regulation for data collected and processed by artificial intelligence caused by an inevitable surge in automated workload is well underway.
Today, Google Analytics is illegal in Austria, Italy, Sweden, Denmark, and other European countries because the CLOUD Act allows US authorities to demand personal data from Google, Facebook, Amazon, and other US providers — even when they’re operating in external locations (like the EU). Regulation will only get more stringent — like the new revisions of the CCPA under the CPRA which goes into more detail on the sharing or disclosure of personal information. Being compliant early will help you stay ahead of the game.
More businesses will need to prioritize being privacy-first by building a decision framework around the management of personal information. This means making data privacy, its regulation, and the control of user data for the long haul the cornerstone of your business and marketing efforts.

Revenue Intelligence is Changing B2B Marketing
In this article we’ll cover,
1. What is Revenue Intelligence?
2. Why are teams increasingly opting for Revenue Intelligence?
3. Revenue Intelligence to Optimize Conversions
- Breaking down silos between marketing and sales
- Solves for uncaptured data
- Solves for outdated and stale data
- Targeting entire accounts with ABM
- Give sales leaders total visibility/Access to the larger picture
- Accelerate sales cycles with more efficiency
- Forecasting
4. The Emergence of Revenue Operations and Intelligence (RO&I)
Revenue intelligence (RI) is a popular buzzword in today’s marketing landscape. This enthusiasm may be warranted. RI is revealing itself to be a powerful tool for marketing and sales teams to derive powerful data insights that were hitherto unforeseen. RI uses AI to gather data that would otherwise remain uncaptured.
Let’s start with an example.
GrowNow is a marketing agency for start-ups. They focus on both digital and event services. Their content team has put out several articles on how marketers should approach scaling at various stages of growth.
Akshat is the marketing head of Company X that has a fintech product. They’ve found their product-market fit and now they are looking to scale. He is searching online for ways to scale marketing and branding efforts. He comes across GrowNow’s website and finds the information that he is looking for.
He is not a lead yet but marketing has the information on how he came upon the website and what pages he’s engaged with. He finds his way back to the website a few days later whilst searching for more information on what tech stack his team would need. He downloads a free report on GrowNow’s website on the latest trends in martech.
Finally, after a few weeks, Akshat comes back to GrowNow’s website, this time with a direct search and the intent to check out the services that GrowNow provides. He even fills a form for a preliminary call.
Now that Akshat has been converted, he is pushed to Sales and GrowNow’s CRM has the information that he filled on the form: his name, email address, title and company. They might also have other information like the report downloaded by him. Marketing directs a few more adverts towards Akshat over the next few weeks. Soon sales gets on call with Akshat, they use this information to convert him and they are successful.
Later on, Deepti, the CEO of clothing brand Y which has several pop-up stores finds GrowNow in an article on up-and-coming marketing agencies and clicks on the link which redirects her to their website. She spends some time looking through the website and fills a form. On receiving a call from an SDR, she learns more about their services. Marketing continues to send the same adverts based on Deepti’s website activity. However, after a few calls, they quickly realise that Company Y and GrowNow do not have a good fit. Sales had the same basic information about Deepti as they did with Akshat.
Both Akshat and Deepti’s customer journeys were a little different which sales were unable to access — like the data on their journeys pre-form fills. Similarly, marketing was unable to personalise websites based on Deepti and Akshat’s activities once they went down the funnel to SDRs. This in part, came about due to different locations of this data. Marketing has its data on first touch, web pages visited, time spent on webpages, adverts clicked on Google Analytics or other marketing platform while sales has its data on its CRM like Salesforce. Both departments were unable to access the other’s platform nor did they have an integration in place that allows for seamless flow of this information.
This is where Revenue Intelligence comes in.
What is Revenue Intelligence?
In its simplest terms, revenue intelligence refers to the process of leveraging AI to collect, sync and analyse data across sales, marketing and customer success to produce critical insights and generate revenue.
It is a powerful revenue operations tool that helps companies bring synergy between their customer-facing teams (marketing, sales and customer success) and make decisions that are powered by metrics.
Why are teams increasingly opting for Revenue Intelligence?
More and more companies are increasingly realising the limitations of human intelligence in identifying important data points as well as the limitations on relying only on CRM data for insights on customer journeys.
The solution to this, has been to look at AI to collate and identify data that humans cannot. Furthermore, RI helps teams coordinate and capture data at the right time, before data decay diminishes value -
1. Breaking down the silos between marketing, sales and customer success
Data silo is a problem when there is a lack of seamless coordination between teams, especially in terms of data collection and storage. A huge chunk of insights get lost when the data captured by these teams remains limited to their own teams. This is propelled by storing of data on different locations and difficulty in cross-departmental access of this data. All three of these departments are interacting with customers and have intelligence on customer trends and opportunities that get lost with interdepartmental misalignment with data getting siloed.
A revenue intelligence system captures and integrates the data from all these teams in real-time and creates a single, consolidated platform for the entire organisation. This ensures that everyone is on the same page and allows for seamless coordination between teams that helps create a unified strategy.
2. Solves for uncaptured data
Sales and customer success teams have to manually enter customer data like contacts, engagements, etc into their CRM. Two problems arise with this:
1. Manually entering data for each and every customer interaction is time consuming.
2. This leads to negligence as many sales and customer success fail to enter all a lot of this data. Around 55% of salespeople admit that they do not enter all lead and customer data.
Resultantly, a lot of available data remains uncaptured and the company relies on this incomplete data for reporting, planning and forecasting.
RI solves for uncaptured data by automatically capturing contacts and engagements data from all customer facing teams, solving for both time and incomplete data, leading to more accurate and reliable sales reporting and forecasting.
3. Solves for outdated and stale data
Sales and marketing data is susceptible to becoming stale.
Relying on manually entered contact details and the fact that people change jobs and positions and do not update their linkedin profiles leads to databases and CRMs being outdated and filled with errors. Good, high intent leads are very critical for both sales and marketing to reach their conversion goals.
Then there is also the consideration for the hidden cost of redundant data. Bad or outdated data can muddle up research, competitiveness and accuracy of forecasts. Poor data leads to the wastage of sales’s time and IT’s time in syncing systems. It causes frustration when data-backed decisions fail to execute results.
RI solves for this by automatically tracking and updating changes to the leads in the CRM. This ensures more up-to-date and reliable prospect data.
Revenue Intelligence To Optimize Conversions
1. Capturing missing sales activity
We’ve spoken about the problems of unco-ordination and data silos between sales and marketing. When marketing is unable to access sales data, it prevents potential for improving marking activity and checking for inefficiencies in the existing process. As discussed earlier on the Factors Blog, getting multitudes of leads won't have a positive impact on revenue unless they are good, qualified leads. Infact, it may just lead to a waste of the sales efforts. In such a case, RI helps marketing access sales data that is pertinent for marketing’s processes and planning for more efficient campaigns.
Auto-creating of leads based on sales’ experiences, auto-removal of leads that sales has already dealt with or are low-intent based on previous experiences — both lead to coordination of data as well as a more seamless process of lead identification and capturing of contacts.
Furthermore, automated opportunity association of leads and tracking of interactions (emails, meetings, etc) helps get more insights from available data.
2. Attributing Marketing Touchpoints
Apart from sending better leads to sales, RI also helps paint a clearer picture of how marketing is helping sales acquire leads that lead to conversions. This helps in both having a better understanding of customer journeys and measuring the impact of marketing in the organisation’s overall functioning.
Revenue intelligence helps with marketing attribution reports that highlight marketings total impact, impact in each channel and the creation of first-touch, last-touch and multi-touch reports. RI also simplifies visualising the opportunity journey with easy spotting of marketing email and campaign touchpoints and deal updates as leads move through the funnel.
3. Enhances ABM
Revenue Intelligence helps optimise ABM by improving the data quality of the contacts that are captured for the various accounts. With automation, more contacts can be captured. These contacts are also of better quality due to the improved tracking of customer engagements.
RI also allows you to pursue better personalisation and target marketing efforts based on an account’s firmographic features and funnel position. So teams can get more meaningful insights from CRM and build improved target account audiences.
4. Giving sales leaders access to the larger picture
RI helps sales leaders have a better understanding of the customer journey and gain insights into the prospects that are coming in. Furthermore, having a real-time system of data relating to sales helps with insights into the sales process.
5. Improved sales pipeline
Better prospects, higher intent leads determined based on historical and real-time data improves the quality of leads entering the sales pipeline which in turn leads to higher conversions. Apart from higher output, RI also helps SDRs close deals faster and improve productivity.
6. Forecasting
Revenue Intelligence helps sales forecasting by solving for outdated and uncaptured data to improve the reliability and accuracy of predictions.
The Emergence of Revenue Operations and Intelligence (RO&I)
RO&I is a tech category that leverages AI to perform the principal task of revenue operations: integrating sales, marketing and customer success. In other words, RO&I is technology that allows the integration of sales technology, marketing technology and customer success technology to provide an end-to-end solution from customer acquisition to retention and expansion.
Revenue Intelligence tools help teams get the best out of revenue intelligence and empower their Rev Ops efforts with better data and more improved efficiency in mapping customer journeys. Knowing when to reach out to potential customers with the right information at the right time is critical to improving experience and conversions.
.webp)
Challenges with B2B Attribution (And How to Get Over them)
Outline:
- Introduction
- What is B2B Marketing Attribution and how is it different from B2C Marketing Attribution?
- 7 Challenges with B2B marketing attribution
- Tracking The Website Activity And Identifying Users Using Form Submissions,
- Identifying Accounts On The Website Even For Anonymous Users Using A Reverse IP Solution.
- Stitching Website Data With Map And Crm Data Using Email Ids (Specifically Unifying CRM Data Across Objects - Lead, Contact, Campaign Member, Activities Into A Single Timeline)
- Tracking And Defining Offline Touchpoints At The Same Level As Digital Marketing Touchpoints
- Long Sales Cycles Implying Need To Track This Data Over Many Months And Years
- Sales Marketing Alignment - Bringing In Sales Data
- Ability To Do All Of This At An Account Level
- Takeaway
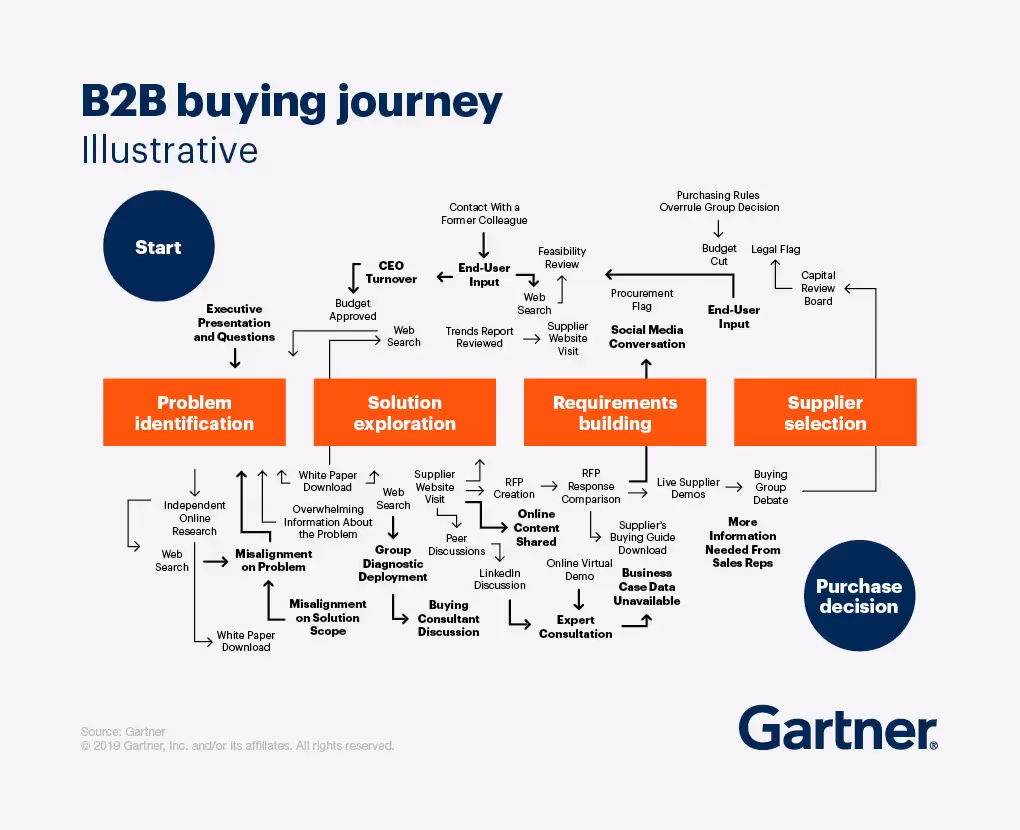
The B2B customer journey includes multiple people and touchpoints in the decision-making process.
On average, 6 to 10 people are involved in the B2B buying process. And for 33% of B2B organizations, the sales cycle is extended beyond six months.
Overwhelming, isn't it?
In a B2B business, there are multiple stakeholders at different stages in the buying journey. And it is essential to have content that appeals to them. Hence it becomes hard to build content pieces that provide educational value.
However, it is not an excuse that hinders your growth. In this blog, we will discuss the seven main challenges with B2B attribution and how factors can help overcome them.
How Is B2B Marketing Attribution Different From B2C Marketing Attribution?
71% of Marketers believe optimizing the customer journey across multiple channels and interactions is crucial. This optimization can improve customer satisfaction and drive business growth.
However, 50% of B2B marketers report limitations with their current analytics solutions. These reports are not providing them with adequate visibility into what channels or campaigns work best.
The following are two reasons why traditional marketing analytics solutions fail to achieve this.
- Multiple stakeholders are involved in decision-making, and the buying journey is non-linear. It makes it difficult to predict the impact of marketing-driven interactions.
- Sales cycles are longer and involve multiple online & offline touchpoints for educating and influencing the buyer's decision.
Let's understand this with an example.
A customer journey for a B2C brand that is selling chocolates will look like this:
Clicks on an Instagram ad → go to the website→ to make a purchase. (Yes, that's it!)
On the other hand, a B2B customer's journey will look something like this.
Visit website→Read product reviews→Attend a webinar→Engage with a sales representative→Make a purchase decision. [For example's purpose only]
Now, from the customer journey, it is clear that it has both online and offline touchpoints. A more detailed depiction of a customer journey in the B2b business is added below for your reference.
Furthermore, users now tend to browse anonymously, making it harder to piece together the accurate buying journey. Website Visitor identification capabilities can help throw light on these otherwise untrackable touchpoints.
Challenges With B2B Attribution
Here are the seven challenges faced by the marketing teams with B2B attribution and how to overcome them.
1. Tracking Website Activity And Identifying Users
- How many people visit my website, and who are they?
- Which page are they landing on?
- Which content is driving maximum engagement?
- Which traffic sources - campaigns, referrals are driving high-quality traffic to the website?
These are some of the questions that cross the mind of a B2B marketer. Websites are the sales epicenters for B2B marketers. Why? Because all the lead generation and conversions happen via the website.
At every stage of the buying journey, your prospects are consuming your content and comparing it with your competitors. They want to understand whether you can solve their problems faster and better.
So, it is vital for you to track and identify the website visitors to prepare customer-centric marketing strategies. However, tracking a user's journey from the first interaction to conversion across months is a technically complex task. It includes
- Managing cookies,
- Tracking traffic sources via utm parameters, referral parameters, or click ids,
- And stitching that with the respective ad platforms.
How Can Factors.ai Help?
Factors.ai is an analytics solution purpose-built for B2B marketers. It has an inbuilt capability to track a user's journey from the first interaction to conversion and beyond.
The solution is configurable, wherein marketers can set up their utm definitions and channel configurations. It also comes with the following
- Ability to track utm parameters and click ids.
- Native integrations with the main ad platforms, providing a cost-to-revenue view seamlessly.
2. Website Visitor Identification
The key to driving effective marketing is targeting the right audience with the right message at the right time.
And data is what you need to convert the hot lead! The more you know about your prospect, the more you can personalize their experience.
However, collecting user data is challenging for the B2B segment. According to a report by 6sense, only 3% of B2B website visitors will fill out any form. And the rest, 97% of them, will be labeled as anonymous traffic.
But it would be misleading to say that 97% of anonymous users did not influence the decision-making process of the known 3% of users.
Let's unpack this with an example now.
For instance, six people from the same company visited your website, but only 1 filled out the demo form. Therefore, attributing all the marketing efforts to that single identified person and his touchpoints will be wrong.
All the users from that account and the campaigns/content they interacted with should be considered when building an attribution model.
How Can Factors.ai Help?
Collecting user data is crucial. But you can do that only with their consent, which means your anonymous visitors stay hidden. Therefore, you need a solution that tracks the data on the website, even for anonymous users.
Factors.ai has an OEM partnership with 6sense to provide the best-in-class visitor identification to its customers. Thus, stitching together the entire account journey across all users.
They use a reverse IP solution and get data on an account level rather than at an individual level. It further enables you to understand the companies the users are from and know more about your anonymous users.
3. Putting The User Data In One Place
B2B Marketers today leverage multiple channels to promote content downloads, webinar registrations, and demo requests. It helps them engage buyers as per their preferences.
However, with many campaigns, ads, and other marketing activities happening simultaneously, it becomes challenging for marketers to measure the influence of each of these efforts on pipeline and revenue. In many cases, the customer journey is siloed across multiple tools. For example, the Marketing Automation Platform captures the website activity, while CRM captures the post-sales hand-off events.
Most Marketing Automation Platforms also are not sophisticated to capture traffic sources accurately. Furthermore, CRMs keep the user data fragmented across multiple objects such as Leads, Contacts, Campaign Members, and Activities.
Hence, it isn't feasible to stitch together the user journey across all these tools at an account level. Therefore, to make result-oriented marketing strategies, you need to unify this data - both at a user level and then at an account level.
How Can Factors.ai Help?
Factors.ai has out-of-the-box integrations with Marketing Automation and CRM platforms. And it can stitch all data with the website activity based on the user's email ID.
Also, Factors pulls in all the engagement data across both Hubspot and Salesforce across individual objects.
For example, in Hubspot, Factors can pull in the Contact, Engagement, Form Submission, and Add to List activities. Within Salesforce, Factors unifies data across Lead, Contact, Campaign Member, and Activity objects.
It makes it easy for the decision-makers to get a 360-degree unified view of customer activities and behavior in one platform.
4. Tracking And Defining Offline Touchpoints At The Same Level As Digital Marketing Touchpoints
Both online and offline touchpoints are equally involved in the lead acquisition process. Hence, B2B marketers need to track them in a single timeline.
Online touchpoints are easier to track through the well-established digital marketing ecosystem. However, offline touchpoints like events, workshops, meetings, and direct mail are difficult to keep track of.
Therefore you need a solution that allows you to keep track of both touchpoints simultaneously and build an exhaustive account timeline.
How Can Factors.ai Help?
Factors automatically track offline touchpoints, which are recorded in the MAP or the CRM.
Further, Factors allows you to configure and define your offline touchpoints with a simple UI. It enables Marketers to map all their touchpoints at a user and account level for making data-driven decisions.
5. Long Sales Cycles Implying the Need To Track This Data Over Many Months And Years
Longer sales cycles are one of the unfortunate realities of the B2B buying journey. Due to the multiple stakeholders involved and shifting priorities, most buyers take much longer to make a purchase decision. On average, a customer conducts nearly twelve searches before interacting with a brand.
With this and the complexity involved in the decision-making process, it becomes challenging to accelerate the sales cycle. As a result, the customers could take weeks, months, or even years to close the deal size.
Therefore B2B organizations would need a solution that can manage voluminous data running into many years of interactions with their prospects.
How Can Factors.ai Help?
Factors.ai allows you to keep a record of all the interactions across all the platforms, like websites and campaigns, within one platform. In addition, you can seamlessly store data for an extended period (no limits) and reflect back on it at any point to decide what really helped.
6. Sales Marketing Alignment - Bringing In Sales Data
An alignment between marketing and sales can maximize the ROI of a business. But this alignment between the teams is often absent in B2B businesses. Each team believes their efforts were the reason for closing a deal, which could be one reason for this.
Emphasizing that each team is part of a larger go-to-market function is one way to make them work together.
Once you form a synchronization between them, it will allow the marketing heads to get a unified overview of the data across both marketing and sales touchpoints.
Furthermore, each team can review and analyze the attribution data to see which of their strategies are working and which are not.
How Can Factors.ai Help?
Factors.ai pulls in all your sales interactions from the CRM and treats them at par with marketing touchpoints. And it also provides a clear and consistent view of the customer journey. On top of the unified data foundation, both teams can get answers to questions such as;
- How many touchpoints did it take to convert a deal?
- How many of these were sales vs. marketing touchpoints?
- Were marketing efforts able to drive engagement with the right stakeholders in these accounts?
- When is the right time for sales teams to intervene to convert an account?
7. Ability To Do All Of This At An Account (company) Level
The most significant pain point of B2B marketers is the involvement of multiple stakeholders in decision-making.
The person who made the purchase is not usually the one who initiated the process of buying the product. Instead, multiple people across different departments (technical support, finance, marketing) must have come across the different stages of the buying journey.
The traditional methodology would want you to attribute all the credits to the person who bought the product. It makes sense because he is bringing in the revenue.
However, tracking customer journeys at an account (company) level rather than at an individual-level is what your attribution strategy requires.
How Can Factors.ai Help?
Factors.ai will give insights at a granular level by breaking down the customer journey at the account level. It will simplify and visualize the customer journey by giving you an optimized overview of every touchpoint that drives the velocity of conversions & pipeline.
Do B2B Marketing Attribution The Right Way!
To keep up with the competitive marketplace, you need a differentiated analytics tool that helps you connect the dots from initial interaction to conversion.
While B2B Attribution is technically and organizationally a complex problem, overcoming these challenges is critical to ensure your efforts are well directed. Hence tools like Factors.ai can tremendously simplify the B2B attribution process and elevate your ROI. To get your B2B marketing attribution game on point and cost-effective, sign up now for a free demo today.

Optimizing ABM with Revenue Attribution
In an age where the functionality of the B2B marketing landscape becomes increasingly volatile, account-based marketing (ABM) and Revenue Attribution rise to the occasion. The adoption of ABM as an alternative to traditional demand generation is becoming progressively prevalent in the B2B space. Despite its increased use in recent times, the conception of several new and complex channels is promoting the need for ABM practitioners to be able to appraise their investments and optimise their ABM strategies. The incorporation of Revenue attribution in account-based marketing deciphers this challenge.
Understanding Account Based Marketing
What is ABM?
Account-based marketing or ABM is a strategic marketing approach wherein marketing resources and campaign efforts are directed towards targeted/key customer accounts. More specifically, ABM earmarks Ideal Client Profiles (ICPs) that would generate the most revenue.
ABM is known to be collaborative in nature, as most functional ABM efforts work in conjunction with other teams such as sales, operations, customer success, etc. This collaborative work is done during the earlier and final stages of ABM, the former of which involves scrutinizing your target accounts by soliciting the data (i.e. profitability, ACV, retention rates of customers, technographic characteristics etc) in order to build your ideal customer profile. With this data, one can identify target accounts as well as target contacts within those accounts.
While businesses *could* work with this list of prospects, most marketers further compartmentalize these accounts and contacts into tiers that rank prospects based on ratings assigned for revenue potential. This, ultimately, would help distinguish your marketing approaches — one-to-one, one-to-few, and one-to-many etc.
The final stages of ABM involve engaging with your preferred accounts. What’s important here is that you integrate other prominent teams like sales, customer success, and operations to ensure an aligned execution of efforts.
When is ABM Necessary?
Given the sheer magnitude of money, time, research, and personal campaigns invested into ABM, generating an ROI for your ABM strategy necessitates its investment. The problem is that the efficacy of your marketing efforts will not be the same for all key accounts, but that’s obvious. What’s noteworthy here is that your marketing efforts on key accounts should have the lowest risk and the highest viability. This however only becomes feasible depending on the quantity and mostly the quality of the target market. The higher the number of key accounts available to target, and the better the revenue potential of each key account, the more suitable ABM will become for your targeted accounts. There are a couple of ways in which you can measure this:
- Measuring the annual contract value of your key accounts will help gauge the potential ROI if you were to use ABM, the higher the better your ROI.
- For account quantity, a larger number of key accounts accumulated is preferable — if ABM is your main/exclusive marketing strategy — as they increase the probability of lead generation per account.
- The TAM or total addressable market will help you gauge if your target market is too broad or narrow for a manageable audience for personalized marketing efforts, the smaller the size of the TAM the more serviceable the personalized engagement becomes.
The Relevance of ABM
While account based-marketing is not a novel strategy, its emergence over the last couple of years has been excellent thanks to its adaptation to technology, automation, and the utilisation of tools by an increasing number of businesses. Enabling better synergy for its collaborative prospects as discussed earlier.
As of 2021, over 70% of marketers reported the use of ABM, 15% of whom grew from the previous year alone.This is owing to an overhaul of your standard marketing approaches partly as a consequence of the global pandemic causing a loss in value for traditional lead generation and volume-oriented targeting. What made ABM stand out is its versatility and its adaptability to its customer needs. This is because ABM focuses more on quality than the quantity of your broader customer base. Prioritising retention and marketing efforts on their targeted accounts instead of a broader miscellaneous customer base that would have a higher chance of disqualification. The businesses that utilised ABM before and during the COVID-19 outbreak, adapted to the changes — relating to industries like tourism and food service that took a hit based on PD — by reconstructing their key accounts and ideal customer profiles based on new factors, showcasing its versatility and popularity in choice in a changing economic climate.
Attributing ABM
How does Revenue Attribution enhance ABM?
The following are ways in which revenue attribution can help overcome some of the shortcomings of ABM and maximise its utility in practice:
Measuring ABM Activities and Tracking ROI:
One of the core principles of ABM is that it prioritises and invests in appeasing your best revenue-generating key accounts through personalised engagement programs, this warrants the need to measure the engagement and campaign’s success. A common challenge in ABM and legacy ABM tools is that they fail to provide these insights. That being said, the utilisation of revenue attribution and attribution models accommodates this need as it provides insights into what channels drive revenue and can highlight poor performing channels and campaigns throughout all your key accounts’ pipelines. Tracking your account-based campaign’s ROI, and optimising your customer acquisition cost through those insights are all part of its preliminary functions. Not to mention, identifying a reliable cost per lead (CPL), allowing ABM practitioners to set a more practical CPL limit on their channels for their key accounts.
Key Account Mapping:
The steps involved in an ABM strategy are complex, yet straightforward. Your plan of action is to identify your ideal customer profile (ICP) and use that as a blueprint to locate your key accounts. But what about the people or stakeholders within an account? — 75% of ABM practitioners can’t find the right contacts at companies matching target profiles. And along comes the next challenge. How do we identify the stakeholders involved in the buying process? The solution to this problem involves rigorous research into key accounts and organisational structure. Revenue attribution embellishes this process thanks to its sheer detail in the compartmentalisation of the customer journey by analysing several touchpoints mapping out a multi-stakeholder journey. Highlighting all the stakeholders involved in the buying process, which will facilitate better planning by engaging with the right stakeholders and the optimisation of campaigns based on these insights.
Incorporating Data Attribution in ABM:
The incorporation of data attribution facilitates the ability to measure the impact of account-based activity over the lifecycle of your key accounts or customers and help increase the productivity of these activities. Identifying the right data using a few metrics will make it possible to understand if you have targeted the right accounts. For example, the progression rate and pipeline velocity will illustrate the rate or speed at which your MQL or marketing qualified leads among your key accounts move through the pipeline in their life cycles. But before doing so, it is imperative to associate the right data with your attribution. A lot of the data solicited through various touchpoints are unstructured, identifying intent and buyer interest using metrics such as bounce rate, click-through rate, lead conversion rate, etc., are all essential in data attribution.
Aligning Sales and Marketing:
The functionality of ABM is highly dependent on the collaborative efforts of various teams involved in the approach, especially the sales team. 42% cannot effectively run their ABM program as they find it difficult to align their sales and marketing teams. Meanwhile 86.7% of marketers that utilize multi-touch attribution state that they have a good relationship with their sales team. Why is this? This is because of the lack of shared data and leads. A majority of MQL or marketing qualified leads that pass-through sales teams get disqualified. Only a small percentage (27%) of those leads turn to SQL or sales qualified leads due to not getting a hold of the right stakeholder or decision-maker in the purchase decision. As mentioned earlier, r attribution streamlines this problem through multi-stakeholder tracking aligning MQLs with SQLs. Revenue attribution also enables better communication between the teams through reporting. Through revenue attribution, marketers can report on revenue numbers instead of other marketing vanity metrics.
Implementation
The problem with implementing attribution in ABM is starting out. Laying the groundwork for attribution is usually a trial-and-error process if you want to find the most efficient way to utilize attribution. Deriving an attribution strategy, deciding on what models to implement, testing other models, etc., are all common problems faced when implementing attribution into anything. These are inevitable and will cost money and time. In order to stay one step ahead of the game there is a way in which a marketer can anticipate preferred campaigns by targeted accounts and stakeholders. It is through the use of intent data. Regardless of the manner through which it is obtained, it can be very insightful for understanding the channels your targeted account stakeholder is deriving their buyer intent from. This data will prove to be useful in the formation of your attribution models as will be able to premeditate your own channel activity due to the information obtained through the intent data.
Once you have laid the groundwork. It is time to start tracking your engagement. Using multi-channel or multi-touch attribution makes a big difference. Considering the proportion of the investment and the degree of personalisation being used in your account-based engagement, single-touch models will not do an effective job attributing all of your activities — keep in mind that this is dependent on several factors like the number of channels, opportunity cost of channels, the channel intent, etc. In fact, a lot of marketers focus on bottom-of-the-funnel attribution investing in sales enablement to convert customers, while not realising that there are so many other factors to consider. The goal here is to organise your customers into accounts and map out the complete customer journey through the pipeline of said accounts. Pairing this with data obtained from your tech stack will enable you to identify the stakeholders involved in buying decisions within each account.
As mentioned earlier the functionality of ABM is heavily reliant on the collaborative work of other departments, and the same holds true with the use of revenue attribution. While the use of revenue attribution itself facilitates this alignment, that alone should not give you a reason to disregard it. Ensuring that both the marketing and sales teams are working with the same metrics and also the same stakeholders play a vital role in your ABM’s campaign success. Revenue attribution tools also benefit from data across teams, as mentioned earlier, the utilisation of your tech stack which would include things like your sales data and CRM data, etc., are essential in the functionality of your revenue attribution in ABM.
Challenges with ABM and Attribution
A lot of the challenges that arise from attributing ABM have to do with problems and mistakes marketers face when using attribution. Finding the most efficient model that is applicable for your ideal customer profile is not an easy task and has several hurdles. Identifying stakeholders will also only get more difficult considering the constant increase of the number of stakeholders involved in a B2B buyer decision due to sales cycles becoming increasingly bigger in size. Multi-touch attribution, in general, is a complicated and tedious process with more complex channels arising convoluting the entire journey. To overcome this, advancements in marketing technology have enabled us to accompany the right attribution tool that consolidates complex information into useful insights that will save time and effort in practice. Better yet, an AI-powered attribution tool that will eliminate the skill gap required to effectively utilize an attribution tool. With all the necessary tools and know-how available, you should be well equipped in attributing your account-based marketing.

8 Common Revenue Attribution Mistakes You Should Avoid
Marketing’s transformation from a cost-centre to a revenue powerhouse — coupled with a boom in digital channels — means that marketers, now more than ever, require a granular account of their influence on pipeline and revenue.
Enter: Revenue Attribution.
B2B companies are prioritizing revenue attribution to measure their marketing performance and ROI, and track customer journeys. In fact, 76% of all marketers find that they currently have or will have in the next 12 months, the capability to employ a robust revenue attribution platform (Think with Google). Conceptually, the function of attribution is straightforward, but there are several mistakes that could easily skew your results and limit your progress when it comes to accurate, actionable revenue attribution analysis.
With that in mind, here are 8 common mistakes to avoid for your revenue attribution regime:
1. A lack of an attribution strategy
Despite the automation solutions that are embedded in most attribution tools today, it becomes easy to forget that your input plays a huge part in producing relevant results. Formulating a strategy is essential in being able to derive actionable insights from your attribution. At the end of the day, the relevance of tracking different channels and campaigns in a customer’s conversion journey is incumbent upon you.
Get organised! Start by cataloguing relevant channels to track as per your conversion goals. Label your channels and campaigns and assign budgets so that all your data across all your tools is coherent. Tracking irrelevant channels (or not tracking relevant ones) is a part of trial and error, but reliance on such incomplete data is a big red flag. One common example of this is: tracking only the performance of ad campaigns without testing its performance relative to other channels.
Communicating with the appropriate personnel and others involved in the strategy to gain better insight on what to track and what not to is a good start.
2. Excessive reliance on preliminary revenue attribution models
The tendency to rely on preliminary attribution models — single-touch models like first and last touch or the popular last-click model — may produce quick and simple results to measure your ROI. This, however, can be an expensive mistake. Don’t get it twisted, single-touch models have their use cases — attributing PPC and short sales cycles to name a couple. But relying solely on preliminary models for all your marketing decisions will likely do more harm than good. Single-touch models are linear in nature, which is not conducive to most customer behaviour. Attribution is more effective when you strive to get as close as possible to analysing a customer’s journey across several touch-points. And having one touchpoint attributed to a customer’s conversion gives a vague, and often inaccurate, image of their journey.
3. Not testing multiple attribution models
This mistake is likely to be a consequence of the previous point — excessive reliance on preliminary models. But why is it important to test other models? When it comes to rule-based attribution and multi-touch attribution models, the general reasoning behind adopting a model is the nature of the product, the number of marketing channels, the length of the sales cycle, etc. While there’s nothing explicitly wrong with this, we cannot only rely on those factors.
There are several omitted variables around the intent of your attribution — measuring the functionality of different campaigns in conjunction with other channels, the relative probability of channel interaction, opportunity cost of campaigns, or just simply mapping out the most influential channel and ROI. Even the type of campaigns and the medium through which the customer interaction occurs could affect your decision in choosing a model. Some models are more applicable than others in producing reliable results, and the only way we’ll identify this is by testing out what works and what doesn’t.
4. Not understanding the limits of rule-based modelling
In practice, administering a combination of rule-based attribution and data-driven attribution is an effective way of producing reliable results. That being said, if you’re for the most part dependent on rule-based modelling, you’re unlikely to have transparent results. Rule-based modelling is limited, as the weights in the models would need to perfectly represent the influence of each channel in a customer’s conversion journey. This is highly unlikely as no two customers are the same. For example, a time decay attribution model will assign credits in ascending order regardless of the type of campaign or prospect’s actual behaviour. So, to help identify your most influential channels on average, data-driven attribution can be used to give credibility to different channels by assessing their KPI’s. This in turn will help you draft a custom model that makes sense to your attributing pattern.
5. Misaligning attribution data and customers/lead quality
In the pursuit of using your attribution data to aid your marketing decision making, sometimes you forget to categorize our data considering the customers involved or their lead quality. To make better sense out of your attribution data, we need to pair the interactions with customer IDs to avoid duplication of leads and accurate credit distribution across marketing channels.
Tracking our customers even helps assess the quality of their leads. What this means is some customers are likely to be more interactive and engaged with your brand than others. This even dictates if some of them become recurring customers or only ever interact with your business once. Tracking customer interactions helps you distinguish the quality of their leads. These values also contribute to calculating the LTV (Lifetime Value) of your customers.
6. Ignoring the bias
These mistakes have to do with certain biases that might compromise your decision-making pertaining to attribution. The most common ones are:
Correlation Bias
When attributing credit to different channels along your customer journey, there is a possibility for certain interactions to conceive other interactions (or at least a level of other interactions). One could over/underestimate the influence of channels with other channels simply because of the natural conversion of targeted customers. A conscious consideration of correlation vs causation must always be kept in mind.
Confirmation Bias
A confirmation bias is the proclivity to seek out information, and the interpretation of said information, to favour your results and personal beliefs. This type of bias is prevalent in attribution as it involves having to attribute your channels in accordance with the result that favour you. This would eliminate the organic element of attribution to favour your marketing ideals, ultimately leading to inaccurate findings and conclusions.
7. Failure to understand the channel intent
When you fail to recognize your channel’s intent, you fall short in gauging how much it facilitated a customer’s conversion. This could lead to poor decision making as a consequence. Some channels facilitate interactions with other channels more than they do sales — like a blog versus a targeted email campaign. Hence, it would be unfair to discredit the channels that did not directly contribute to sales — or other predominant goals — but probably contributed significantly to a customer’s decision to convert.
8. Attribution is not the Be-All End-All of your marketing analytics journey
As convenient and resourceful as attribution is, they will never provide a holistic, extensive picture. While attribution is valuable in showcasing a blueprint of your campaigns, channels, and marketing performance. You still require other analytics tools — Funnel analysis, Anomaly detection, SEO optimization, CRM, and other web analytics tools that help assess channels using premeditated metrics. These tools will ultimately compliment your data-driven attribution for a far more comprehensive analysis of your campaign and channel performance. In order to do this effectively, you will have to use these tools cooperatively and in real-time.
Acknowledging these limitations and making a conscious effort to mitigate them will help equip and optimize your marketing attribution journey. Don’t let the idea that there is so much that could go wrong make you apprehensive about trying out marketing attribution to begin with. Undoubtedly, it’s a steep learning curve, but the rewards far outweigh the risk involved.
And there you have it! If you’re interested in understanding how some of the most popular single-touch and multi-touch attribution models work, you might enjoy this blog piece.

KPIs Explained: Conversion Rates
Finding the Relevant KPIs for your Business
Identifying KPIs that are relevant to your marketing team depends on your particular type of business. For D2C businesses that sell directly to customers, website traffic and cart abandonment rate are two essential KPIs. The former helps guage how successfully a given marketing campaign is able to encourage customers to click on desired CTAs and advertisements, while the latter helps figure out possible pain points for customers that may be hindering their completion of purchases. If your cart abandonment rate is high, retargeting ads on customers’ social media feeds with their in-cart products can serve as useful reminders to complete a purchase. Alternatively, it can help identify customers’ pain points like contentions with shipping or exchange policies, pricing, etc. Such insights are useful in determining next steps. Similarly, for B2C companies, customer retention rate is an important KPI. Unlike B2B businesses, B2C deals seldom involve long term contracts and a continual inflow of revenue from paying customers. Finally, for B2B companies, a KPI like Customer Acquisition Cost (CAC) is a useful measure of the overall cost involved in onboarding a customer.
In this article however, we deal with a primary KPI(s) that impacts all businesses: Conversion Rates.
Conversion Rates
Conversion rates may refer to different concepts. It can mean conversions per activity; which measures how many customers perform the desired activity (clicking on an ad, signing up for a webinar, downloading a free booklet, etc) — all of which can be a part of an overarching campaign or strategy. Conversion per Activity is an important metric in it's own right when it comes to determining what works in your overall strategy.
While these activity conversions contribute to the ultimate success of the marketing campaign, the actual success is measured by sales conversions — How many people actually converted to paying customers?
Hence, conversion numbers usually fall into two categories:
Category 1: Lead Generation
These include conversions per activity, website traffic, social engagement, etc. Sometimes these indicators receive a bad rap for being some what superficial. However, they have their own value to marketers in understanding the overall efficacy of a strategy.
For example, Website traffic may not directly measure the impact of a strategy in acquiring new customers, but it can help determine impact of a strategy on brand awareness. This can be particularly useful when there is a strong correlation between awareness and sales. If 20% of your website traffic has converted to paying customers, improving the website traffic may have a positive impact on the final conversion numbers. Alternatively, if boosting website traffic does not seem to have any positive impact on sales, it can be a sign of potential customer pain points or inefficiencies in the overall marketing strategy.
Category 2: Sales Conversions
These are conversion metrics that measure for concrete, direct impacts on revenue. Here are three influential metrics to keep an eye out for:
I. Campaign Conversions or Conversions per Campaign:
This determines what percentage of traffic to a certain campaign landing page/webinar/new subscribers to a newsletter — turned into a customer.
How to measure: To find the campaign conversion rate, divide the traffic by the customers attributed to that traffic. For example, out of a 100 attendees to a webinar, 7 convert to paying customers, the conversion rate is 7%. Or if your ad had 200 interactions that can be tracked to 15 conversions, then you divide 15/200 to find the conversion rate of 7.5%.
Having a proper attribution model or platform in place is key to finding accuracy in such conversion numbers.
II. Website Conversion Rates:
It is safe to say that almost all B2B or D2C companies have websites which are their primary point of contact with potential and returning customers. So, the conversions from the website becomes an ultra important KPI. Although this indicator is calculated pretty much the same way as the campaign conversion ratio, it can get tricky as the customer journey gets complicated. There might be other touch points that impact the customer’s conversion decision even before they visit the website. Again, having a good attribution system is key to understanding the true impact of website traffic on conversions. It can help understand customer journeys and isolate the impact of the website on conversions. More importantly, it can help identify what works for the website and what doesn't. Insights like what pages converted users visited, how long they spent on those pages, what CTAs they acted on, etc can help figure out possible pain points and improve website conversions.
One thing to remember is that regardless of how customers make their way to the website and when they made the decision to buy, a website has important consequences for the conversion. In the digital age, a business’ website is essentially its storefront. It influences the customer’s perceptions and opinions of the business. In other words, it plays an important role in the customer journey. As such, the website conversion numbers are all too important to ignore for online businesses.
How to measure: The most common and direct way of measuring the website conversion rate is to divide the number of conversions in a given timeframe by the total number of people who visited the website in that timeframe. For example, if in the past week, a site had 100 visitors, and 10 visitors converted to customers, the website conversion rate is 10%.
III. Lead-to-Close Conversion Ratio:
The Lead-to-Close Conversion Ratio, more popularly known as CVR, measures the number of sales that were made in comparison to the total number of leads the marketing team started with. This indicator helps marketers focus not only on creating leads but also on actually closing them. In other words, it helps create quality leads who will actually make the purchase. The effectiveness of the various components of the marketing strategy can be measured with the CVR. It gives the all important insight of which campaigns convert leads to customers and which do not.
How to measure: Similar to the aforementioned, the CVR is calculated by dividing the number of sales by the number of leads generated. For example, if you started out with 1000 leads from webinar attendees or newsletter sign ups or holiday ad campaigns and 170 of them convert to paying customers then you have a CVR of 17%.p

Measuring the ROI of your B2B Content
If you find ROI measurement of your content marketing efforts a challenge, you’re not alone. Only 8% of B2B marketers believe they are successful at gauging their content's ROI and influence on revenue. With the content marketing industry constantly growing, making up between 25%-40% of B2B marketing budgets, it only seems fair to understand its metrics and incorporate ROI measurement into your content marketing strategy.
Ends That Justify Your Means — Why Do You Need To Measure Your Content Performance?
If It Won’t Convert, It Won’t Matter:
Content marketing has contributed substantially to the B2B marketing sphere. Blog posts, podcasts, infographics, etc. all play a major role in a business’s marketing efforts. But there’s a fine line between good content and content that promotes lead generation. The end goal of content marketing is generating traffic and influencing the conversion of said traffic. So, a conscious effort to measure your content helps lay the groundwork for a content marketing strategy that prioritises the goal and justifies the cost of doing so.
If It Does Convert, By How Much?
When it comes to B2B marketing, your prime audience is pretty specific. Hence, your content is likely to have a larger impact on pipeline and revenue. 71% of B2B customers consume a blog before making a purchase. Quantifying information like this is effective in distinguishing your leads from your sales. The difference and variety of metrics available for your content provide valuable insights. Understanding the extent to which each metric attributed your leads is an essential aspect of painting a clear picture of your ROI. A classic example of this is to resort to vanity metrics such as organic search traffic to evaluate your content’s success rather than its bounce rate or impressions made which are more conducive in assessing an MQL — marketing qualified lead.
What You Could Expect for The Future:
Trial and error is an expected component of your content marketing track record. The data you amass by monitoring your metrics will prove to be insightful in the formation of your content marketing strategy and budget — including the provision of answers to common questions like “what type of content generates the most traffic?” “Which content influences the most revenue and pipeline?” and “Which content had the most effective link building and/or SEO rankings?”
Understanding The Metrics
Historical Data and Monitoring:
A common barrier to entry for content marketing ROI is your access to customer historical data. To elaborate, your access to said data also includes the cost of acquiring it, the risk associated with losing it, and the availability of precise data when needed — relating to interactions with content. Most software available to track customer metrics like the touch attribution of content, the number of contacts from email, the revenue generated per customer, etc., are fragmented across different software with limited storage of customer data and are behind a paywall. There is even the risk of losing this data because of these stipulations. For this, it is recommended that businesses house their customer data using a data warehouse to retain the historical data of their customers and to use a customer data platform that will organise customer data and behaviour across various software in real-time into a comprehensive format suited for content ROI.
Lead Conversion:
The first step in measuring your content’s ROI is to establish what your lead conversion is. Or in other words, identify what customer action is considered a worthy result of your content’s purpose. This would vary depending on the product and what business it is being targeted to — so organising your leads or conversion goals in conjunction with your products is crucial. Some examples of conversion goals would be — signing into your website, downloading a demo, subscribing to a newsletter, or even a sale, etc.
Lead conversion rate: The number of leads relative to the number of visitors on a webpage. Divide the total number of leads by the total number of visitors.
Landing Page:
Your landing page is the first page of your website which is visited by a prospective customer. There are certain metrics that can be used to assess the attribution of your landing page to your conversion goal. Your landing page’s page views indicate the number of visits that have occurred on your landing page. The number of unique visitors helps you identify the number of people visiting your landing page, this is different from page views as it only counts the number of visitors and not the number of their visits.
Other useful metrics for evaluating attribution in your landing page include your bounce rate — which is the number of visitors that navigated out of your page after viewing only one page. Your average session duration is the average time lapsed during a session — a session being a user’s regular interactions — on your landing page. These metrics illustrate the authenticity of your content’s applicability for conversions.
Email Traffic:
81% of B2B marketers utilize email newsletters as a part of their content marketing strategy — making it the third most popular form of B2B content. If your business sends out newsletters, these metrics are important to track: An email’s open rate measures the percentage of emails opened, and if you link your content webpage in your email, a click-through rate distinguishes the number of users who’ve clicked on the aforementioned link and those who did not.
Social Media Traffic:
The most popular form of content (95%!) implemented in a content marketing strategy by B2B marketers is organic social media posts. On channels such as Twitter, LinkedIn, Instagram, and YouTube, Audience engagement on your posts in the form of Likes, Shares, Comments, and even Follows are useful metrics to assess the influence and engagement of your posts. Of course, click-through rate may be tracked as well.
The Nitty-Gritty — Measuring Your Content’s Influence and ROI:
Once we have gathered all the relevant data, we can now measure our content’s ROI. But before doing so, we need to assign a monetary value to your MQLs. If your conversion goal is a sale, then it is the revenue generated from that customer’s sale. If it is a campaign goal like demo scheduled, it is the forecasted revenue from prospective customers that’s most relevant.
Once this is established, organise this data in a coherent manner to measure its ROI. Start by isolating landing pages or content pages to measure them individually. Then we will allocate their respective data to them. For the sake of comparison and future content marketing strategy, it is imperative to distinguish your MQLs from your visitors. The last step is to assign your revenue to your MQLs, whether it be the revenue generated from sales or the forecasted revenue of a particular lead or conversion goal. And finally, we can calculate the ROI with our MQL revenue — the ROI calculation here would be the revenue generated from the MQL divided by the cost of production of the landing page’s content.
To illustrate — let’s say that you were measuring the ROI of one of your landing pages at the end of the month. Perhaps a blog in your payment gateway service company. Organically your blog has amassed 500 unique visitors, and around 300 through social media posts and email campaigns. Out of the 800 visitors, 60 of them signed up for a demo, whose forecasted revenue amounted to around $5000. Using the formula mentioned above and dividing the $5000 with the cost of the production of the content, you will measure your B2B content’s ROI.
Evidently, measuring the ROI of your B2B content is a tough nut to crack, and as I mentioned earlier, trial and error is an expected component of your content marketing track record. While quantifying your means will expedite your strategy, functional results take time and mistakes, and if you’re patient enough, they’ll yield.

How to go about Search Engine Optimization (SEO)
Search Engine Optimization
It is reported that 75% of users never visit the second page on their search results. As search results become increasingly concise and filtered, it’s easy to forget how ruthless and saturated search engine rankings can be. Hence, it isn’t an understatement that the accessibility of your page on a search engine should be an integral precursor for your marketing value proposition. Accordingly, marketers are prioritising SEO as part of their inbound efforts. This post expands upon the theory, practice, and importance of SEO in an ever-growing digital marketplace.
What is SEO?
SEO, or search engine optimization, refers to the process of increasing the likelihood of your website, content, product, etc. appearing close to the top of your SERP — search engine results page. The objective is to direct more traffic to your webpage by increasing its ranking on a user’s search engine index, either organically or with minimal monetary investment.
Search engine results page or SERP is a constantly evolving geography. Search results — especially those pertaining to inquiries now feature quick answers and knowledge panels that direct clicks away from low-ranked domains. For instance, if you were to google ‘marketing attribution’, you would be presented with a quick answer in the form of a short description directly below. Additionally, other relevant, consolidated information is presented on the right within knowledge panels. Note that Google and many other search engines prioritise having their users spend more time on their SERP without having them navigate away as much. This is why marketers need to capitalise on their rich results and SERP ranking.
CRAWLABILITY AND INDEXING
Before we look at what your search engine prioritizes when ranking, it’s well worth understanding what crawlers are and how search engine indexing works:
Crawling is the process of your search engine sending out crawlers, which are bots that are used to discover new web pages. The crawlers start by following a certain number of web pages followed by then routinely navigating content and new links within these web pages. Thereby discovering a series of new web pages which it reports back to its respective server. A website’s crawlability thus refers to a crawler’s viability in a website or web page. More on increasing crawlability below.
All this information that the crawlers obtain is then stored in a database known as a search engine index. The data is then organised, analysed, and prepped for retrieval on a search engine results page — this process is known as search engine indexing.
The Ranking Algorithm: PageRank
Before indexed information is retrieved into a search engine results page, it is ranked by several factors in order to obtain the most relevant sources of information. While this piece will cover some critical success factors for your SEO, it is important to understand that Google ranks their websites based on relevancy and an algorithm. Understanding the algorithm is fairly complicated as it is continually evolving. That being said, PageRank is an algorithm that is still being used by Google to rank websites and will help provide an idea of how the ranking algorithm works.
PageRank uses an algorithm that helps rank web pages based on their relative importance. It does this by estimating how many times a web page is visited or linked from other web pages and also measures the quality of these links. For example, your web page is more likely to be ranked higher if it is linked by relatively important web pages — like Forbes or the NYT — than it is if it was linked by many less "relevant" web pages — like The Onion or ArticleIFY.
The importance of a web page is assessed using a random surfer model and a damping factor that estimates how many times a web page is visited by a random surfer and assigns a percentage to all web pages visited. All you need to know is that the model and damping factor helps eliminate any way in which people can artificially inflate their web page’s importance.
SEO CSF — CRITICAL SUCCESS FACTORS
This segment will explain a few critical success factors for your SEO in the form of good keyword practices, indexing and crawlability, and more:
Keyword CSFs
Keywords play a surprisingly significant role when it comes to SERP ranking. Certain niche keywords could be the reason your web page is ranked higher in a SERP. But what keywords should you use? Before you choose your keywords, you need to establish your search intent. Understanding your web traffic, and what they’re looking for is key when it comes to search intent. Ask yourself what people would specifically search for and what words or phrases they’d use — for instance, 8% of all search queries are in the form of questions.
Once you have an idea of some appropriate keywords, it would help to know what their search volume is. You could administer the help of a keyword research tool — like Jaaxy, GrowthBar, SEMrush, Google Keyword Planner, etc., which are tools that help gauge how popular/relevant certain keywords are. They could even compare and recommend other related keywords.
The largest barrier here is the competition of high volume and short-tail keywords — or search phrases consisting of only one or two words. Industry-leading brands are often ranked higher for short-tailed keywords due to their relative importance. However, there are some advantages in using long-tail keywords (i.e. search phrases that are longer with three to five words). The consensus is that, while high volume and short-tail keywords tend to involve highly-competitive broad search queries, long-tail keywords account for more convertible traffic as their search phrases are specific. Hence, you’re likely to garner more traffic with niche low volume, long-tail keywords than if you were to compete using high volume keywords. For example, you’re more likely to earn traffic from a search phrase like ‘Accounts receivable automation software’ than you do for ‘Accounting software’. Remember, if your keywords are too obscure, you risk losing your spot on a SERP.
LSI or latent semantic indexing keywords may also be useful. LSI is a tool used by Google to understand synonyms and can contextualize keywords by linking them with relevant ones. This means that a synonym does not necessarily have to be an LSI keyword, and can be anything relevant in the context of your content. For instance, Googling ‘demand generation’ would have related searches for strategies and comparisons with lead generations. LSI has helped Google in identifying and contextualizing content on web pages better, which is a win when it comes to SEO.
Crawlability and Indexing CSFs
It is essential to know what affects your crawlability. The first is your site and internal link structure. It is imperative to make your search engine’s job of locating your site as easy as possible. For this, you must ensure that your site structure has an appealing UI and makes navigating across different pages intuitive. This way, crawlers will not find it difficult to get by. For the crawlers to do a comprehensive search on your website, ensure that a fair amount of internal link resources are prevalent for the crawlers to fully cover your website. It is also important to block crawlers’ access to irrelevant pages to avoid saturating the context of your content.
Besides your site and internal structure, making sure that other interferences such as slow site loading speeds are resolved as they add to the crawlability of your website. If you are unsure about your site’s visibility on a SERP, using tools like Google Search Console will help monitor your site’s presence on Google SERP.
Other Important CSFs
Recalling the mechanics of Google’s PageRank algorithm, you will know that your web pages’ networking with other pages is of paramount importance. Having external links from other sites that link to your site — especially higher quality links that come from important sites — along with understanding your competitors’ backlinks and utilizing them will help improve your ranking.
Rich results is a feature that showcases information that is not only important in giving a brief description to a user but also helps crawlers identify your site and the purpose of the content because of its metadata. Rich results have a title, meta description, favicon — and depending on what the page is about it could even show pricing, specifications, and a rating. All of which aid in the crawlability and a user’s understanding of the web page.
Another simple but effective factor is the quality of the content on your page. The use of unique, engaging, and informational content with ample visual representations in the form of high-quality images and video. Google prefers sites with content, and good content at that. The better the quality of the content is, the more favorable you become in Google’s algorithm.
With these factors in place, you’re one step ahead in your SEO journey. When it comes to SEO, being consistent, putting out new content, and following good practices will be sure to help out in the long run. Just remember that SEO is always changing, and if you want to take the bull by the horns — keep updating your methods, and stay ahead of the status quo.

