Factors Blog
Insights Across All Things B2B Account Intelligence & Analytics

6 Best Content Marketing Analytics Tools for SaaS Businesses (2023)
Drowning in data but thirsty for answers? We've been there. As content creators, we have numbers on clicks, views, bounce rates, and more.
But what we need is for that information to come together and show us what's working, what's not, and how to improve.
That's where content marketing analytics tools come in.
Content marketing analytics tools are digital platforms that help you understand how your content is performing. They provide insights into key metrics like site traffic, social media engagement, search rankings, and whether your content is driving conversions.
They help make sense of your content so you can optimize your content marketing strategy. They show key metrics like site traffic, social engagement, search performance, and whether your long blogs are converting readers.
But with many options, finding tools for B2B SaaS teams is hard. We've listed the top content marketing analytics tools to prove & improve the impact of content. These tools ensure you're making progress with your content, not just treading water. Let's get started!
tl;dr
- Content marketing analytics tools help SaaS businesses understand and optimize their content strategy.
- Key features in these tools include visualizations, customer journey insights, integrations, metric tracking, an intuitive user interface, customizable reporting options, and real-time analytics
- The 6 best content marketing analytics tools for SaaS include: Factors, Google Analytics, HubSpot, HockeyStack, Dreamdata, and Matomo
- The right content marketing analytics tool can make your decision-making and optimization efforts more streamlined and provide valuable insights into audience engagement and campaign performance.
- Factors helps you identify top-performing content, uncover hidden patterns, and track customer journeys, ensuring that your content marketing strategy continually evolves for maximum impact.
What to look for in a content marketing analytics tool?
Every tool is designed with a specific audience in mind. But here are some of the features that your content marketing analytics tool must possess.
- Account Visualizations: Visualizations translate raw stats into a form simple to grasp and analyze. They help you quickly spot trends, patterns, and outliers that wordy stats may miss. A solid analytics tool will offer various visual formats, like charts, graphs, and heat maps, to suit different data types and needs.
- Insight into Customer Journeys: Each customer interaction with your content is a step in their journey. Insight into how customers interact with your content is key to improving your content strategy. The analytics tool you choose should show each customer's full path, tracking what they do across channels and touchpoints. This means seeing the content they connect with, the actions they take, and the order of these interactions.
- Integrations with Other Tools: No tool operates alone. Your content marketing analytics tool must work with your other marketing software. This could mean your CRM, email tool, social media manager, and more. Seamless linking allows centralized data control, eliminating manual data transfer between systems.
- Ability to Track Relevant Metrics: Not all metrics are equal. The tool should track metrics most relevant to your goals. If your goal is brand awareness, track page views and social shares. If lead generation is what you’re after, track form completions, and newsletter signups. The tool should allow custom metrics for your needs.
- Intuitive User Interface (UI): A tool can have all features but if it’s hard to use, no one will want to use it. An intuitive interface makes it easy for all skill levels to navigate the tool and leverage it for their use cases. This means clear menus, logical layouts, and helpful tips.
- Customizable Reporting Options: Every business is unique, as are reporting needs. A good tool allows customized reports to focus on important data. You may also want a tool that allows you to choose metrics, how they're displayed, and who they're shared with. Custom reports also make it easier to share insights with stakeholders.
- Real-Time Analytics: The digital world constantly changes. What worked yesterday may not work today. Real-time analytics lets you monitor content performance now so you can quickly spot and respond to changes like traffic spikes, engagement drops, or social share surges. Responding fast gives you an edge.
6 Best Content Marketing Analytics Tools for SaaS in 2023
Let’s get started with the 6 best content marketing analytics tools that you must try.
1. Factors.ai

Factors is a must-have tool for B2B marketers. It provides real-time data and actionable insights that help B2B companies maximize content impact and drive measurable results. With Factors, you get a custom snapshot of how your audience is engaging with your content assets so you know what's working, what's not, and what needs to change.
Factors automatically tracks and compiles key content marketing metrics saving you time. You can use these data-driven insights to refine your content creation, enhance the distribution of your top-performing content, and refresh older content that needs improvement.
“The quality of data is amazing. It's one of the best in the market. With Factors.ai we have been able to increase our top of the funnel and at the same time we have been able to add a few into the middle of the funnel.” — Wilson L., 5-star review on G2.
Features
Factors offers a wide range of features designed to help you optimize your content marketing efforts:
- Comprehensive Content Analytics: Factors gives you in-depth insights into how your content is performing, who's engaging with it, and how well your campaigns are working. It helps content marketers easily see what's effective and make changes to optimize their strategy. As Praveen R., Head of Product Marketing at a small startup put it, Factors helped them identify the content and pages that were working well and offered good insights into the typical customer journey.
- Explain Feature: The "Explain" feature helps uncover important patterns in your data so you can spot trends and understand what's driving your results. Anirhudh Sridharan found it helpful in digging out patterns that impact their conversion metrics.
- Automated Alerts and Notifications: With this feature, you can get automated notifications about important visitor activities so you can respond promptly, engage leads at the right time and access a bigger pool of potential customers. Some Factors users have said that implementation of Factors has substantially expanded their top-level pipeline, granting them access to a broader pool of potential prospects and allowing them insight into each prospect's characteristics and behaviors.
- Attribution Tracking for Content Campaigns: This feature helps you keep track of how your content campaigns are performing across channels so you can double down on what's working and optimize your strategy. Chaitanya G., Head of Growth at a startup mentioned, Factors provides effective solutions to various challenges faced by marketing teams while offering automated alerts, enabling them to engage with prospects at the right time and focus on targeted campaigns that result in higher ROI.

- Easy Integration with Marketing Tools: Factors integrates perfectly with the platforms you already use, bringing all your data together for a complete picture of how your content is performing. No more juggling metrics across different places—get it all in one spot for easy insight into what's driving your results.
- Account Segmentation and Audience Insights: Factors gives you the power to segment accounts based on their behaviors and interests so you can tailor your marketing just for them. See who's engaging with what content, how they're interacting with your brand over time, and what makes them tick. Then craft targeted messaging and content to match. Gayatri Ivaturi S., Director of Digital and Content Marketing at a Mid-Market company, said Factors allow them to understand website activity and buyer intent at an account level. Combining multiple custom reports, they segment and target leads based on this behavior and intent data.
“Implementing automated alerts by Factors has dramatically enhanced the efficiency of our sales team. Gone are the days of dedicating countless hours to researching prospects before initiating contact, as we now possess all the necessary information readily accessible.” — Ashok D., 5-star review on G2
Integrations
Factors.AI offers a wide range of integrations to ensure seamless data flow and enhanced functionality. Here are some of the key integrations and how you can use them:
- 6signal: Discover anonymous companies on your site so you can understand their behavior and interests.
- Clearbit Reveal: Get the details on the companies stopping by your site so you can tailor your marketing to them.
- Salesforce: See how your marketing activities directly impact your sales and get insights right in your CRM.
- HubSpot: Share data between your marketing platform and CRM for a complete customer view and optimized efforts.
- Segment: Bring all your customer data together for a deeper analysis of your audience and how to best engage them.
- Rudderstack: Get a 360-degree customer view for smarter marketing and customer experiences.
- Google, Facebook, LinkedIn, and Bing Ads: Track how your ad campaigns are performing straight from Factors. Optimize your ad spend based on real data.
- Google Search Console: Gain insights into your site's visibility and performance in Google search. Improve organic traffic based on search behaviors.
For a full list of integrations, check out Factors’ integration page.
Pricing
Learn more about pricing here: www.factors.ai/pricing
2. Google Analytics

Google Analytics (GA)—we all know it and we've all used it at some point. For B2B SaaS brands, GA provides insights into who your customers are, how they're engaging with your content, and where the cracks are in their journey.
Features
Google Analytics offers a range of features that are relevant to content analytics, visualization, reporting, and dashboards. Here are some key features:
- Customer-Centric Measurement: Google Analytics allows you to understand how your customers interact across your sites and apps, throughout their entire lifecycle.
- Insights to Improve ROI: With Google's machine learning capabilities, Analytics can uncover new insights and anticipate future customer actions.
- Connect Your Insights to Results: Analytics integrates with Google's advertising and publisher tools, giving you the flexibility to optimize your marketing performance based on the insights you gain from your data.
- Make Data Work for You: Google Analytics offers an easy-to-use interface and shareable reports. You can quickly analyze your data and collaborate with your team, making your data work for you.
Integrations
Google Analytics is designed to work seamlessly with other Google solutions, providing a complete understanding of your marketing efforts and enhancing performance. Some of the top integrations include:
- Google Ads
- Search Ads 360
- Display & Video 360
- Google Cloud
- Google Search Console
Apart from these, most tools integrate and pass data to Google Analytics
For more detailed information on these integrations, you can visit the Google Analytics Integrations page.
Pricing
Google Analytics is a free tool, making it an excellent choice for businesses of all sizes. For more advanced features, Google offers Analytics 360, a more customizable version of Analytics, that is part of Google’s paid suite of products. That said, pricing starts at $150,000 per year which may not be affordable for midsized companies.
3. HubSpot

HubSpot is a comprehensive marketing analytics platform that provides insights into your marketing efforts and their impact on revenue. It offers a suite of tools for tracking, reporting, and analyzing your marketing channels.
Features
- Track the Complete Customer Lifecycle: With Hubspot, you can build reports that analyze your CRM data to discover key trends. Track the actions of your website visitors to understand behavior and trigger automation workflows. Use multi-touch revenue attribution to map how marketing touchpoints work together to drive revenue.
- Check Site Performance and Measure Traffic: You can measure traffic to your website and check its quality based on interactions. This feature also allows you to analyze how each of your pages is performing, compare key metrics like sessions and conversion rates, and find out which traffic sources bring in the most sessions and customers over time.
- Analyze Reports Across Several Marketing Channels: HubSpot's analytics are built into everything you do, right out of the box. You can see detailed reports for every marketing asset, from your website to emails, blog posts, social media, and more. Then add any report to your dashboard to track everything in one place.
Integrations
HubSpot seamlessly integrates with over 1,250 leading apps and web services, including:
- Google Contacts
- Mailchimp
- Xero
- Aircall
- Airtable
- Microsoft Dynamics 365
For more detailed information on these integrations, you can visit the HubSpot Integrations page.
Pricing
HubSpot's pricing for its marketing analytics software is structured as follows:
- Professional Plan: Starts at $800 per month, billed annually. This includes 2,000 marketing contacts. Additional marketing contacts cost $225 per month per 5,000 contacts.
- Onboarding Fee: You’re also charged a $3,000 onboarding fee for the Professional plan and a $6,000 onboarding fee for the enterprise plan.
4. HockeyStack

HockeyStack is an analytics and attribution tool designed for B2B companies. It provides a complete picture of every customer touchpoint, from the first interaction to the closed deal, helping you refine your marketing strategy.
Features
- Attribution 2.0: HockeyStack uncovers every touchpoint, from the first interaction to the closed deal, providing a comprehensive view of the customer journey.
- Custom Dashboards and Reports: HockeyStack allows you to create custom dashboards and reports to visualize your data in a way that makes sense for your business.
- Goal, Funnel, and Segment Tracking: Track your marketing goals, funnels, and segments to understand the effectiveness of your marketing efforts.
- CRM, Billing System, Customer Support, and Ad Network Integrations: HockeyStack integrates with your existing tech stack, providing a unified view of your marketing, sales, revenue, and product data.
Integrations
- CRM: HubSpot, Salesforce
- Ads: Google, Facebook, LinkedIn, and Twitter Ads
- Account-Based Marketing: 6sense, Rollworks
- Marketing Automation: Mailchimp, Pardot, Marketo, HubSpot Marketing Hub
For more detailed information on these integrations, you can visit the HockeyStack Integrations page.
Pricing
HockeyStack's pricing starts from $949 per month for 10,000 visitors per month and 10 seats. The setup and onboarding are completely free.
5. Dreamdata

Dreamdata is a B2B revenue attribution platform that connects your content to pipeline and revenue. It provides insights into how your content is influencing leads, prospects, and new business, helping you make data-driven decisions about your content strategy.
Features
- Content Analytics: Dreamdata's Content Analytics provides insights into how your content is influencing leads, prospects, and new business.
- Content Funnel Performance: It allows you to see what content influenced your accounts at different stages of their journey.
- Content Performance: With Content Analytics, you can identify what source channel is bringing in the right audience to your content.
- Data-Driven Content Strategy: Dreamdata helps you develop a truly data-driven content strategy by providing insights into what content to create for each step of the funnel, how long to wait for conversions at each stage of the pipeline, what channels to invest more in, and which are your true evergreen pages.
Integrations
Dreamdata integrates with a wide range of tools across different categories. Here are some of the key integrations relevant to content marketing:
- CRM: HubSpot, Salesforce, Pipedrive, Microsoft Dynamics
- Ads: LinkedIn Ads, Google Ads, Facebook Ads, Twitter Ads
- Marketing Automations: HubSpot, Marketo, Pardot
- Customer Success: Intercom
- Sales Tools: Outreach
- Website Tracking: Segment, analytics.js
- Data Warehouse: BigQuery, Amazon Redshift, Snowflake
- Business Intelligence: Google Data Studio, Tableau, Looker, PowerBI, Metabase
- Reverse ETL: Hightouch, Census
For more detailed information on these integrations, you can visit the Dreamdata Integrations page.
Pricing
Dreamdata offers several pricing tiers, starting from a free tier to custom enterprise solutions:
- Free: $0/month, includes up to 30,000 Monthly Tracked Users, up to 5 Seats, B2B Web Analytics, Unified Ad Spend Report, Company Enrichment & Segmentation, De-anonymize Traffic, LinkedIn Ads Engagement, and the option to share reports with your colleagues.
- Team: From $599/month, includes everything for Free, plus 30,000 Monthly Tracked Users, up to 10 Seats, Connect your CRM, Revenue & Multi-Touch Attribution, Performance Analytics & ROAS, Customer Journeys up to 2 years, LinkedIn & Google Conversion Optimization, and Data-Driven Contact to Company resolution.
- Business: From $1,499/month, includes everything in the Team, plus 60,000 Monthly Tracked Users, 20 Seats, Connect your Marketing Automation, Replay Historical Tracking Data, Content Analytics, Customer Journeys up to 3 years, SSO & User Roles, and Shared SOC2 Type II Report.
- Enterprise: Custom pricing, includes everything in Business, plus Unlimited Monthly Tracked Users, 30 Seats, ROI & CAC Reporting, Data Warehouse Access, Custom Stage Objects, Custom Attribution Model, SAML, OpenID, Azure AD, OneLogin, or Okta, and Service Level Agreement.
6. Matomo

Matomo is a powerful open-source analytics platform that provides insights into your website's traffic and marketing effectiveness. It's designed to give you complete control over your data, with a strong focus on privacy compliance.
Features
- Content Tracking: Matomo's Content Tracking feature shows how effective specific pieces of content are at generating interactions on your website or app. It tracks content impressions and content interactions, allowing you to analyze the interaction rate and discover the most effective placements and variations for your content.
- Customizable Dashboard: Matomo allows you to customize your dashboard to suit your needs, providing a personalized view of your analytics.
- Multiple Integrations: Matomo can be integrated with the most popular Content Management Systems, Ecommerce platforms, and Tag Managers.
Integrations
Matomo offers a variety of integrations with popular Content Management Systems, Ecommerce platforms, and Tag Managers. Here are some of the key integrations:
- Content Management Systems (CMS): WordPress, Wix, Webflow, Squarespace, Drupal, GoDaddy Website Builder, Jimdo, Microsoft SharePoint Online, Joomla, Kajabi
- Ecommerce: Shopify
- Tag Manager: Google Tag Manager
- Other: Cloudflare, React, Vue.js
Pricing
Matomo offers several pricing plans, including a free option:
- Free Plan: This plan is free and includes self-hosted analytics, full data ownership, and no data limits.
- Cloud-hosted Plans: Starts at $23/month for 50,000 hits a month. The pricing increases as your monthly traffic grows. However, all plans, including the base plan have all the important features.
- Enterprise Plan: If you need Custom data limits, custom data retention period, white labeling, custom domains, or specific enterprise requirements, this plan is the ideal fit for your needs.
Experience The True Potential of Your Content Marketing Analytics
The B2B SaaS landscape has evolved beyond traditional content marketing and embraced the power of data-driven decision-making. Content marketing analytics tools enable this transition and help marketers better understand their audience, optimize campaigns, and ultimately, drive growth and success.
Factors stands out as an exceptional choice for SaaS businesses in search of an analytics tool. It not only reveals hidden insights but also streamlines the most complex aspects of content marketing strategy. It works behind the scenes to reveal anonymous website visitors, track customer journeys, and offer actionable data. It equips businesses with the invaluable information needed for strategic, well-informed marketing decisions.
So, don't let the vast sea of data intimidate you. A powerful and flexible content marketing analytics tool like Factors can make your life simple.
Ready to make the best of your content marketing efforts? Book a demo with Factors today and see how it can help you make the right decisions.

5 Mistakes To Avoid When Measuring Content Marketing ROI
Did you know the content market industry is projected to reach an astounding $107 billion by 2026? With such high stakes, almost half of the marketers have planned to increase their content marketing budgets this year.
But here's the catch: while everyone wants to jump on the bandwagon, measuring content marketing ROI is where many marketers trip.
In this article, we'll discuss 5 of the most common mistakes marketers make when measuring content marketing ROI.
What is Content Marketing ROI?
Content marketing return on investment (ROI), is a metric that measures the revenue a business earns from its content marketing efforts compared to the cost of those efforts. It's a way to quantify the effectiveness of your content marketing strategy in terms of financial returns.
Calculating content marketing ROI might seem daunting, but it's quite straightforward. Here's a simple formula:

This formula gives you a percentage that represents your return on investment.
For example, if you spent $1000 on content marketing and earned $3000 in revenue, the profit is $2000. This means your ROI is 200%---you made $2 for every $1 spent.
Why is Measuring Content ROI Important?
Here are some of the major reasons why every marketer must measure the ROI from content marketing:
Streamline Budget and Resource Allocation
Content marketing is a broad field that includes various types of content—from blog posts and social media updates to podcasts and videos.
Each of these content types requires different resources and has a different impact on your audience. When you measure the ROI of each content type, you can understand which ones are delivering the best results and allocate higher budgets to that type of content.
Let's consider an example. Suppose you have a budget of $10,000 for content marketing. You decide to split it equally between blog posts and video content, spending $5000 on each.
A few months in, you find that:
- Your blog posts generated $10,000 in revenue, giving you an ROI of 100% (10,000 - 5,000) / 5,000 * 100
- Your videos generated $20,000 in revenue, giving you an ROI of 300% (20,000 - 5,000) / 5,000 * 100.
Along with revenue, your attribution model shows that while blog posts are often the first touchpoint, videos are the last touchpoint before a customer makes a purchase.
This data suggests this—blog posts are important for attracting customers and videos are more effective at converting them. As a result, you decide to allocate a higher budget to video production in the future.
This kind of data-driven decision-making can help you optimize your content marketing strategy and ensure that your resources are being used effectively.

Helps with Executive Buy-In
We've all heard of a CEO or CMO who redirected their marketing budget from organic to paid ads. Why does this happen? The answer—content marketing does not offer an immediate or direct conversion, unlike paid marketing.
However, a comprehensive tracking and analytics system like Factors makes attributing revenue and sales to content marketing easier. All the data is displayed in the form of a user timeline in chronological order. You see all the touchpoints all the way from the first one right up to the conversion, helping you set up attribution and get executive buy-in for increased budgets.

Can Reduce Churn
When tracking ROI, you tend to notice gaps within your existing content. This could be a lack of knowledge base, FAQs, video tutorials, or other content pieces.
If you notice that your customers interact and use your existing knowledge base a lot, you can double down on the content there to help them make the most out of your product or service.
As customers become more invested in your products through these efforts, sunk cost fallacy comes into play and your customers are less likely to switch.
Improve Collaboration Between Sales and Marketing
Measuring content ROI also requires collaboration between the sales and marketing teams. During sales calls, your sales team can identify which content a user viewed before booking the demo. They can then correlate the conversion rates with the type of content to identify what performs best.
For instance, if whitepapers or webinars are effective in moving leads further down the sales funnel, your marketing team can double down on these pieces. This can also help the sales team close more leads and bring in more revenue.
Mistakes to Avoid When Measuring Content Marketing ROI
When it comes to measuring the return on investment (ROI) of your content marketing efforts, there are several common mistakes that marketers often make. Avoiding these pitfalls can help you gain a more accurate understanding of your content's performance and its impact on your bottom line.
1. Not Understanding the True Cost of Content Production and Distribution
Most marketing teams do not track the true cost of content production and distribution.
This cost includes both
- direct costs: such as the cost of hiring writers or purchasing content
- indirect costs: such as the time spent by your team to manage, edit, and distribute the content.
According to a Forbes article, content is the gasoline that fuels the entire marketing engine. Just like gasoline, there are different grades of content and each grade comes at a different price. Knowing the collective costs of creating and distributing content is the best way to start identifying the ROI from your content marketing efforts.
2. Relying Exclusively on Vanity Metrics
Vanity metrics make you feel good about your marketing efforts. They include website page views, the number of subscribers on your newsletter list, the number of likes or followers on social media, and email open rates.
However, vanity metrics tell you nothing about your business performance.
For example, a million monthly page views might sound impressive. But if they do not translate into sales, they are not contributing to your bottom line. Similarly, having a large number of email subscribers is meaningless if they do not engage with your content and take the desired actions.
Instead, focus on actionable metrics like:
- website conversion rates
- click-through rates of email campaigns
- customer acquisition costs
- positive brand mentions on socials and other websites
These metrics help you better understand how your content is impacting your bottom line and make data-driven decisions to improve your content marketing ROI.
3. Ignoring Micro-Conversions
Micro-conversions are the smaller actions that website users take on the path to macro-conversions.
Micro conversions can include actions such as:
- signing up for a newsletter
- downloading a whitepaper
- brand mention on social media
While these actions may not directly lead to a sale, they are important indicators of user engagement and can provide valuable insights into the customer journey.
Ignoring these micro-conversions can lead to missed opportunities for optimization and improvement. But tracking and analyzing these small actions helps you better understand your customer's behavior and make impactful decisions for your content strategy.
4. Relying only on self-attribution
Self-attribution is the source of conversion as reported by the customers themselves. This could be through surveys, feedback forms, or other direct communication where the customer tells you how they found out about you or what influenced their decision to convert.
A study by Google mentions that customers have an average of 2.8 touchpoints before making a purchase. This means that if you're only attributing success to the last touchpoint, you're missing out on considering the impact of the other 1.8 touchpoints.
Consider a customer who discovered your brand through a blog post. They also engaged with your social media content before making a purchase through a promotional email. If you ask this customer what influenced their purchase, they may mention it was the promotional email. But that undervalues the role of other pieces of content within the buyer journey.
To avoid this mistake, complement self-attribution data with other methods of tracking customer interactions. This means, using analytics tools like Factors to track customer behavior on your website and across platforms, and implementing various attribution models to consider all touchpoints in the customer journey.
For example, a linear attribution model would give equal credit to all touchpoints, while a time-decay model would give more credit to the touchpoints closer to the conversion.
Let’s now look at how we can calculate the content marketing ROI with an example.
Calculating Content Marketing ROI With An Example
Let's take a look at an example to better understand how to measure the ROI of a content marketing campaign.
Suppose one of your blog posts started ranking on Google through SEO and was also promoted on social media and email campaigns.
By the end of the month, the blog got 800+ unique visitors – 500 through search engines and 300 through promotional efforts. Of these 800 visitors, 60 signed up for the product.
You earn around $5000 from these 60 customers
If the cost of producing and promoting the blog post was $1000—which includes the cost of writing and repurposing the content across platforms, what’s our ROI on this piece of content?
Using the content marketing ROI formula:
ROI = ($5000 - $1000) / $1000 * 100% = 400%

This means that for every $1 spent on the blog post, you earned $4 back.
And because SEO content keeps bringing in visitors, long after the work is done, you continue to reap the benefits from these efforts.
Measure your content efforts with Factors
Let’s get started with a practical setup of how you can leverage Factors for content marketing ROI measurement.
Step 1: Define Your Goals and Metrics
Before you start measuring your content performance, you need to determine what success means for content marketing.
For you, it could mean increasing website traffic, generating leads, improving conversion rates, or boosting customer engagement. Determining your metrics and key performance indicators (KPIs) will help you measure your progress toward these goals.
Factors provide Attribution tracking which helps you create reports that attribute your marketing efforts to specific goals and metrics.
Here's how you can build an event report in Factors.ai:
- Log in to Factors and click on Reports > Analyse

- Next, click Attribution Reports. These reports keep track of all the touchpoints through the platforms that Factors has connected with and UTM data to identify the source of conversion.

- Next, we need to identify the specific goals that signify a successful conversion.
Step 2: Set Up Tracking/Attribution
If you haven’t set up events, you can do so by clicking on the configure icon beside your profile picture and clicking Events.

- Factors also automatically track events across all the pages of your website. You can simply set a page as your conversion goal (for ex. Demo page). Let’s take this as an example and create an attribution report.
- The conversion goal is set to the /schedule-a-demo page.

- Marketing touch points are the type of marketing campaigns that you want to track within these reports. Tactics are outbound marketing campaigns like Google ads. Offers are inbound marketing tactics like landing pages and content that you create to bring in visitors.
- We then pick the Property as a Campaign here so we can attribute the marketing efforts to specific campaigns. You can pick a source if you want to identify which of your channels is bringing in the most conversions.
- Then, we move to Criteria. This helps you configure how a conversion is attributed to a specific campaign. We’ll start by configuring it to the first touchpoint. This means all conversions are attributed to the first touchpoint.

We also set the time window to 30 days. This ensures that even if a visitor converts after 30 days, you can attribute it back to the first touchpoint.
- Once done, click Run analysis and you’ll have a complete visual report specifying exactly what campaigns bring in your leads.

Step 3: Understanding Campaign Costs and ROI
Scrolling down the report will give you a breakdown of individual campaigns that bring in leads.
- Factors can also bring in the ad spends for each campaign on a single dashboard. This means you can identify how much money was spent on a campaign vs. the return.

- Scroll below the chart to see the breakup. This breakup will give you insight into how your content marketing performs and the number of conversions it brings in.

With that, you have a fundamental understanding of how to attribute business success to your content marketing efforts and showcase the impact to the stakeholders.
However, it’s just the beginning. Factors integrates with 6signal by 6sense, Hubspot, Zapier, Ads platforms, Slack, and many other tools to bring data from across platforms under a single dashboard. This lets you create comprehensive reports and also gives you a holistic view of all your marketing campaigns, no matter the platform.
Leverage The Factors Advantage for Content Marketing ROI Optimization
With content marketing, you're juggling multiple tasks—creating content, tracking performance, and more importantly, measuring return on investment (ROI). But, measuring ROI isn’t straightforward. It involves setting clear goals, tracking the right metrics, understanding your costs, and connecting the dots to get a holistic view.
That’s a lot to handle. But Factors is here to simplify things for you.
It makes tracking and understanding your content marketing efforts a breeze. With its analytics and attribution tools, you can easily track user behavior, identify key touchpoints, and optimize your sales process. Plus, Factors’ customizable dashboards give you a real-time view of your key metrics, helping you make data-driven decisions on the fly.
So, are you ready to unlock the full potential of your content marketing? Then it's time to take the next step. Book a demo with Factors and start your journey towards content marketing success, today!
12 Content Marketing Metrics & KPIs For SaaS Companies
For SaaS businesses, content is more than a 'good-to-have'—it's a business asset. A staggering 92% of marketers acknowledge the importance of content in the growth of their business.
But, merely recognizing the importance is not enough. You also need to understand what effective content marketing is, how it catalyzes growth, and what metrics can measure its effectiveness.
In this article, we’ll look at the top content marketing metrics and KPIs you need to measure for content effectiveness and success. Let's get started.
What are Content Marketing Metrics?
Content marketing metrics quantify the effectiveness of your strategy and content marketing efforts. They offer an understanding of how well your content—whether blogs, emails, videos, etc.—is engaging your target audience and converting them into customers.
As you continue to scale content, tracking these metrics should be of utmost importance, especially for SaaS marketing teams.
These metrics provide clarity about the strengths and weaknesses of your content strategy and can help you measure specific attributes of your content that your target audience likes—guiding your future content decisions.
Most importantly, content marketing metrics serve as a gauge for your content's impact on your business success, helping you make data-driven decisions and strategic adjustments to enhance the ROI.
Why Your SaaS Company Needs to Track Content Metrics
Content marketing metrics provide key insights into what's performing, what's not, and where you need to make changes. Metrics help you:
- Understand Your Audience Behavior: Stats like page views, time on page, and bounce rate paint a clear picture of how your audience interacts with your content. Are they hooked or leaving quickly? What content pieces are they consuming? And how can this data help create content that aligns with our audience's preferences? These insights help you create content that better fits what your audience wants.
- See Content Performance: How do you know if your content is successful? Social shares, comments, and conversion rates show whether your content resonates with your audience and leads them to sign up, download, buy, or any other goal you may have.
- Plan Future Content: By tracking metrics over time, you spot trends and patterns to shape your future content plans. For example, if one type of content always does well, create more of that type of content.
- Optimize Your Content: Tracking metrics allow constant optimization of your content. You can test different strategies, see their impact, and refine your content based on what works best.
- Prove ROI: Content marketing costs time and money. Metrics such as revenue, leads generated, and customer acquisition cost help show it's worth the investment. Execs want to see returns.
Next, let’s explore the types of metrics SaaS companies should monitor.
The Metrics Guiding Your B2B Content Strategy
As a B2B company, content marketing metrics are your compass to success. They show how to navigate the sea of content and connect with your audience. Here we explore the five types of key metrics to measure:
Consumption Metrics
These are the most basic metrics and provide insights into how your audience consumes your content. These metrics also look at the frequency and depth of their content consumption.

Stats like pageviews, sessions, and referrals reveal how many view your content, how often, and the channels they use.
Engagement Metrics
With engagement metrics, you can determine how your audience interacts with your content. They also help you guide your future content creation decisions by understanding what content is attractive to your audience.
Data on likes, shares, comments, and session duration are a few examples of engagement metrics. Keep track of these metrics to ensure steady growth and to build influence over time.
Retention Metrics
Once your audience has consumed and engaged with your content, they can either bounce off to never return, or keep coming back for more. Retention metrics help you understand how many of your users return to your content or website for more.
Data on return visits, subscription rates, and churn rates signal how valuable your audience finds your content.
For a SaaS business, retention can be difficult as competitors are prying for opportunities to copy your effort. But once you develop a content moat (think Hubspot or Drip), you have a strong business asset that prevents your customers from going elsewhere.
Cost Metrics
Next we come down to the metrics that tell you how valuable the content is for your business. These numbers include the cost per lead (CPL), cost per click (CPC), return on ad spend (ROAS), ROI, and others.
Cost metrics show whether your content achieves outcomes efficiently. It also helps you understand how long before your content starts generating positive ROI for your business and can help guide your budgeting decisions.
Lead Gen Metrics
Businesses create and distribute content to bring in leads. Lead gen metrics tell you how many leads your content has generated.
These metrics include lead volume, lead quality, and conversion rates indicating your content's impact on your business.
While these metrics may work individually, a combination of these metrics gives you a holistic view of your content performance. They steer your strategy by revealing what's effective and what needs refinement.
Content Marketing Metrics vs. KPIs: What’s the Difference?
Metrics and KPIs are words commonly thrown around in the marketing world. But what’s the difference? While KPIs and metrics are both quantitative measurements, they serve different purposes.
While all KPIs are metrics, not all metrics are KPIs. Understanding the difference between these two can help you better track and measure your content marketing success.
12 Content Marketing Metrics and KPIs SaaS Companies Should Measure
Now that you have a grasp on the types of metrics in content marketing, let’s look at the 12 most important content marketing metrics you need to keep track of to ensure your decisions are backed by the right data.
1. Organic Traffic
Organic traffic is the number of visitors who land on your website from unpaid search results.
This metric is a testament to the quality of your website's search engine optimization (SEO). It's a reflection of your website's relevance and the quality of its content. The higher your organic traffic, the more opportunities you have to generate leads and conversions.

Suppose you have recently started a blog to drive more organic traffic. You look at a tool like Google Search Console or Factors to see that your website has received 5,000 visits from organic search after a month of content efforts.
This indicates that 5,000 people found your website through a search engine and visited your site, demonstrating the effectiveness of your SEO efforts. Here, you can also check the keywords and terms that people search for to find your content.
2. Impressions
Impressions represent the number of times your ad or content is displayed and viewed by users. In the context of digital marketing, impressions give you an idea of the reach of your content. It's a measure of potential audience size, giving you insights into the potential reach of your content or ads.
Factors helps you see the exact number of impressions for all your campaigns in a single place. It makes it easy for you to take a holistic decision on what campaigns are working and how you can optimize your marketing channels with the best ads.

Consider that you run a LinkedIn ad campaign and your ad has 10,000 impressions. This means LinkedIn showed your ad to 10,000 people. It also helps you decide if segmenting further or broadening your keywords and audience can improve reach and targeting.
3. Clickthrough Rate
Clickthrough rate (CTR) is a ratio that compares the number of times your viewers click on a specific link to the number of total views on a page, email, or advertisement.

It's a key performance indicator for ad campaigns and provides insights into the effectiveness of your ads or emails. A higher CTR indicates that more people are clicking on your link, which could lead to higher conversions.

For example, an ad that was displayed 10,000 times (impressions) and received 200 clicks has a CTR of 2%. This means that 2% of the people who saw your ad ended up clicking on it. With this metric, you understand how well your ad copy or content is working for your audience on the platform.
4. Content-Assisted Demos
Content-assisted demos are the number of demos that were influenced by your content.
This metric is part of the marketing funnel and helps you understand the effectiveness of your content in driving leads and sales. It's a powerful indicator of the quality and relevance of your content, as it shows how well your content is able to engage potential customers and lead them further down the sales funnel.

Let’s assume you've published a blog post about the benefits of your product and included a call-to-action (CTA) to schedule a demo. Of 10,000 people who visit the blog post, 500 book the demo.
That gives you a CTR of 5%. However, attributing it to your content could be difficult. A tool like Factors can help you visualize the marketing funnel and tell you exactly how many of your leads came from your blog posts vs your website home page.
5. Bounce Rate
Bounce rate measures the percentage of visitors who land on your website and exit your website without looking at other pages. In other words, they "bounce off” instead of continuing to other pages within your site.
While this could indicate that your content solves the need that a user came in for, it also tells you that there’s more you can do to retain your visitors. The average bounce rate hovers around 50%.

To calculate the bounce rate, you divide the total number of single-page visits by the total number of entries to a website. The resulting figure is then multiplied by 100 to get a percentage.
Let’s assume one of your blog posts attracts 100 visitors a month. Of those, 40 left after reading just that one post. In this case, your bounce rate is 40% which means 40% of your visitors don’t interact with your site beyond the initial page they landed on. You can improve retention by looking at the time on the page, scroll depth, and tracking overall website behavior.
6. Customer Acquisition Cost (CAC)
Customer Acquisition Cost (CAC) is the total cost of resources and efforts a business allocates to gain new paying customers.
CAC is a critical business metric for determining the resources required to acquire and onboard new customers, and it helps assess your company’s overall health and profitability. It's calculated by dividing the total costs associated with acquisition by total new customers, within a specific time period.

Let's consider that you offer a project management tool. Your monthly marketing budget is $10,000, which includes costs for ad spend, content creation, and marketing software. In that month, you acquire 200 new customers.
The CAC would be $10,000 divided by 200, which equals $50.
This means you spend $50 on average, to acquire each new customer. This is an important number for understanding the efficiency of your marketing efforts and for planning future marketing budgets.
7. Unique Visitors
Unique visitors are the number of individual people visiting your website over a certain period of time.
This metric is critical for understanding the size and reach of your website's audience. It's different from the number of visits, which counts the total number of times your website has been visited by both new and old visitors. Instead, the unique visitors metric tells you just the number of users that have visited your website — avoiding double-counting those who visited multiple times.

Factors’ web sessions view
Suppose you recently started a blog to drive more organic traffic. A tool like Factors can measure that your website has received 3,000 visits in a month, but only from 2,000 individual users, some of whom may have visited multiple times. This means that your unique visitors for that month would be 2,000, indicating the size of your audience and the effectiveness of your user acquisition strategies.
8. SERP Ranking
SERP (Search Engine Results Page) ranking refers to the position of a website's content on the search engine results page.
The lower the number (for example, 1 is better than 7), the better your search visibility and the higher the chances of people visiting your site organically. It's a direct reflection of your SEO efforts, keyword relevance, backlink profile, and website quality that influences your ranking.

Suppose you offer a project management tool, and your blog post titled "Top 10 Project Management Tools in 2023" ranks 1st on the SERP for the keyword "project management tools 2023". You can view the SERP position by either directly searching on Google for your keyword or checking Google Search Console. Rank 1 means your SEO efforts have been successful in making your content highly visible to users searching for that specific keyword.
By employing a professional SEO tool like SE Ranking, you gain the ability to analyze the pages that currently hold top positions on the SERP. This valuable insight helps you understand the strategies and tactics that contribute to their success. Continuous monitoring of your competitors' rankings ensures that you stay informed about the dynamic landscape of search engine results.
9. Pages Per Session
Also known as page depth or depth of visit, pages per session reveal the average number of pages a user views during a single session on your website.
This metric tells you the effectiveness of your site content in keeping viewers engaged and navigating through your site. A higher number of pages per session indicates compelling content and an intuitive site design that encourages exploration. However, do note that most of your visitors will view a single page and leave.

Factors pages per session report
Suppose your marketing analytics tool shows an average of 5 pages per session. This means that users, on average, visit 5 different pages on your website in a single session. This could be a result of effective internal linking, engaging content, or a user-friendly site layout that encourages navigation.
10. Average Time on Page
Average Time on Page measures the average time users spend on a specific page before moving on to another one or exiting your site.
This metric helps you understand your users’ engagement with your site content. A high average time on a page generally indicates that users find your content valuable and engaging. However, the ideal duration will vary depending on the type of content you're offering and the goals of your website.
Let's consider that you've published a comprehensive guide on "How to Use Your SaaS Product". A month after publishing, you note that the average time on this page is 7 minutes.
Depending on the length of your guide, this may indicate that users are likely reading the entire guide or at least skimming through the important parts you may have highlighted. You can dive deeper into this by looking at click maps or scroll depth.
This shows that users are finding value in your guide and you should continue producing similar assets for your business.
11. Traffic Source
Traffic Source is the origin or medium through which visitors arrive at your website or digital platform. Knowing your traffic sources helps businesses know exactly what channels the marketing team should double down on and what channels are not generating enough ROI to keep going.
For instance, consider an e-commerce store that sells handmade home accessories. The store owner has implemented various marketing strategies like social media, paid advertising, organic search, and email marketing to drive traffic to the website. To evaluate the effectiveness of these promotional efforts, the store owner needs to analyze traffic sources to determine which is bringing the most visitors and which source results in the highest conversion rate.

Factors can indicate that 1,000 website visitors arrived from the following traffic sources—500 from social media, 200 from paid advertising, 200 from organic search, and 100 from email marketing campaigns. Based on this information, the marketing team can focus more on their social media strategy.
12. Scroll Depth
Scroll depth is a measure of how far down a webpage a user scrolls. It indicates how much of your content is being consumed and can provide insights into user engagement.
Scroll depth tracking in Factors allows you to see how much of a web page your visitors actually view.
For example, if you have a blog post that is 2000 pixels long, and users on average scroll 1000 pixels, your average scroll depth would be 50%.

This means that on average, users are viewing half of your content. If the scroll depth is low, it might indicate that users are not finding the content engaging or relevant, prompting you to optimize your content strategy. Along with this, you can create a custom report in Factors plotting how the scroll depth has improved as you update your site content and UX.
Unlock The Full Potential of Your Content Strategy
A data-driven content strategy is fundamental for any SaaS company seeking to maximize lead generation, website optimization, and business growth. A focus on metrics and KPIs paired with a comprehensive content analytics tool like Factors can help you gain deeper insights into your audience's behavior, content performance, and ROI.
Along with the basic metrics, Factors also helps you discover anonymous accounts visiting your website. This data can help you further optimize your account-based marketing efforts giving you a list of customers with the highest potential for conversion.
So, do not let valuable insights slip away—detect opportunities, gauge your success, and set your sights on new heights with Factors by your side.
Top 10 Content Marketing Metrics for SaaS Growth
Tracking key metrics ensures effective content marketing strategies and sustainable business growth.
1. Core Metrics: Organic traffic, conversion rate, and customer acquisition cost (CAC).
2. Engagement Indicators: Time on page, bounce rate, and click-through rate (CTR).
3. Strategic Impact: Backlinks, social shares, lead quality, and customer lifetime value (CLV).Monitoring these KPIs helps SaaS companies refine content strategies, boost engagement, and drive long-term success.
.webp)
What Is Buyer Intent Data & How Does It Contribute To Account Based Marketing: A 2025 Guide
Let’s say your ICP is VP of digital marketing, and she’s looking for a CRM. Her biggest challenges are maximizing ROI and ensuring consistency in leads, she reports to the CMO, and wants a platform that offers one-click integrations with various MarTech she and her team needs. And because this is a B2B purchase, you know she’s not the only decision maker.
So, you gather this persona-specific information about all your target designations and individuals, and, then, create a marketing campaign. You have personalized content and ads, and you’re truly adding value in their buyer journey. Now, imagine a personalized campaign like that will have on their decision.
This is where the importance of intent data in ABM becomes evident. By leveraging intent data, you can identify your "best-fit" accounts and tailor your marketing efforts accordingly. You gain insights into the challenges they face, their preferences, and their buying signals. Understanding their buyer intent allows you to align your messaging, content, and offers to precisely address their needs. This approach significantly increases the likelihood of capturing their attention, building trust, and ultimately influencing their decision-making process.
A campaign with already-qualified ICP, targeted campaigns, and with the understanding they actually need the solution has a more probability of success as compared to the traditional marketing. This method has gained so much popularity in the recent past that approximately 98% of organizations currently use or plan to use ABM as a strategic tactic—and at the core of each successful campaign is understanding the intent of your ideal buyer.
This guide breaks down everything you need to know about using intent data to supercharge your ABM strategy in 2025.
TL;DR
- Precision Targeting: Intent data reveals which accounts are actively searching for your solution, enabling smarter segmentation and prioritization.
- Personalized Campaigns: Tailor messaging to each stakeholder’s unique interest—whether it’s cost, time savings, or operational efficiency.
- Faster Conversions: Companies using buyer intent shorten sales cycles by 30% and see significantly higher conversion rates.
- Future-Ready Tech: By 2025, AI-powered models will automate and enhance the use of intent signals across CRM, ad platforms, and marketing automation tools.
But First, What Is Buyer Intent?
Essentially, it is little clues and actions that help you understand your ‘best fit’ target audience actually needs the solution you’re selling, and it helps you engage with them on their terms.
With buyer intent, your marketing and sales teams proactively engage with all contacts within a target account. By precisely targeting your marketing messages towards your ideal customers and utilizing the channels where your target audience are most likely to be noticed, such as social media, display advertising, video, or mobile, you can generate the continued momentum needed to close sales.
Engagement is a pivotal stage in account-based marketing, which encompasses a wide range of methods to interact with your prospects. Email outreach, webinars, ebooks, targeted advertisements, videos, events, programmatic or automated approaches, there are various methods by which you engage with your buyer. By collecting and leveraging buyer intent data, the entire engagement process becomes more personalized.
For example, consider you’re selling talent acquisition software. And as we all know well, there’s never just one decision maker in B2B, so you need to engage and show value to all of the decision makers. So, for the chief human resources officer, you create campaigns regarding cost optimization; for hiring managers, you talk about time saving; and for talent managers, you mention the quality of candidates and reduction of repetitive tasks. This way, you’re systematically delivering value on each level, and also engaging with them in their terms.
So, by incorporating buyer intent into your account-based marketing strategy, you can enhance your engagement efforts, personalize your messaging, and establish more meaningful connections with your target audience, which, in turn, maximizes your ROI on each campaign.
How Intent Data Has Evolved in B2B Marketing
Since 2020, the role of intent data in B2B marketing has taken a giant leap. It started out as a simple tool for lead scoring but has now become the backbone of sophisticated Account Based Marketing (ABM) strategies. Did you know that 87% of buyers now prefer to navigate their buying journey independently? That's why picking up on intent signals early is incredibly important.
Here's how modern B2B companies are using buyer intent data:
- Spotting which accounts are actively on the hunt for solutions.
- Getting a handle on their specific pain points and challenges.
- Timing their outreach perfectly for the best impact.
- Tailoring content and communications to fit.
- Predicting buying behavior and preferences.
In a nutshell, if you want to stay ahead of the curve in today's marketing world, tapping into buyer intent data isn't just smart—it's essential.
How Buyer Intent Data Is Collected
As the ‘outside-in’ approach is absolutely fundamental to ABM, you need buyer intent data as a prerequisite to create a campaign. So, here’s what you should be collecting and evaluating:

1. Website Tracking
By tracking website behavior, businesses can gather intent signals such as:
- Visitor navigates to specific product pages, indicating interest in those offerings.
- Visitor spends a significant amount of time on the pricing or comparison page, signaling a potential purchase decision.
- Visitor fills out a form to request a demo, suggesting a strong intent to explore the product further.
2. Search Data
Examples of intent signals collected from search data include:
- For example, user searches for "best budget CRM," indicating an intent to purchase a CRM within a specific price range.
- User searches for "how to improve SEO ranking," showing an intent to learn about SEO strategies and techniques.
- User visits software comparison sites, such as G2 and software select, and searches for “best ABM tool”, indicating they are in need of an ABM partner.
3. Content Consumption
Intent signals extracted from content consumption may include:
- User spends five minutes reading an in-depth blog post about email marketing automation, indicating a strong interest in the topic.
- User watches a video tutorial on setting up a smart home system, suggesting an intent to implement the technology.
- User downloads an ebook on social media advertising strategies, indicating an intent to enhance their social media marketing efforts.
4. Social Media Listening
Examples of intent signals gathered through social media listening include:
- User tweets, "Looking for recommendations for a reliable web hosting provider," indicating an intent to find a suitable hosting service.
- User comments on a Facebook post, asking for suggestions on the best CRM software for small businesses, showing an intent to explore CRM options.
- User shares an article about the latest digital marketing trends, signifying an interest in staying informed about industry developments.
5. Form Submissions
Intent signals obtained from form submissions can include:
- User fills out a contact form, providing details about their business and a specific inquiry, demonstrating an intent to engage with the company's offerings.
- User completes a form to register for a webinar on content marketing strategies, indicating an intent to gain knowledge in that area.
- User requests a quote by filling out a form, suggesting a potential intent to make a purchase.
However, not all data is relevant data.
Say, a seemingly fit profile shares an article about CRM types, that doesn’t immediately mean they’re in the market to buy one. Which is why, you need buyer intent data measurement and qualification process, so you don’t end up chasing dead leads. And here’s a great way to start:
- Scoring and Ranking: With buyer intent data, assign scores or rankings based on specific criteria. This will allow you to prioritize leads and prospects based on their level of intent—this essentially means prioritizing high-intent accounts so they’re addressed first, while you continue to nurture the less-intent accounts. Factors such as website engagement, content consumption, and online behavior are assessed to determine the strength of a visitor's intent. For instance, Factors.ai helps you engage with high-intent accounts with behavioral and firmographic (relating to the firm) filters.
- Data Analytics: Advanced data analytics techniques can also be employed to analyze buyer intent data. These techniques involve examining patterns, trends, and correlations within the data to uncover insights about visitor behavior, interests, and potential buying intentions.
Note: For the purpose of qualification, you can follow the BANT mechanism. It is an acronym of qualification questions, Budget, Authority, Need, and Timeline, that can help you prioritize accounts.
By now, we’ve talked plenty about how buyer intent can help you delineate your strategic ABM accounts, how you can measure those signals, and what parameters can help you prioritize accounts. But, how are ABM and intent signals related—let’s get into it now!
What Are The Different Types Of Intent Data Available for ABM
Imagine having a pair of super-powered glasses that let you see exactly what your potential customers are up to. Intent data does this for Account-Based Marketing (ABM). There are two main types, each offering its own set of insights.
First-Party Intent Signals
These are the gems you gather straight from your own digital turf. Here’s what they include:
- How people move around your website.
- What content are they downloading and engaging with?
- Their interactions with your emails.
- Signing up for events.
- Requesting demos.
- Filling out forms.
Third-Party Intent Signals
Now, let’s step outside your own bubble. Third-party data gives you a peek into:
- How folks interact with industry publications.
- Visits to review sites.
- Research on competitors.
- Engagement on social media.
- Forum chats.
- Browsing tech review platforms.
The Power of Combining Both First Party & Third Party Intent Signals
The real magic kicks in when you mix these two data sources. Picture this: a company checks out your competitor’s products (third-party) and then heads over to your pricing page (first-party). That’s a pretty strong hint they’re ready to buy.
By 2025, the most successful ABM strategies will not just use one type of data over the other. Instead, they will blend both to get a full picture of buyer behavior. This approach will lead to spot-on targeting and better conversion rates.
📊 Learn how to use buyer intent data for ABM — this video breaks it down step-by-step with real examples.
What’s The Connection Between Buyer Intent And Account Based Marketing?
Essentially, all marketing boils down to intent: whether it is following the traditional funnel or the inverted (ABM) funnel. This is because most buyers turn to online research to identify their problems, find suitable solutions, and choose the right vendors. This behavior provides valuable signals about their stage in the buying process, whether they're at the top, middle, or bottom of the funnel.
Some of the ways buyer intent can directly impact your account based marketing practices are:
1. Identifying High-Intent Accounts
Buyer intent data helps discover accounts that show strong indications of purchase intent. By analyzing intent signals, such as website interactions, content consumption, or form submissions, businesses can pinpoint the accounts that are actively researching or expressing interest in their products or services. These accounts become the primary focus of ABM initiatives.
2. Driving Conversion and Revenue
The ultimate goal of ABM is to drive conversions and generate revenue from target accounts. Buyer intent data plays a critical role in this process by enabling businesses to identify accounts that are in the later stages of the buying journey and more likely to make a purchase. By aligning ABM strategies with buyer intent, companies can effectively nurture and convert high-intent accounts, leading to increased revenue and business growth.
By leveraging intent data, businesses can gain deeper insights into the needs and interests of their target accounts. This allows them to tailor their marketing efforts more effectively and engage with potential customers at the right stage of their purchasing journey. Intent data enhances the precision and relevance of ABM initiatives, ultimately improving the chances of success.
Pro tip: By identifying and delineating the right buyer for each account, you can reduce the margin of error and create an idiot-proof statement of work (SOW) on which products and services will be offered to the account during the nurture stage.
Step-By-Step Guide To Leverage Intent data In Your ABM Strategy
Incorporating intent data into your account-based marketing (ABM) strategy can greatly enhance your targeting and engagement efforts. So, here is a step-by-step guide to help you effectively integrate intent data into your ABM approach:
Step 1: Define Your Ideal Customer Profile (ICP)
Begin by clearly defining your ideal customer profile, including key attributes, characteristics, and firmographic data. This will serve as the foundation for your ABM strategy and help you align intent data with your target audience.
Step 2: Identify Relevant Intent Signals
Determine the intent signals that are most relevant to your business and align with your ICP. These signals could include website visits, content consumption, search behavior, engagement with specific topics or keywords, or interactions with your marketing assets.
Step 3: Leverage Intent Data Providers
Research and partner with intent data providers that offer reliable and accurate data relevant to your target audience. These providers can help you access and analyze intent data from various sources, such as IP-intelligence, behavioral tracking tools, or social listening platforms.
Factors.ai, for example, helps you collect and analyze campaign, website, and funnel analytics and helps you add predictability in your campaigns. With customizable properties, dashboards, and dimensions, its proven to deliver better ROI on marketing campaigns.
Step 4: Integrate Intent Data with Your CRM and Marketing Automation Tools
Ensure seamless integration between your intent data provider and your CRM and marketing automation tools. This integration enables you to enrich your customer profiles with intent data and create personalized experiences based on individual buyer interests and behaviors.
Step 5: Analyze and Segment Intent Data
Analyze the intent data collected to identify patterns, trends, and commonalities among your target accounts. Segment your audience based on their intent signals, grouping them into specific clusters or categories that align with their buying stage, interests, or pain points.
Step 6: Tailor Content and Messaging
Utilize the insights gained from intent data to create highly personalized and relevant content and messaging for each segment. Customize your marketing assets, such as emails, website content, ads, and social media campaigns, to address the specific needs and interests of different account segments.
Step 7: Implement Targeted Campaigns
Develop targeted marketing campaigns that align with the intent signals exhibited by your identified account segments. Use intent data to determine the most appropriate channels, timing, and messaging to engage with your target accounts effectively.
Step 8: Track and Measure Results
Continuously monitor and measure the impact of your ABM efforts fueled by intent data. Track key ABM metrics, such as engagement rates, conversion rates, and revenue generated, to evaluate the effectiveness of your campaigns and make data-driven adjustments as needed.
Step 9: Iterate and Optimize
Use the insights gained from intent data and performance metrics to iterate and optimize your ABM strategy. Refine your targeting, content, and messaging based on the feedback and results obtained, ensuring ongoing improvement and success.
For instance, Factors.ai integrates seamlessly with ad platforms, CRMs, CDPs, and other popular martech platforms through no-code (O-Auth) integrations. We install a lightweight script on websites to automatically track visitor engagement, including page views, scroll depth, button clicks, and form submissions.
Using IP-lookup technology, we can identify and track anonymous companies visiting a website, providing information such as company name, industry, and employee headcount. This helps qualify accounts based on ideal customer profile (ICP) criteria. Further, by consolidating all this data in one place, we can map the entire customer journey, starting from ad clicks and web sessions, to creating or updating contacts in the CRM, and ultimately tracking pipeline and revenue generation.
Our proactive approach enables the identification of anonymous accounts and their intent, allowing for effective targeting of sales-ready buyers. Additionally, retrospective tracking of the entire customer journey helps optimize spending on touchpoints that drive conversions, leading to increased pipeline with reduced expenses and better overall return on investment (ROI).
How Buyer Intent Data Improves Targeting, Personalization, and ROI in ABM
Intent data isn't just another marketing buzzword—it's a game-changer for how B2B companies tackle Account-Based Marketing (ABM). Let's dive into how it's shaking things up:
Sharper Account Targeting
Say goodbye to the old ‘spray-and-pray’ marketing tactics. With intent data, you can pinpoint which accounts are on the hunt for solutions like yours. This means you can zero in on the companies that are most likely to convert, making your efforts way more efficient.
Personalization at Scale
Imagine knowing exactly what potential clients are curious about. Intent data lets you do just that, so you can customize your messaging to hit the nail on the head. A manufacturing firm checking out automation solutions gets a different pitch than a healthcare provider exploring compliance tools. It's all about speaking their language.
Sales and Marketing Alignment
Intent data is like a translator between sales and marketing teams. Marketing can give sales a heads-up when target accounts show strong buying signals. In return, sales can share insights on which signals really mean "we're ready to buy."
Spotting Trends with Predictive Analytics
By digging into intent patterns, you can catch industry trends before they become mainstream. This gives you the upper hand to tweak your strategies ahead of time. For instance, if you notice a bunch of companies in a sector are looking into similar solutions, you can roll out targeted campaigns before your competitors even realize what's happening.
This isn't just theory—it's happening now. Companies using intent-driven ABM strategies are seeing quicker sales cycles and better conversion rates. It's all about being ahead of the curve and making your marketing smarter.
Real-World Use Cases: How Intent Data Drives ABM Success
Let’s skip the jargon and dive into how companies are actually hitting it big with intent data in their Account-Based Marketing (ABM) programs.
Take SugarCRM, for instance. They didn’t just stumble upon success; they harnessed intent signals to zero in on high-potential accounts, racking up a whopping $9.9 million pipeline value. Their secret? Pinpointing accounts that were actively on the hunt to buy.
Over in the tech world, a mid-sized software company saw their conversion rates soar by keeping an eye on who was checking out the competition. The moment they noticed an account researching rival products, they swooped in with targeted content that spoke directly to those prospects' pain points. The result? A 40% jump in qualified opportunities.
And it's not just tech companies seeing these wins. Check out these industry-specific success stories:
- Manufacturing: An industrial equipment provider spotted companies digging into automation solutions and tripled their meaningful sales conversations.
- Financial Services: A fintech firm fast-tracked their deals by 60% by focusing on accounts interested in payment processing.
- Healthcare: A medical device company nailed its timing with intent signals, boosting meeting acceptance rates by 35%.
The numbers tell the story:
- Conversion rates more than doubled.
- Sales cycles shrank by 30%.
- The average deal size grew by 45%.
- Customer acquisition costs dropped by 20%.
These aren’t just stats—they’re proof that when intent data fuels your ABM strategy, you’re not just playing the game; you’re winning it.
The Future of Intent Data in ABM
Intent data in Account-Based Marketing (ABM) is rapidly changing, and it's an exciting time to be in the mix. By end-2025, AI and machine learning will be true differentiators, not just crunching numbers but actually predicting what buyers will do next.
We're seeing a big move toward hyper-personalization. Companies are digging deeper than ever, going beyond just basic intent signals to really get what the whole buying committee is up to online. Multi-channel intent tracking is becoming standard, picking up signals from social media, virtual events, and even voice searches.
Privacy is still a hot topic. With global regulations getting stricter, successful ABM programs are finding ways to balance personalization with privacy. Think of GDPR and similar rules not as hurdles but as chances to build trust through clear and honest data practices.
AI integration is the real differentiator here. Imagine:
- Predictive models that can tell you when someone’s ready to buy with 85% accuracy.
- Real-time processing of intent signals that automatically trigger responses.
- Smart algorithms that can pinpoint who’s on the buying committee and what their roles are.
- Natural language processing that gets the context, not just the keywords.
The future isn’t just about gathering more data—it’s about making that data smarter, more useful, and respectful of privacy concerns. It's an exciting time for ABM, and the possibilities are endless!
Best Practices and Recommendations For Using Intent Data In ABM
Getting the most out of intent data in your ABM strategy isn't just about having the right tools—it's about using them wisely. Here's how the pros are making it work:
Strategic Framework
- Before diving into intent data, nail down your goals and KPIs.
- Set up a scoring system that ranks different intent signals by importance.
- Regularly review and tweak your strategy to keep it sharp.
Tools and Technologies
- Invest in a solid CRM that can pull in data from various sources.
- Use AI-driven platforms for real-time insights into intent data.
- Implement marketing automation tools that can respond to intent signals.
- Opt for tools that offer detailed analytics and reporting features.
Team Training and Adoption
- Offer thorough training for both your sales and marketing teams.
- Develop straightforward playbooks for handling different intent scenarios.
- Hold regular cross-team meetings to share insights and celebrate wins.
- Encourage team feedback on the tools they're using.
Remember, the best tech is only as good as the folks using it. Focus on building a data-driven culture where your team gets the value of intent signals and knows how to act on them. Start small, see what works, and scale up from there.
By integrating these practices, you can ensure that your ABM strategy is not only effective but also adaptable to the ever-changing landscape of B2B marketing. For more insights on how to leverage intent data effectively, check out our Intent Capture and Workflow Automations pages.
Key Takeaways
- Not all buyer intent is your buyer intent: While you may be tempted to look at all the data and figures before selecting your target accounts, messaging, and MarTech, it is best to keep your ICP and all the decision makers in mind.
- ABM without intent data is just traditional marketing: ABM focuses on targeting the "best-fit" accounts rather than casting a wide net. By aligning marketing messages with the needs and challenges expressed by potential buyers, businesses can increase the probability of success compared to traditional marketing approaches.
- With intent data, you know where to start: Intent data helps prioritize and rank leads based on their level of intent, allowing businesses to focus on high-intent accounts and allocate resources effectively. Scoring and ranking, along with data analytics techniques, can help you get to the low hanging fruit first.
How Buyer Intent Data Is Revolutionizing ABM in 2025
Account-Based Marketing (ABM) has long promised precision targeting, but without buyer intent data, it’s a shot in the dark. This guide explores how marketing teams can now use intent signals to not only find in-market accounts but also tailor campaigns with sharper precision and higher return. With 98% of B2B organizations adopting ABM, the competitive edge now lies in how effectively intent data is used—across platforms, teams, and the entire buyer journey.
Marketers are no longer guessing who might be interested. Instead, they’re integrating real-time behavioral cues—form fills, content engagement, review site visits—into CRM systems and campaign workflows. From first-party site activity to third-party digital footprints, the combination offers a 360º view of account readiness. By aligning messaging to each decision-maker and customizing content across preferred channels, businesses are closing deals faster, with less wasted spend.
With predictive analytics, segmentation, and automated triggers, intent data isn’t just informing campaigns—it’s shaping them. And when integrated with tools like Factors.ai, marketers can track influence across touchpoints, proving marketing’s role in pipeline creation and revenue.
Frequently Asked Questions
1. Why is Buyer Intent important?
Buyer intent is crucial because it provides valuable insights into the mindset and readiness of potential customers. Understanding this intent allows businesses to create custom marketing campaigns with the specific needs and interests of their target audience. Creating campaigns with buyer intent in mind results in more targeted and effective communication, higher engagement rates, and increased ROI.
2. What is an example of buying intent?
Let's say a business owner searches for "best project management software for remote teams" on a search engine. This search query shows their buying intent as they are actively seeking a solution to address their specific need: managing projects for remote teams. By searching for the "best" software, they are indicating their intention to evaluate and potentially make a decision. This search query provides an opportunity for SaaS companies offering project management solutions to target and engage this potential customer with relevant marketing messages and compelling offers.
3. How do you identify buying intent?
You can identify buying intent by partnering with tools like Factors.ai. This platform helps you discover, qualify, and convert anonymous companies visiting your website, measure engagement trends, and helps you deliver objectively better ROI on marketing campaigns. Factors.ai also offers seamless integrations with 30+ marketing tech stack so all your data can be consolidated in one place.

How CMO Responsibilities are Evolving in the Age of Data Analytics and Visualization
Remember the days when the role of marketing was limited to promotions, campaigns, and branding? Because we…don't 😅. Marketing has evolved into an all-encompassing function that covers everything from demand generation and sales enablement to CX and pipeline growth.
And at the helm of all this? The Chief Marketing Officer.
CMOs today are responsible for far more than just creative strategy. In addition to leading traditional marketing functions, It’s essential for CMOs to stay on top of product-market fit, consumer trends, competitive landscapes, and marketing’s bottom-line impact on revenue.
And none of this would be possible without data.
In fact, 64% of marketing executives strongly agree that data-driven marketing is crucial to business success. But how exactly is data, analytics and visualization influencing (and even improving!) the responsibilities of a CMO?
This article highlights everything you need to know about the evolution of CMO responsibilities and the profound impact of data and technology on the marketing function.

Understanding The Current State Of CMO Responsibilities
Data and technology has transformed the current state of CMO roles and responsibilities. Here’s how:
Intuition can only take you so far
In the past, CMOs relied heavily on intuition and creative judgment to form strategies that may or may not work. These decisions were based on personal experience, high-level market trends, and subjective industry knowledge.

Now, CMOs work with data-driven insights to guide their decision making process. No doubt, intuition and personal judgment still play an important role in successful marketing. But it certainly helps to back up a hypothesis with hard-hitting numbers.
As businesses increasingly become digital-first, collecting relevant data across the customer journey has become far more accessible. Marketing leaders can leverage this data to drive results across brand strategy, customer acquisition, and retention by understanding what works and what doesn’t.
In addition to validating decisions, data-driven marketing also encourages dynamism and adaptability within various marketing functions. Experiments that would otherwise take months to produce results can be answered in a matter of days with journey analytics, heat maps, and A/B testing. This results in an agile, hyper-efficient marketing function that’s primed to optimize ROI and drive growth.
Data delights marketers & customers alike
Just as data and analytics benefits marketers, so does it benefit buyers and the overall customer experience. Back in the day, marketing teams had very little information to work with. CMOs had no choice but to make broad assumptions and rely on spray & pray tactics to attract buyers.
For one, targeting a wide audience with generic messaging can be expensive for smaller teams with limited budgets. Secondly, it can be ineffective (and annoying to customers) given that broad messaging that tries to appeal to everyone, generally appeals to no one.

Today, CMOs can use cutting-edge visitor identification technology, account scoring, and intent data to specifically target sales-ready buyers with relevant marketing initiatives. This improves the buying experience for customers by swapping spammy email blasts and cold calls with personalized initiatives for the right accounts at the right time. Ultimately, this personalized marketing bolsters brand perception, improves conversions with fewer resources, and drives customer lifetime value — which is far more cost-effective than acquiring new customers.
The more things change, the more they stay the same
Since the days of David Ogilvy, driving sales has been the north star for marketing. This, most definitely, hasn’t changed. That being said, the accuracy and granularity with which we can measure marketing's impact on revenue has improved dramatically in recent years.

Gone are the days of tedious, unintuitive marketing reporting. Several plug and play solutions can automatically consolidate marketing and revenue data across campaigns, content, website, CRM, and more under one roof. As we’ll see in later sections, this unified data can then be used for further analysis, visualization, and dashboarding.
It’s also easier than ever to quantify the influence of every customer touchpoint on pipeline and revenue with sophisticated tools like multi-touch attribution. All this, to help CMOs’ prove and improve marketing’s impact on sales.
How Is The Data Boom Shaping The World Of Marketing?
Now that we’ve established the importance of data and analytics, let’s explore a few data-based tools and techniques that CMOs can leverage to drive ROI and shape marketing strategy:
1. Customer Segmentation & Personalization
Customers, especially B2B ones, expect a personalized experience at every turn of the buyer journey. For instance, if you’re a CMO, you likely receive dozens of cold emails every week — but only respond to, if any, the well-researched, personalized mails that are actually relevant to you. It’s no different with any other buyer.

Customer segmentation allows marketers to slice and dice their audience based on firmographics (revenue range, head count, etc), technographics (techstack), and intent data (engagement, page views, etc). This in turns allows marketers to personalize their efforts and target high-intent buyers with tailor-made efforts. Less spam, better conversions: win, win!
2. Account Intelligence
B2B SaaS marketing teams invest heavily in driving relevant traffic to the company website. Unfortunately, even the most optimistic benchmarks find that only about 5% of website traffic actually convert through form submissions or sign ups. So is the remaining 95% of anonymous traffic simply taken to be potential pipeline down the drain? Well, until recently, yes 😳.
Now, with IP-lookup technology, marketing teams can tap into databases with millions of companies to identify accounts that are already visiting the website but are yet to convert.
How can CMOs and marketing teams use this?
- Optimize RoAS by retargeting accounts from paid ads who are yet to sign-up.
- Know in real-time when target accounts are live on the site, to strike while the iron’s hot
- Run relevant marketing efforts based on what target accounts are engaging with.
3. A/B Testing & Heatmaps
“What would work better on this landing page: Headline A or Headline B?”
Questions like this are exactly what A/B testing tools help answer with practical data. Rather than relying on individual judgment or biased surveys, A/B testing showcases multiple versions of a web page, creative, etc to a particular audience. Based on real-life performance, A/B testing can reveal what works better very quickly.
Heat maps are also valuable in identifying what visitors or users are engaging with within your website. This provides insight into points of resonance and friction for the target audience.
4. Customer Journey Mapping
B2B customer journeys have always been lengthy, nonlinear, and complex. To solve for this, several solutions (including Factors.ai) can help unify and visualize various touchpoints along the journey in an intuitive manner. This helps CMOs achieve a bird’s eye view of the entire buying process from first visit, to sales engagement, all the way to deal closure.

5. Multi-Touch Attribution
As businesses embrace digital transformation, CMOs and marketing teams are increasingly adopting multi/omni-channel marketing to deliver a consistent, persuasive experience to online buyers. Marketing channels range from search ads, email marketing, social media, organic blogs, marketplaces, and more.
Without making sense of the numbers, it can be difficult to know which of these channels actually influenced conversions. Multi-touch attribution is a sophisticated analytics technique that collects and credits every touch point along a customer journey based on its relative influence on conversions.

All the tools and analytics techniques discussed above rely crucially on data. The more voluminous and accurate your database, the more valuable the insights will be. The following section discusses a few practices for CMOs to make the most of their data.
Fulfilling CMO Responsibilities In The Age Of Data Analytics & Visualization
Here are a few key practices for CMOs to reap the benefits of data and analytics tools.
1. Build a culture around data
As previously mentioned, none of the tools or techniques discussed in preceding sections would be possible without data. It’s essential for CMOs to create a strong, unequivocal culture around data-driven marketing — whether it be maintaining hygienic CRMs or qualifying a hypothesis with data-backed experiments.
It’s also just as important to eliminate siloed data by unifying numbers and KPIs under one roof. This ensures that the entire department, if not organization, is on the same page.

2. Pick the right tools
Every marketing department is built different. CMOs must invest in appropriate tools and marketing technologies to support their team based on size, scale, and objectives. For example, heatmaps or attribution tools may not be essential to a smaller team that are just starting out. On the other hand, visitor identification, customer segmentation, and dashboarding tools can provide significant ROI for early-stage teams with limited budgets.
In addition to functionality, here are a few more aspects to consider when investing in a martech tool:
3. Create relevant dashboards
It’s definitely not feasible (or recommended) for CMOs to stay on top of every little marketing effort that the team’s working on. Instead, CMOs may rely on a bird eye’s view to guide strategy and improve performance at a higher level. CMO dashboards offer an intuitive view of all things marketing at a quick glance.
Suggested reading: The complete guide to building a SaaS CMO dashboard

Based on the nature of your business, your CMO dashboard may reflect marketing spends, marketing sourced-pipeline by channel, MQLs generated by campaign, and other high-level marketing KPIs. You definitely don’t need to be bogged down by CTRs and likes, unless otherwise there’s a true anomaly in performance.
4. Ensure privacy compliance
Lastly, in an increasingly privacy-first digital ecosystem, it’s important to ensure privacy compliance with all the tools and technologies that associate with customer data. SOC2 Type II and GDPR are industry-standard security frameworks that you should look for in every data-based product you’re considering investing in. (Psst…Factors is SOC2 Type II, GDPR, PECR, and CCPA compliant)

How CMOs Can Take Marketing Data From Insights To Impact
Before concluding this article, here’s a quick highlight of the profound value that data can have on influencing and improving CMO responsibilities in this digital age.
- Optimize spends: Rather than relying on guestwork, CMOs can confidently allocate spend towards initiatives that work. This results in less marketing leakage all around.
- Real-time decision-making: Rather than relying on intuition alone or waiting several weeks, CMOs can take a glance at a dashboard to make quick, data-driven decisions.
- Drive marketing ROI: CMOs may adopt powerful tools like attribution to understand what works when. This results in the efficient allocation of resources and maximum ROI.
- Reduce CAC: With the right set of data, marketers can personalize targeting and improve conversion rates with less spend. This, in turn, reduces the cost of acquiring customers and even improves the overall LTV of customers.
- Prove marketing impact: Finally, marketing data and data-leveraging tools help CMOs quantify the impact of marketing on bottom-line business objectives like pipeline & growth.
And there you have it. We’ve seen how data has well and truly disrupted the role and responsibilities of a CMOs. Luckily, it's only for the better. CMO responsibilities have transcended creative strategy to encompass a wide range of bottom-line objectives — all of which can be turbocharged with the right data analytics tools and technologies.
Curious to see how Factors help CMOs drive marketing results and business growth? We’d be happy to have a quick chat!

15 Marking Touchpoints that Will Guide Your Prospect to Book a Demo
Do you remember Takeshi’s castle and the historic skipping stones?
You jump on the right stones, and there you go, easy to reach the next level of the game. But what if you landed on the wrong stone? Everyone laughed! But that will not happen when you lose your prospect.
Your prospect is that smiling champ getting ready to play the skipping stones of landing on the right marketing touchpoints to reach the happy destination of having a product that solves their problem.
Fret not about the wrong stones, because in this post, we’ll help you pick the perfect 15 marketing touchpoints to help you guide your prospect to book a demo.
What Exactly Is a Marketing Touchpoint?
Marketing touchpoints or digital touchpoints are any form of customer interaction or point of contact that a potential customer has with your brand or company. Every time a potential customer engages with your brand, they're experiencing a marketing touchpoint. Marketing touchpoints can occur through various channels, such as advertising, social media post, email campaigns, events, customer loyalty programs, customer service, or even in-store experiences.
Role of Marketing Touchpoints in a Buyer's Journey
When it comes to marketing touchpoints, it's important for marketing teams to understand that they go beyond just providing information. Each touchpoint should evoke a certain emotion in the customer, whether it's excitement, trust, or happiness. These emotions can influence how the person feels about your brand or product, ultimately leading them towards making a purchase decision. The key here is to have a strong understanding of your customer preferences.
The buyer's journey goes through three important stages: awareness, consideration, and decision.
1. Awareness Stage
This is the first stage of the buyer journey.
Here, the buyer is aware of a pain point that they have. Let's say your potential customer is browsing their LinkedIn feed and comes across an ad for a software company specializing in project management tools. They are already struggling with project management or thinking of switching to automation from manual management.
The ad features an attention-grabbing headline and a compelling image and mentions a free trial offer. That's it! Your LinkedIn ad serves as a marketing touchpoint for the awareness stage, as you've captured their interest in your company and products.

2. Consideration Stage
Now that the buyer has identified a pain point and is sure of it, they will start to evaluate various solutions to their problem. Let’s say that the potential customer has clicked your LinkedIn ad.
They now get directed to your company's website, where they see an interactive product demo, one of the customer experience touchpoints embedded on your website that showcases your product in action and helps the buyer make an informed decision.
This makes a stronger case for the potential buyer to consider your product, as the product demos allow the buyer to see the features and benefits of your product and how it can solve their pain points. When they see your product in action and are convinced you might be a good fit, they shortlist you into their consideration set and move to the next stage.
You can also use other product-focused touchpoints during the consideration stage, such as product tours, product-focused blog posts that show your product in action, and product webinars. These touchpoints provide valuable insights into your product and help the buyer determine if it fits their needs well.
3. Decision Stage
Level three is the most important stage, where the buyer decides which product or service to purchase.
They want to see proof that it's worked for other businesses. At this stage, the buyer goes to your company's website, wanting to find a case study about a similar business that successfully implemented the tool and saw positive results. But guess what? Since they already saw your product in action via product demos and product tours, they are already almost convinced about the purchase.
But marketing touchpoints such as the case study gives that little nudge to build trust and reassure the business owner, ultimately leading them towards making a purchase.
15 Marketing Touchpoints to Motivate a Demo Booking
We’ll share 15 rewarding marketing touchpoints, real-time customer touchpoint examples from top brands, and how you can use them in different stages of the buyer’s journey.
1. Social Media Advertising
First in line - You can run social media ads targeting potential customers to create awareness about your product or service. For example, check out Hubspot’s ads on its social media channels targeting business owners to discover how their CRM platform transforms prospecting, connecting, reporting, and collaboration like never before. With bold graphics and clear visuals, their LinkedIn ad is designed for easy absorption while browsing.

Why Social Media Advertising Is a Good Marketing Touchpoint?
- Its highly targeted nature allows businesses to target specific audiences based on demographics, interests, and behaviors.
- Allows creating campaigns tailored to your ideal customers' needs and preferences, increasing the likelihood that they will engage with your content.
- Potential to reach a large target market for promoting your products or services.
2. Educational Blog Posts
Good old long form of content creates wonders. Nothing compensates for creating informative content that addresses the pain points of your target audience and provides solutions.
For example, check out this Moosend’s blog post - What Is Email Marketing? A Beginner’s Guide For 2023. It has everything one needs to know to streamline a successful email marketing process, from definition to benefits and practices. Ultimately, they cleverly made the reader understand how Moosend can help them with everything mentioned in the blog.

Why Blog Is a Good Marketing Touchpoint?
- Helps to drive traffic to your website and attract visitors who are interested in your offerings.
- An effective way to establish yourself as an authority in your industry.
- A very interactive way to engage with your audience is by encouraging comments and if it interests your visitor, it also helps with qualified lead conversions.
💡 Pro tip: In your product-based blog posts, embed product demos as GIFs to show your product in action
3. Webinars
Hosting webinars can be an effective marketing touchpoint as it provides valuable insights and demonstrate your expertise to potential clients.
Check out how ActiveCampaign developed a series of webinars dedicated to announcing its product updates as part of its customer touchpoint strategies. ActiveCampaign used these webinars to promote the company and communicate easily with its customers.

Why Webinars Is a Good Marketing Touchpoint?
- By sharing valuable insights and expertise, you can build credibility with your audience and also increase brand awareness.
- Allow for interactive engagement and position you as an expert in the field with attendees, including live Q&A sessions, polls, and customer satisfaction surveys.
- Can be accessed by attendees from anywhere in the world, making them a cost-effective way to reach a large audience
Customer Testimonials
A very happy marketing touchpoint and no one can deny it. Share the success stories of your loyal customers to showcase the effectiveness and value of your product or service. Check out Notion’s testimonial that made social media cool again. It had the perfect balance of hook, story arc, visuals, takeaway, and music that led everyone to explore Notion’s features.
Why Customer Testimonials Is a Good Marketing Touchpoint?
- When potential customers see positive reviews from existing customers, they are more likely to trust your business and make a purchase.
- Creates an emotional connection with potential customers by sharing real-life experiences of how your product or service has helped solve a problem or meet a need.
- Showcases newer use cases of how your existing customers are using your product, thereby motivating prospects to make a purchase.
5. Product Demos
Offer product demos to potential customers, with no strings attached. Allowing them to experience your product or service firsthand can be a good marketing touchpoint. Topylyne’s product tour is an excellent example. The very first pop-up explains what Topylyne does and how users can benefit from it.
You can learn more about creating a product demo that converts here

Why Product Demos Is a Good Marketing Touchpoint?
- Helps prospects see your product firsthand with the right product placement, how it works, and how it can benefit them, which can be more persuasive than simply reading about it or watching a video.
- Low-risk for potential customers because they can try your product or service without committing to a purchase.
- Gives your business a competitive advantage by setting you apart from competitors who don't offer a similar experience.
💡 Pro tip: Interactive demos can provide a hands-on experience of your product or service, which has better engagement than a static product demo
6. Chatbots or Live Chat on the Website
A crucial touchpoint that provides real-time support to potential customers through chatbots or live chat on the website.
Check out Hubspot’s live chat and how they use it creatively. Live chat gives these communities an opportunity to have real-time discussions and help Hubspot’s potential customers.

Why Live Chats Is a Good Marketing Touchpoint?
- Allows existing customers to get instant support and answers to their questions, which can help to build trust and confidence in your business so that they stick to your brand.
- Increases engagement by providing a convenient and accessible way for both prospects and customers to interact with your business.
- Offers assistance and guidance to potential customers. In the process, also collects their contact information for follow-up.
7. Referral Programs
It’s no secret that potential customers tend to trust recommendations from their peers more than any form of communication. In fact, a whopping 83% of customers consider friends and family as their most reliable sources of referrals. Check out Dropbox's referral program, which operates on a one-sided reward system. When you refer someone to Dropbox, you’ll both get extra storage.

Why Referral Programs Is a Good Marketing Touchpoint?
- When customers receive recommendations from their peers, they are more likely to trust the recommended product or service
- By incentivizing existing customers to refer their friends and family, businesses can acquire new customers without spending large amounts on advertising
- Referral marketing leads to a higher conversion rate compared to other forms of marketing
8. Promotional Emails
Promotional emails are different from other email campaigns and newsletters. They are sent for one particular purpose and that is to convert more potential customers. One such email is the cart abandonment email that provides an opportunity to remind potential buyers about their interest in a product and include personalized incentives, such as a free demo or consultation, and encourage them to complete the purchase. Check out Away’s cart abandonment email that motivates the recipient to complete a purchase using short, sweet, and no-distraction content.

Why Cart Abandonment Emails Is a Good Marketing Touchpoint?
- It serves as a reminder to customers about the items they left behind in their cart, encouraging them to complete their purchase and increasing conversion rates.
- Can be personalized based on the items in the customer's cart, making the email more relevant and engaging.
- Includes incentives such as discounts or free shipping, which can encourage customers to complete their purchases. These incentives can be a powerful motivator for customers who are on the fence about making a purchase.
9. Email Campaigns
Use email campaigns to send personalized messages and offers to potential customers. Check out this e-mail from Dropbox that strikes a professional and courteous tone while also providing clear instructions and links to template libraries. The call-to-action is prominently displayed, making it impossible to miss.

Why Email Campaigns Is a Good Marketing Touchpoint?
- By tailoring the message to the customer's interests and pain points, businesses can show how their product can solve their specific needs.
- Can include clear and prominent call-to-action buttons that encourage customers to book a demo.
- By sending targeted and relevant follow-up emails, businesses can remind customers of the benefits of their product and encourage them to take action.
💡 Pro tip: Embed a personalized product demo video in your email campaign, inviting the recipient to explore your product more.
10. Newsletters
Newsletters are a great marketing touchpoint as they provide an ongoing way to stay in touch with customers, offer valuable content, and can be targeted to specific customer groups, all while being cost-effective. Check out Invsion’s weekly newsletter which includes a roundup of their best blog content, favorite design links from the week, and a new opportunity to win a free t-shirt!

Why Newsletters Is a Good Marketing Touchpoint?
- Allows businesses to stay in touch with their customers and build ongoing relationships. By providing valuable content, such as tips, insights, and promotions, businesses can establish themselves as a trusted resource and stay top-of-mind with their customers
- Can be tailored to specific segments of a business's audience, allowing them to deliver targeted messaging and promotions to different customer groups.
11. Podcasts
Podcasts can be a highly engaging and informative way to showcase a product and its features. For example, The Customer Engagement Lab is a unique business-comedy video podcast that explores creative sales and marketing campaigns for customer attraction. With in-person interviews, round table discussions, and TikTok reaction customer segments, it offers a one-of-a-kind B2B experience.

Why Podcasts Is a Good Marketing Touchpoint?
- Through engaging conversations and storytelling, businesses can pique the interest of potential customers and motivate them to book a demo.
- Offers the convenience of on-the-go learning. So it can reach a wider audience and create awareness about your product.
- Can increase their visibility and credibility and motivate potential customers to want to learn more about their product through a demo.
12. Offline Conferences
Offline conferences or Summits could be another one where companies can showcase their product, and everyone attendee can get a glimpse of the product. For example, Marketo's "Marketing Nation" community provides resources, events, and networking opportunities for marketers. By building a community around its product, Marketo effectively markets itself as a comprehensive and supportive solution for marketers.

Why Offline Conferences Is a Good Marketing Touchpoint?
- Provides an opportunity for businesses to interact with customers face-to-face, building personal connections and trust.
- Attracts a targeted audience, making it easier for businesses to find potential customers and tailor their product demos to their needs.
- Increases the pace of decision making such as booking a demo as offline events activates a part of the brain associated with active reflections on decision-making
Online Customer Reviews and Ratings
Online reviews and ratings on trusted platforms are a customer experience touchpoint that motivates your prospective customers to book your demo, acting as a marketing touchpoint. Check out this positive review of Storylane, an interactive demo platform that increases trust in that brand.

Why Online Reviews And Ratings Is a Good Marketing Touchpoint?
- Acts as social proof and help potential customers evaluate the quality and effectiveness of a product, which can motivate them to book a product demo.
- Increases a business's trust and credibility with potential customers, increasing the likelihood of booking a product demo.
- It provides insights into customers' needs and preferences, allowing businesses to tailor their product demos to meet those needs and preferences better.
💡 Pro tip: Drive user engagement and increase research time by embedding interactive videos on review platforms like TrustRadius and G2. Compared to video demos, interactive demos have 3 times more engagement and lead to an average research time of 40 minutes, while the average web user spends only 45-54 seconds on a website.
14. E-Books
E-books are a good marketing touchpoint as they provide value-added content that can help attract and engage potential customers. For example, The Social Media Trends Report by HubSpot shares insights from industry insiders and helps social media marketers how to adapt marketing strategies to take advantage of the ever-changing social media landscape.

Why E-books Is a Good Marketing Touchpoint?
- By creating informative and valuable e-books, businesses can establish themselves as thought leaders in their industry, thereby gaining the trust of their potential customers.
- Create an opportunity to collect email addresses and nurture the email list with valuable content, thereby staying on top of mind for your subscribers
- Encourages readers to learn more about their product and take the next step towards booking a demo.
15. Whitepapers
Whitepapers are a good marketing touchpoint as they establish thought leadership, provide valuable insights, and help generate leads. Check out Google’s Cloud Security and Compliance White paper. This explains the efficiency of Google Cloud products and services in keeping the data of any workspace safe and secure.

Why Whitepapers Is a Good Marketing Touchpoint?
- Whitepapers are educational resources that provide valuable insights on industry trends and challenges, positioning your business as a thought leader and expert in your field.
- By offering whitepapers as gated content, you can collect contact information from interested readers and follow up with personalized outreach, increasing the likelihood of booking a demo.
- Whitepapers can be repurposed into other formats, such as blog content or social media content, expanding your reach and creating multiple touchpoints for potential customers.
Measuring the Success of Your Marketing Touchpoints
Tracking successful marketing touchpoints is very important and is possible. But it isn’t always easy, as,
- Conversion types can vary widely. For example, some businesses rely on conversions like phone calls, live chat, and form fills to create leads that are then closed offline by sales teams. But it is quite a task to track the volume of these conversion types and attribute the closed revenue back to the marketing channels and campaigns that drove those conversions.
- Customer journey mapping can be lengthy. 15 is just a start. There can be hundreds of touchpoints for some industries. While some insight can be gained into which channels drive conversions, it can be challenging to attribute closed revenue to the proper channels.
- Crediting the last-click conversion is not sufficient enough. It is important to credit all supporting touchpoints in the customer motivation journey. Without proper lead tracking, ensuring that marketing channels and campaigns receive fair credit for driving revenue is impossible.
Wrapping Up
Understanding the customer's entire journey, business outcomes, and business goals is very important in deciding which marketing touchpoint can be effective for you. By understanding the buyer's journey, finding your customer journey map, and aligning the effective touchpoints accordingly, you can create a seamless experience for your customers. Diversify the touchpoints and experiment with new ones to stay ahead of the competition. Focus on providing value and building trust with customers and successfully use these touchpoints to increase the number of product demos booked and achieve their marketing goals!

SaaS Marketing Reporting Done Right: 5 Tips for Extracting Actionable Insights from Your Reports
In today's data-driven world, marketing teams are well aware of the importance of collecting and analyzing the right data to inform their strategies.
But, the sheer volume of data available can be both a blessing and a curse. It can lead to an abundance of insights or overwhelm teams while letting the right data go unused. 60% to 73% of all data in an enterprise is left unused when running analytics.
To ensure that your marketing team doesn't fall into this trap, you need proper marketing reporting in place. In this guide, we’ll talk about how you can create top-notch marketing reports specifically tailored for your company.
tl;dr:
- Marketing reports help with decision-making in SaaS marketing
- Before creating a report, know your primary goal, target audience, relevant metrics, report actionability, and reporting frequency
- Avoid common pitfalls like lack of data collaboration between teams, over-reliance on vanity metrics, and ignoring context when creating or analyzing reports
- Use visually engaging elements like graphs and charts for better and faster comprehension of complex data sets and trends
- Three important SaaS marketing reports—marketing attribution, campaign performance, and content marketing reports
- Use a powerful analytics platform like Factors to streamline your reporting process and gain valuable insights for data-driven decision-making
Marketing reporting basics: Questions to ask before you make your reports
Before diving headfirst into creating marketing reports, let’s take a step back and consider some critical questions. These questions will ensure that your report is not only comprehensive but also specifically tailored to the unique needs and objectives of your team and organization.
1. What is the primary goal of this report?
Before you begin creating a report, you must have the primary objective in place. This gives your reporting the necessary direction and will also make it easier to pick the right metrics for the report.

For instance, if you're creating a report on lead generation for your B2B SaaS company, you'll want to include metrics related to website traffic, lead conversion rate, cost per lead, and qualified leads generated.
2. Who is the target audience for this report?
Once you know the goal and pick the metrics according to the requirements, you need to think about the person reading the report. Not all metrics are important for everyone on the team.
For example, if you’re reporting to the upper management teams, focus on high-level metrics, such as revenue, overall performance, and other growth indicators. This audience wants to see the big picture and how a project or campaign aligns with the company's overall objectives.

For team leaders or project managers, including conversion rates, task completion rates, and individual performance indicators. Team leaders want to understand the team's performance along with the goal achievement.
Finally, we come to individual team members. For this set, focus on metrics relevant to their roles and responsibilities. This might include individual performance metrics, task progress, and any feedback or suggestions for improvement.
3. Which metrics should we be tracking?
Depending on the goals of your marketing efforts and the specific channels utilized, different metrics will be relevant to measure success. Here are five of the nine most important SaaS marketing metrics you need to track.

- Conversion rate: Measure the percentage of visitors who take a desired action, such as signing up for a trial or making a purchase.
- Marketing Qualified Leads (MQLs): Track the number of leads generated by your marketing efforts who are more likely to become customers.
- Customer Acquisition Cost (CAC): Calculate the average cost to acquire a new customer, including marketing and sales expenses.
- Customer Lifetime Value (CLV): Estimate the total revenue a customer will generate over the entire duration of their relationship with your company.
- Retention & Churn: Monitor the percentage of customers who continue using your SaaS product and those who cancel, to understand customer satisfaction and inform retention strategies.
We’ve covered these and other top SaaS marketing metrics in detail that can be valuable in your reporting.
4. How can we make these reports more actionable?
To maximize the utility of your reports, consider incorporating clear visualizations such as graphs or charts that showcase trends over time or performance benchmarks against industry standards.

This way, decision-makers can quickly grasp key insights without sifting through endless rows of raw data.
5. How frequently do we need to create and analyze these reports?
The frequency at which you create and analyze marketing reports depends on the specific goals and needs of your B2B SaaS company. However, here are some general guidelines on report frequency:
- Weekly: Weekly reports help you track short-term performance and make data-driven decisions. These reports often focus on metrics like website traffic, leads, and conversions.
- Monthly: Monthly reports provide a more comprehensive view of your marketing performance and allow you to analyze trends and patterns over a longer period. These reports typically include a broader range of metrics, such as customer acquisition cost (CAC), lifetime value (LTV), and churn rate.
- Quarterly: Quarterly reports help evaluate the effectiveness of your campaigns and make adjustments as needed. Quarterly reports often include a mix of high-level KPIs like revenue growth and more granular metrics related to specific campaigns and channels.
- Annually: Annual reports offer a big-picture view of your marketing performance and are important for strategic planning and goal setting. These include a thorough analysis of the key metrics, as well as an evaluation of your overall marketing strategy in terms of its alignment with the company’s goals.
5 marketing reporting mistakes to avoid in B2B marketing
As important as it is to create insightful marketing reports, you must avoid common mistakes that can diminish the value and impact of these reports. Here are some prevalent pitfalls in marketing reporting and examples of how they manifest in a B2B context.
1. Lack of data collaboration
In many B2B organizations, marketing data is siloed within individual teams. This leads to a fragmented and incomplete view of marketing performance. Without input from the sales team, the marketing team may be unable to determine lead quality or measure the efficacy of lead nurturing efforts accurately.
To solve this, you need to foster a culture of data collaboration and sharing. Businesses can ensure that all relevant stakeholders have access to the information they need to make informed decisions. A tool like Factors can help bring together data from various analytics and CRM platforms to give a complete 360-degree view of the marketing performance.
2. Not tying metrics to business outcomes
When creating marketing reports, prioritize metrics that directly impact revenue generation, customer acquisition, and retention. For instance, if one goal is increasing annual recurring revenue (ARR), make sure you're tracking metrics such as customer lifetime value (CLV) or churn rate alongside standard campaign performance indicators.
Also, track the number of marketing-qualified leads (MQLs) that convert to sales-qualified leads (SQLs) and ultimately close deals. This will give your readers a better understanding of how your marketing efforts have helped the company achieve its goals.
3. Over-reliance on vanity metrics
Vanity metrics may appear impressive at first glance, but they often fail to provide meaningful insight into marketing success. Instead of fixating on surface-level stats, dive deeper and examine how these figures impact crucial factors like lead generation, conversion rates, or sales pipeline growth.
Suppose you see an increase in social media following and engagement in a particular month. Looking at just the vanity metric, it may seem like the company is growing in the right direction. But if you dig deeper to find that the audience engaging with your content isn’t moving further down the funnel, the vanity growth adds no value to the company.
4. Disregarding context when creating or analyzing reports
Without context, interpreting marketing data can be misleading and result in poor decision-making. B2B marketers should consider industry trends, seasonal fluctuations, and competitor activities when analyzing their marketing reports.
For instance, in the case of a company that sells tax preparation software as a service (SaaS), there might be a significant uptick in subscriptions in the months leading up to the tax filing deadline. If this seasonal trend is not considered, the sudden increase could be misinterpreted as the success of a recent marketing campaign. Similarly, a drop in subscriptions after the tax season shouldn't automatically be seen as a failure in marketing efforts.
5. Overlooking actionable insights
Effective marketing reporting should provide not only data but also actionable insights that drive improvement. This requires a thorough understanding of the target audience, marketing goals, and key performance indicators (KPIs). As you craft your reports, add and present information such that it can be turned into specific actions or strategic decisions.
For example, a B2B software-as-a-service (SaaS) company can analyze its website's user behavior data, such as time spent on specific pages or click paths, to identify areas where potential customers may be dropping off during the sales process. After identifying the important areas, the company can make targeted improvements to its website layout, content, or calls to action, ultimately increasing conversion rates and driving more sales.
Tips to extract actionable insights from your marketing reports
To maximize the impact and utility of your marketing reports, it's essential to focus on extracting actionable insights that can drive decision-making and strategy optimization. Here are five tips to help you achieve this:
1. Define clear objectives
Start by outlining specific, measurable goals for each report. Are you looking to optimize your ad spend, improve customer engagement, or identify your most successful marketing channels? Knowing the objectives will help you focus your analysis and extract the most relevant insights.
For instance, if you’re looking for ways to increase sales, you may want to analyze your marketing channels and identify the most effective channels that drive conversions. Then, pinpoint the best-selling products that appeal to your target audience. With this, you can allocate your resources more effectively and make well-informed decisions on marketing strategies.
2. Understand the context of your data
Before making major changes to your marketing, consider external context that may influence performance. This can include industry trends, competitor actions, seasonal fluctuations, or even global events like economic downturns or pandemics.
Suppose there's a decrease in your trial sign-ups during a trade show. When you take that in context, potential customers may be busy attending sessions which can affect your marketing campaigns. Recognizing this helps avoid unnecessary changes to your strategies and helps you optimize your efforts around the event instead.
3. Segment your reports
Your customer-base is diverse. And understanding this diversity can help deliver the right information to the right group. Start by segmenting your marketing reports based on demographics, geography, behavior, or other relevant details. This will help you uncover trends, patterns, and preferences that can inform your marketing strategies.
For example, suppose you operate a project management SaaS. Through segmented reports, you discover that:
- small tech startups frequently use the platform for sprint planning
- larger corporations use it more for long-term project tracking
With this knowledge, you can now tailor the marketing messages to highlight the exact features and benefits that resonate with each segment—enhancing the relevance of your communications and positively impacting your conversion rates.
4. Improve visualizations
A well-designed visualization can make a world of difference in how easily you can understand and interpret your marketing reports. Use charts, graphs, and other visuals to present your data clearly and compellingly to your audience. People are more likely to consume and leverage visual data. Also, it’s easier to identify trends, spot anomalies, and draw accurate conclusions from visual plots compared to reading through tables of data.
To make visualization easier, use tools like Factors, PowerBI, or Google Looker Studio to create interactive dashboards that allow you to explore your data from multiple angles and extract valuable insights.
5. Embrace data storytelling
Data storytelling means weaving a narrative around your data, making it easier to understand, remember, and act upon. This can connect marketing data points with broader business objectives while keeping the presentations easy to digest. Stories can also help stakeholders better understand the significance of your marketing efforts.
For example, if your data reveals that a targeted content marketing campaign significantly boosted trial sign-ups and subsequently increased monthly recurring revenue (MRR), showcasing this storyline in your report will emphasize the strategic value of content marketing efforts.
3 types of marketing reports SaaS companies should be creating
To fully understand the impact of your marketing efforts and make informed decisions, you need to create and analyze various types of marketing reports. Here are three types of marketing reports that SaaS companies should be focusing on:
1. Marketing attribution reports
These reports help you understand which marketing channels or touchpoints contribute the most to achieving specific goals like lead generation or customer acquisition. By accurately attributing success to different initiatives, you can allocate resources more effectively and optimize strategies based on performance.

Suppose your marketing attribution report shows that LinkedIn advertising has consistently generated a high number of qualified leads at a low cost per acquisition (CPA). In that case, you may want to increase your ad budget for LinkedIn while reducing spend on lower-performing channels.
2. Campaign performance reports
Campaign performance reports are vital for measuring the effectiveness of individual marketing campaigns and initiatives such as email series, content promotions, or product launches. These reports typically include metrics like click-through rates (CTR), conversion rates, return on investment (ROI), and customer feedback.
For instance, if you recently launched a webinar series targeting C-level executives in the FinTech industry, your campaign performance report could assess registration numbers, attendee engagement levels, post-webinar survey responses, and any subsequent sales pipeline growth attributed to this initiative.
3. Content marketing reports
Content marketing is often an integral part of B2B SaaS companies' overall strategy. Monitoring the effectiveness of your content assets can provide valuable insights into what resonates with your target audience and drives desired outcomes such as increased website traffic or lead generation.

A comprehensive content marketing report may track metrics such as page views, time spent on a page, bounce rate, or social media shares for individual blog posts or e-books. Additionally, assessing how specific pieces of content impact broader business outcomes like trial sign-ups or revenue growth can further refine your understanding of your content's value.
When it comes to streamlining your marketing reporting process and gaining valuable insights, leveraging a powerful tool like Factors can be a game-changer. Factors’ comprehensive analytics platform offers an efficient way to generate marketing attribution, campaign performance, and content marketing reports, allowing you to make data-driven decisions that drive business growth in the B2B SaaS space.
Unlock the power of data-driven decision-making with stellar marketing reports
The modern data-driven world presents a double-edged sword for SaaS marketing teams. On one hand, it offers access to an abundance of data to inform strategies and drive growth. On the other, it poses the risk of overwhelming marketers, leading to valuable data being left unused.
To unlock the full potential of your data, you need to craft tailored, insightful, and actionable reports that address your unique business needs and objectives. Central to the process of marketing reporting are reporting and analytics tools that streamline and enhance your reporting efforts.
Enter Factors. Factors is an advanced B2B account analytics, attribution, and account intelligence platform that aims to help businesses drive more pipeline with less spend. By revealing anonymous companies visiting the website, decoding customer journeys, and providing valuable insights, Factors gives companies the data they need to make the right decisions and optimize their marketing strategies.
Don't let valuable insights slip through the cracks. Embrace data-driven decision-making and upgrade your B2B SaaS marketing game with powerful marketing reporting today.
FAQs
To further enhance your understanding of marketing reporting in the B2B SaaS context, here are some frequently asked questions with concise answers:
1. What are the main components of a marketing report?
A typical marketing report may include:
- An executive summary highlighting key findings and insights
- Data visualizations like charts, graphs, or tables for clear presentation of the conversion rates, traffic, session data, and leads and revenue generated
- Analysis of performance/results aligned with business objectives
- Actionable insights and recommendations for optimization or improvements
- Appendices with raw data or supplementary information as needed
2. How do you run a marketing report?
To create an effective marketing report, follow these steps:
- Set clear objectives and goals for the report
- Determine which metrics are most relevant to your campaign or initiative
- Collect data from various channels (e.g., Factors, Google Analytics, CRM, social media platforms)
- Analyze the data within the context of your goals and industry landscape
- Present findings through clear visualizations and concise narratives
- Include actionable insights that guide decision-making or strategy adjustments
3. What is the objective of marketing reporting?
The primary goal of marketing reporting is to give in-depth insights into the performance of different campaigns or projects. It helps make decisions based on data by providing actionable suggestions for optimization or enhancement.
Marketing efforts are aligned with wider business goals in these reports. They can help discover growth opportunities and improve overall efficiency. This leads to achieving desired results such as generating leads or acquiring customers in B2B SaaS companies.

How To Use Intent Data To Drive Pipeline (Part II)
Hey! Have you read part one yet? Check out the first stage of our intent data program here: How To Use Intent Data To Drive Pipeline Part I. We also discuss what intent data is, why it’s important, and the various tools and people you’ll need to get the most out of your intent data.

In part II, we discuss the remaining three stages of the intent program process:
- Stage 2: Enrich & Prospect
- Stage 3:Engage & Convert
- Stage 4: Measure & Report
Let’s jump right in..
2. Stage Two: Enrich & Prospect

Up until this point, we’ve identified ICP accounts visiting the website and notified sales reps with relevant details. But actually reaching out to leads within these accounts involves making an educated guess as to who may have visited. Here’s what we suggest:
Step 4: Enrich relevant contacts
Enrich account-level information with contacts that are likely to be part of the buying committee using the aforementioned enrichment tools (Apollo, Zoominfo, Lusha, etc). Key contact data includes:
- Name
- Job title
- Work email
- Phone number
For example, a martech product likely sells to marketing executives. In this case, it would make sense to find CMOs and Marketing VPs from the companies visiting your website.
Assuming you have a good idea as to what these buyer personas are for your company, identify 3-6 contacts based on their roles in the buying committee: user, champion, decision maker, influencer, and blocker.
Here’s an example of a buying committee for an account identification tool like Factors:

Step 5: Prioritize the right accounts
Based on your website traffic, you may identify thousands of ICP visitors every week. The ability to reach out to every single one of those accounts will depend on the maturity and scale of your intent program and sales team.
Assuming that most early to mid-market companies aren’t in a position to target every account, here’s our F.I.R.E 🔥 framework to help prioritize who to go after first:
1. Fitment: Divide your ICP criteria into 3 tiers (Great fit, Good fit, Poor fit) based on a combination of the following factors:
- Deal size - expected contract value
- Deal velocity - time to customer conversion
- Deal win rate - probability of closure
In general, deal size tends to increase as accounts progress from SMB to mid-market to enterprise. Similarly, the further up-market you go, the slower the deal velocity. Win rate varies based on size and industry. Once divided, it's that much easier to prioritize targeting based on company size, short sales cycle vs long sales cycle accounts, or low-hanging fruits with high win rates.
2. Intent
While a company may fit your ideal client profile, they may not be sales-ready. Some buyers may be aware of the problem but not the solution or the product, while others may be sales-ready and wholly aware of the problem, solution and product.
This is where intent data plays a huge role in determining a prospect’s readiness to buy. Here’s an example:
Gauge prospects based on what stage of the buyer journey they’re in and prioritize accounts based on buying intent.
3. Recency
Research finds that reaching out to prospects quickly dramatically raises the odds of conversion. Recency establishes how recently an account has been looking to solve a problem with your solution. This can be measured by identifying the last active time of a particular account.
For instance, a high-fit account that’s repeatedly visiting your company’s G2 reviews over the past 24 hours should be prioritized over an equally high-fit account that visited your homepage several weeks ago.
4. Engagement
Engagement is complementary to Intent but provides broader insights into where accounts are coming from and what topics they’re specifically interested in.
For example, an account reading a “what-is-xyz?” article may indicate that it is still way up in the awareness stage as compared to a visitor from a search ad on a landing page or a visitor reading a “comparison” article.
Monitoring engagement also helps understand what content appeals most to your target audience. Let’s say that SMB account seem to be especially interested in the pricing page while enterprise accounts are interested in the security compliance page. If your ICP is enterprise firms, then it might make sense to highlight privacy related content more prominently to drive conversions.

Depending on your tech stack and the complexity of processes, the Enrichment & Prioritization steps of the process can be:
- Decentralized - handled by individual sales reps
- Centralized & Manual - handled by the data & research team
- Centralized & Automated - handled by workflows set up by marketing ops & sales ops
Once you’ve prioritized your accounts using the above framework, decide whether it’ll be sales or marketing that’s reaching out to warm up target accounts. Here’s an example of one mix, but feel free to experiment with different approached:
3. Stage Three: Engage & Convert

So far, we’ve identified companies, enriched ICP accounts with relevant contacts, and prioritized target accounts based on fit and intent. Next, marketing and sales do what they do best: reach out and convert sales-ready buyers. Remember to check out the sales engagement tools recommended in Part I for this.
Step 6: Multi-channel engagement
Even though we know we’re reaching out to high-fit, high-intent accounts, we can’t be sure that we’re reaching out to the exact individual who visited our website. And regardless, no one likes a cold, out-of-the-blue sales pitch.
Do not approach contacts from high-intent, de-anonymized accounts like you’d approach inbound hand-raisers. These contacts are yet to submit a form or explicitly communicate with your business.
That being said, these accounts aren’t exactly cold either given that we have context on their intent. Marketing and sales must work in tandem to warm up these accounts with appropriate, multi-channel engagement:
Factors can measure engagement on G2, Linkedin ads, and more. Here’s a quick summary of use-cases:
- Identify which companies are viewing your ads but are yet to convert
- Track the buyer journey at an account level across ads, website, and CRM
- Fine tune messaging, targeting (and retargeting) efforts based on engagement
Here’s an example of a multi-channel sales engagement cadence:
.avif)
Here’s a sample template for prospect that show website intent:

Here’s another one for prospects that show intent from G2:

Step 7: Qualify buying intent
Earlier in this intent program, we qualified accounts based on fit and intent. But once we’ve established contact, it makes sense to qualify accounts again to know where to double down. BANT is an excellent framework for this:
Here are a few more qualifying questions to gauge customer-fit and intent:
- What triggered your search for a solution?
- How have you been solving this up until now?
- Have you explored other alternatives?
- What factors will influence your purchase decision? What are the non-negotiables?
4. Stage Four: Measure & Report
Finally, we’re at the last stage of the intent program — crunching the numbers.

Step 8: Track and optimize the intent funnel
Once qualified accounts start converting and generating pipeline, it’s important to measure every step of the funnel from accounts identified to closed won pipeline. Here’s an exhaustive list of funnel metrics to measure the health of the program:
Make sure you keep track of these metrics across all tiers/priorities of accounts to better understand the quality of conversion. It’s also important to track traditional GTM metrics such as ACV, deal velocity, and win rates so as to be able to compare the intent program against standard inbound and outbound programs.

And there you have it! Intent-data is a powerful tool to accelerate pipeline without significant additional investment. We strongly recommend the program discussed over the course of this two-part series to dramatically improve inbound, outbound, and ABM efforts across the board. Overall, we’ve seen great, real-life success with customers using similar workflows.

Curious to see how Factors in action? Book a demo with us here.

How To Use Intent Data To Drive Pipeline (Part I)
All Roads Lead To Revenue
There’s no doubt that top of the funnels like traffic and opportunities remain important indicators to B2B marketers. But increasingly, high-growth marketing teams are held accountable for bottom-line business metrics like pipeline and revenue.
That being said, driving deals is easier said than done. With limited budgets, tight competition, and volatile markets, go-to-market teams need an efficient alternative to make the most of their resources.
Enter: Intent data
Intent data captures buyer intent so you can identify, target, and convert high-fit sales-ready accounts. Here’s what this means for your team:
- Intent-based outreach, as opposed to cold outreach
- Targeted ABM efforts, as opposed to spray and pray tactics
- Deal acceleration for existing or lost accounts in the pipeline
When used efficiently, intent data can wring out every bit of ROI from existing marketing and sales efforts. The following guide highlights how to leverage intent data to drive more pipeline, with less spend.
What Is Intent Data?
Intent data is any data that provides information about customer behavior and buyer intent across campaigns, websites, review sites, or more. There are 4 types of intent data: zero-party, first-party, second-party, and third-party:
- Zero-party intent data: Data that a buyer explicitly shares. (Eg: demo form with Name and Email fields)
- First-party intent data: Data that’s collected from buyer’s interaction with a business. (Eg: Web sessions, page views, button clicks, etc)
- Second-part intent data: Data collected from another company’s first-party data (Eg: First-party data from review sites like G2 or Capterra)
- Third-party intent data: Aggregated data from multiple sources (Eg Bombora intent data)
Why’s Intent Data Important?
1. Efficiency gains: Just a few years ago, businesses were ready to buy, buy, buy. These days, companies are far more conservative. Longer sales cycles, lower win rates, and shrinking contract values all point towards this.
That's why prospects that are considering your solution are that much more important. However, only about 5% of website traffic actually converts — leaving the remaining 95% of visiting accounts completely anonymous.
Using intent-data in tandem with account identification tools helps discover, qualify, and convert up to 64% of sales-ready companies already visiting your website. Tap into a pool of mid/bottom of the funnel accounts who are yet to convert with zero additional spend. Here are a few questions you can answer:
- Which ICP accounts visited a landing page through a search ad but didn’t submit a demo form?
- Which companies are reading bottom of the funnel product blogs at least 50% of the way?
2. Early-intent detection: Studies find that buyers are 57% along the buyer journey before contacting a sales rep. Fifty. Seven. Percent! By this stage, in-market accounts have done their research and formed a rough idea as to which vendor they’re leaning towards.
Intent data helps identify buyer intent much, much before a form is submitted. This gives teams a significant first mover advantage in establishing the initial evaluation criteria, building relevant relationships, and improving the odds for a higher ACV.
It would mean beating competitors to the sales by reaching out to sales-ready prospects before anyone else does. While getting there first isn’t everything, it certainly helps.
Ingredients To Leverage Intent Data
We’ve established that intent data is pretty valuable. But how to collect intent data? Who should be involved? And what’s a comprehensive way to leverage this data to drive pipeline? This section covers the tools, people & process that make intent data work.
1. Tools
Here are all the tools you’ll need to identify, track, report, and activate intent data.
1. Intent Data Providers
Data is essential to make this work. Start by identifying a handful of sources for various types of intent data. This doesn’t have to be complex or expensive, the following tools are a great starting point:
- First-party data - Factors.ai, 6sense
- Second-party data - G2, Trustradius, Capterra
- Third-party data - Bombora, Leadsift, Contentgine
Factors is a account intelligence tool that delivers industry-leading IP-lookup technology to identify up to 64% of companies visiting your website. This includes company name, firmographics (industry, headcount, revenue-range, etc), and behavioral data (page views, scroll-depth, button clicks, etc)
2. CRM
A CRM acts as a single source of truth to unify intent data for the entire GTM engine across sales, marketing, and customer success. You’re likely already using a CRM such as HubSpot or Salesforce. Other alternatives include Zoho, Pipedrive, and Leadsquared.
3. Enrichment Database
Once accounts visiting the website have been qualified for fit and intent, use an enrichment database to identify the appropriate people to reach out to. A few popular enrichment tools include:
- Apollo
- Zoominfo
- Lusha
- LeadIQ
4. Sales Engagement
The following sales engagement tools help sales reps and marketers automate the outreach process across multiple channels including email, phone calls, and social media:
- Outreach
- Outplay
- Salesloft
- Klenty
- LinkedIn Sales Navigator
5. Internal Communications
Push real-time alerts to internal communication tools like Slack or MS teams when new companies or existing leads from target companies are live on the website.
We’ll cover how each of these tools work in tandem in the process section of this article.
2. People
These are the stakeholders and responsibilities involved in mastering intent data.
- Marketing: Assign a demand gen lead or program manager to stay on top of all things marketing
- Sales: Assign a sales manager to stay on top of all things sales. Onboard a team of SDRs/AEs to activate the intent data by reaching out to high-intent leads and nurturing mid-intent prospects.
- Operations: Given that this is a relatively elaborate, data-heavy workflow, assign a mar/sales ops to setup the initial framework, ensure accurate reporting, and
- Data & research: While several tools can identify accounts visiting your website, it’s impossible to reveal the exact individual visitor. If possible, onboard a researcher to enrich company-level visitor data with the appropriate prospects to reach out to within each company. A researcher to sales rep ratio of 1:4 is recommended, but not necessary.
- Executive sponsorship: Needless to say, it’s important that senior executives are aligned on who’s working on what, and why. There must be clarity in terms of deliverables for each function involved in the process.
3. Process
Bringing it all together, is the following 4-stage, 8-step intent program process to leverage intent data.
.avif)
1. Stage One: Identify & Notify
As previously mentioned, there are several types of intent data. When it comes to setting up an intent-based outreach program, it’s best to start with first-party website IP-to-company identification data. For one, the website is the most voluminous touchpoint in a B2B/SaaS buyer journey. For another, starting with account identification from website traffic is a low-effort, high-impact initiative involving minimal investment.
The remainder of this article zeroes-in on leveraging first-party account identification data. That being said, the process remains largely the same for other types of intent data.
Step 1: Invest in an account identification tool
When it comes to account identification tools, there’s no shortage of alternatives. Here’s why we recommend Factors over others:
- Better data-accuracy: Factors taps-into 6signal — an industry-leading account identification to reveal up to 64% of anonymous website visitors. That’s 27% more than the likes of Clearbit or Kickfire.
- Cost-effective plans: Plans start as low as $99/month including dedicated onboarding support and customer success management. More pricing details here: factors.ai/pricing
- Advance analytics: Given that Factors is built on strong account analytics foundations, users can achieve granular visibility into website KPIs, visitor behavior, and account timelines.
Step 2: Filter accounts based on fit and intent
Of course, not all website traffic will make a great fit for your business. Refine the total set of accounts identified to just those that fit your ideal client profile using firmographic and technographic filters.
For example, maybe you’re only interested in companies visiting your website that meet the following criteria:
- Industry: Software, IT, Education
- Geography: US & Canada
- Employee headcount: Under 500
- Technology: HubSpot, Google Ads
But even still, not every one of these companies may be ready to buy. With Factors, you can filter down the list of ICP companies to high-intent accounts based on their engagement. For example, maybe you’re only interested in ICP visitors that spend at least 60 seconds on high-intent pages such as pricing or features.

Step 3: Notify stakeholders in real-time
Once a criteria for high-intent, ICP accounts has been established, use Factors to push real-time alerts on Slack, MS teams, or Email when accounts that match this criteria are live on the site. This notification may be shared with sales reps to take action while the iron’s still hot.


Phew…this is a pretty involved read so we’ve split the remaining three stages of this intent program here: How To Use Intent Data To Drive Pipeline Part II. Read on to understand how to enrich, engage, and convert sales-ready accounts with intent-data and account identification.

The Complete Guide to Building A SaaS CMO Dashboard
Tracking campaign performance across marketing channels can be a tedious and unintuitive process. CMOs often have to rely on individual department reports to gather a summary of how the team is performing – an endeavor that leaves many gaps and relies heavily on guesswork.
In addition to the time it takes to compile reports, derive actionable insights, and chart next-steps, the traditional way of doing things is prone to several manual errors.
The solution? The perfect CMO dashboard that helps streamline your work based on relevant analytics and metrics under one roof.
This article shows how powerful CMO dashboards can be used to drive data-driven business decisions.
TL;DR
- CMO dashboards offer a holistic view of customer data-related metrics and KPIs through intuitive visualizations.
- The benefits of SaaS companies using CMO dashboards include rapid decision-making, sensible use of time and resources, improved ROI, and unified visibility of marketing performance.
- Before you build a comprehensive CMO dashboard, pay close attention to user-friendly design, use helpful visualizations, integrate platforms to consolidate data, and measure the right metrics/KPIs.
- SaaS businesses must track metrics/KPIs such as conversions, leads, traffic, conversion rates, acquisition cost per channel, retention and churn rates, customer lifetime value, and revenue and pipeline velocity by channel source. A CMO dashboard helps visualize these metrics and KPIs with clarity.
What is a CMO dashboard?
A CMO dashboard is a tool that reports and visualizes KPIs and metrics related to a company's marketing activities across demand gen, content, paid, events, and more. It is a centralized, bird’s eye view that helps marketing executives monitor and analyze marketing initiatives and performance in real-time.
There is no hard and fast rule to building a CMO dashboard for your SaaS company. That being said, there are certain elements that are essential for marketing leaders to identify patterns, track progression, and optimize strategies to drive bottom-line business objectives.
We’ll explore these essential ingredients in later sections of this blog.
Why do CMOs need to use dashboards?
Here’s a look at the top benefits of using a well-designed CMO dashboard:
1. Improves decision-making
When making expensive business decisions, relying on guesswork can cost you heavily. CMO dashboards help marketing leaders make well-informed and accelerated decisions based on data-driven insights.
For example, a CMO dashboard can help you identify which channels and marketing campaigns are not performing if you're making budget-related decisions. It also enables you to identify the reason behind poor campaign performance and the following steps to be taken.
Let's say you have the company blog, paid advertising, and podcasts as key marketing channels. A deep dive into the dashboard will help you uncover how much revenue each channel can generate, the cost of leads from each touchpoint, and how long it typically takes them to convert.
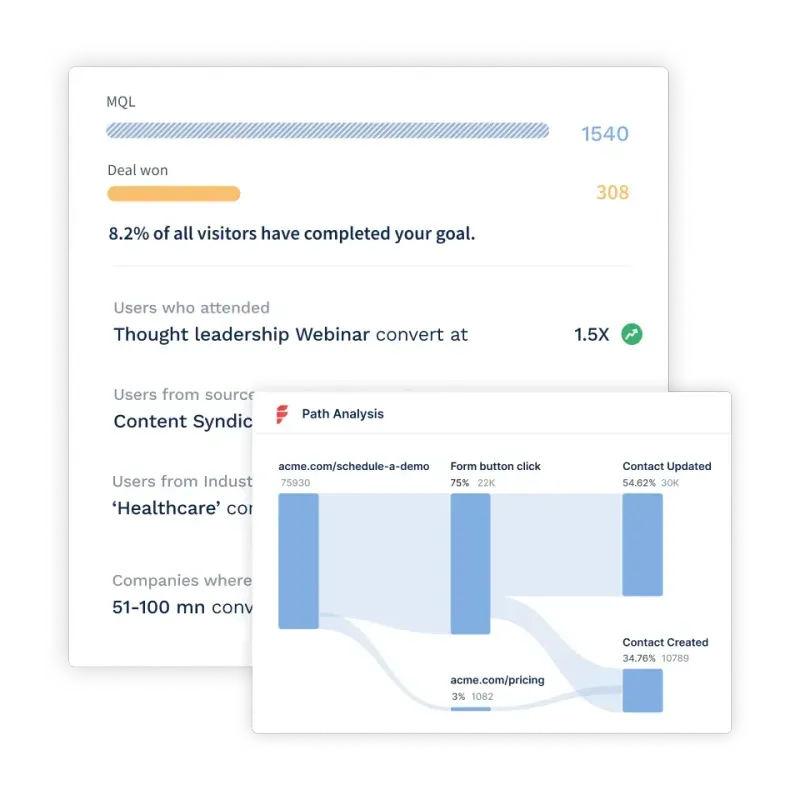
2. Offers a quick overview of data without wasting time and resources
A CMO dashboard lets you save hours of work and wasted resources on collecting and processing raw data from scratch.
CMO dashboards extract and present an accurate overview of essential data from platforms or sources such as LinkedIn, Facebook, YouTube, articles, Google Ads, and more.
For example, let’s say you’re calculating the number of sessions on your website that come through various channels. A CMO dashboard will gather the data from all the channels, creating an easy visual for you to see which has driven the most sessions.
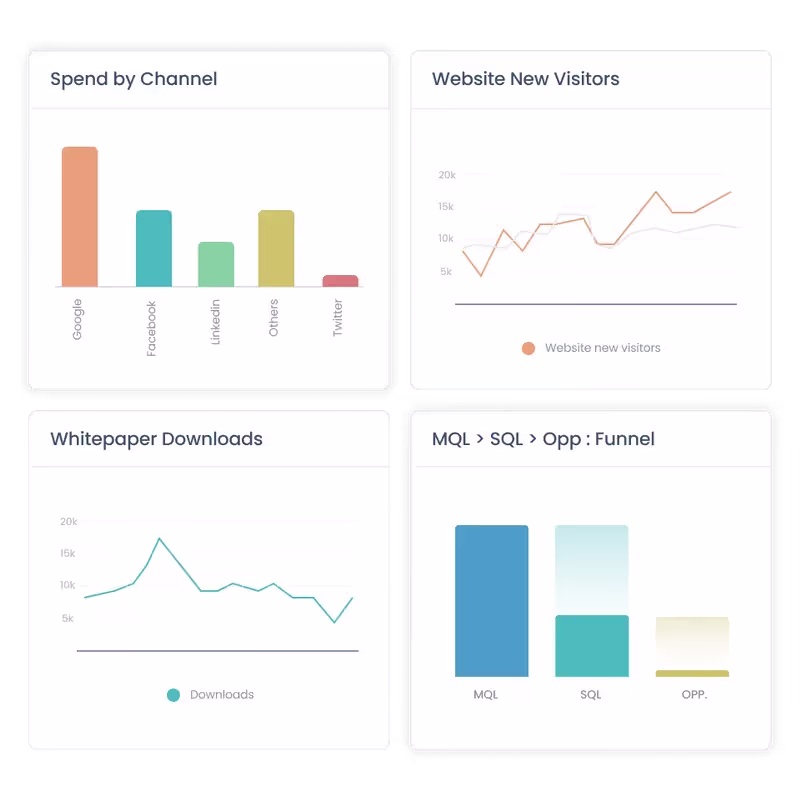
3. Helps identify trends and patterns
With all the data condensed onto one dashboard, CMOs and their teams can collectively take note of repetitive patterns in their target audience. This helps them further understand which type of campaigns work well on what channel and when leading to the ability to adapt campaign resources on the go.
For example, the company publishes a blog on the website every Tuesday. But they also post a video on LinkedIn on the same day. Over time, a CMO dashboard can display which content formats perform better on Tuesdays, helping the team double down their focus on that channel alone.
Key considerations when building a CMO Dashboard
An effective CMO dashboard is the central hub for monitoring marketing performance, aligning teams, and driving data-backed decisions. When designed thoughtfully, it becomes an invaluable strategic asset.
1. Intuitive and action-oriented design
A CMO dashboard is defined by its ease of use and ability to drive decisions. A cluttered, text-heavy layout overwhelms users with data but does not provide enough context to make decisions.
In contrast, a clean, visual interface tells a straightforward performance story that connects insights to actions and helps make data-backed decisions. Here are a few considerations for an insightful dashboard.
Prioritize key metrics
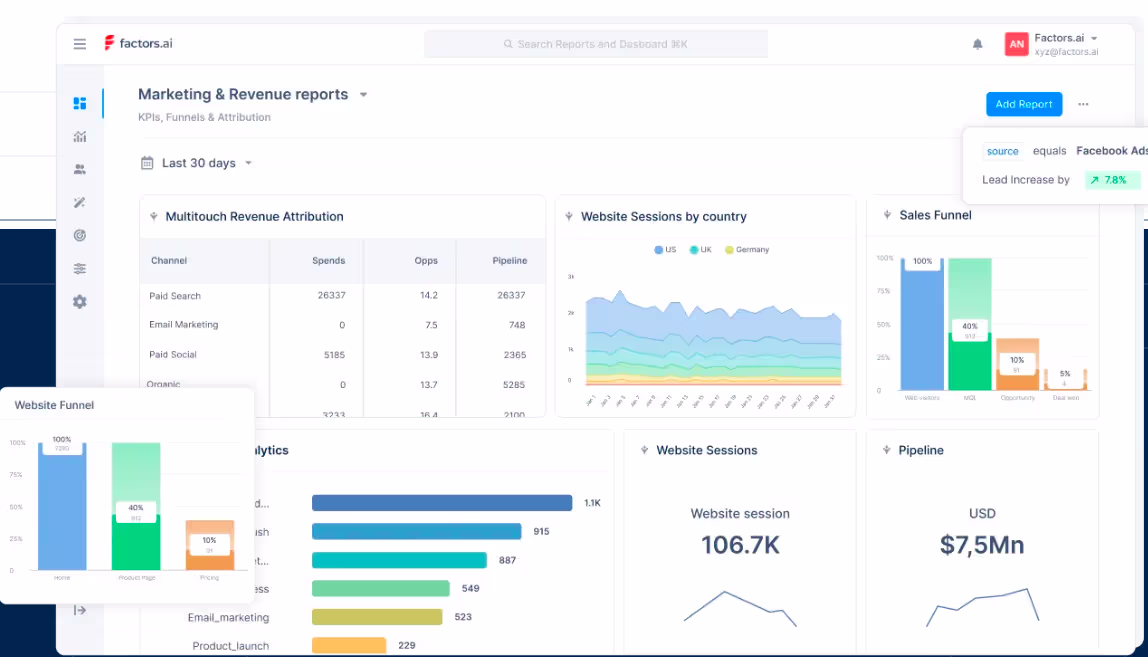
Prioritize the most critical metrics and add impactful visualizations like charts, graphs, gauges, and indicators to showcase them. For instance, use:
- Line charts to display trends over time for metrics like web traffic, conversions, etc.
- Comparison charts or pie charts to show channel effectiveness, campaign ROI, and more
- Funnel visualization to showcase drop-offs across the customer journey
- Alerts and gauges to highlight metrics nearing goals or thresholds
Optimize Information Absorption
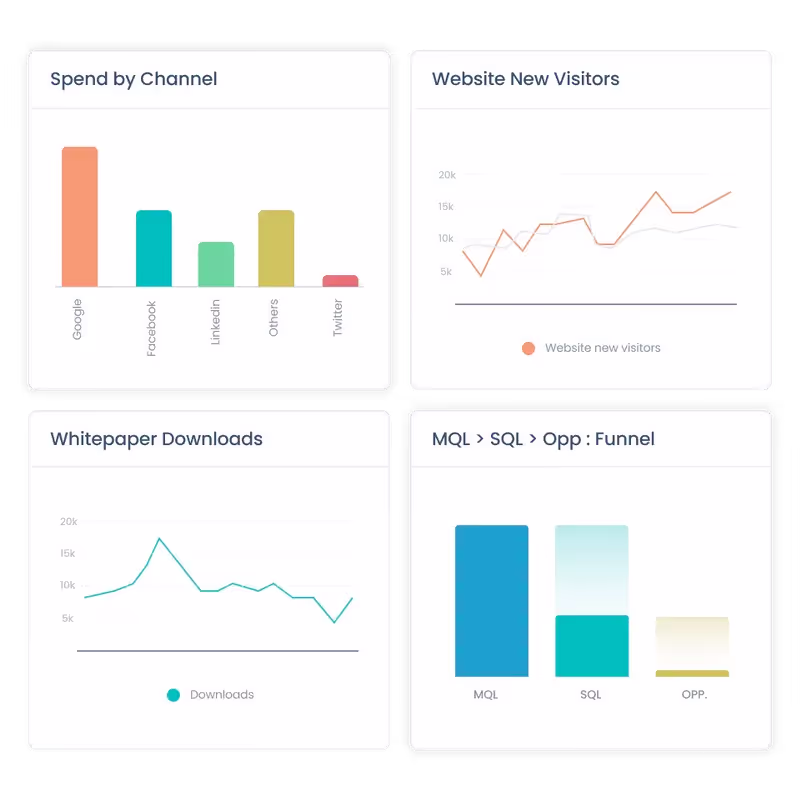
Use color coding, alerts, and trends to highlight priority areas at a glance. Make sure that your dashboards have ample white space for better data absorption.
Also, include explanatory captions and annotations to provide essential context.
Offer Intuitive Interactions
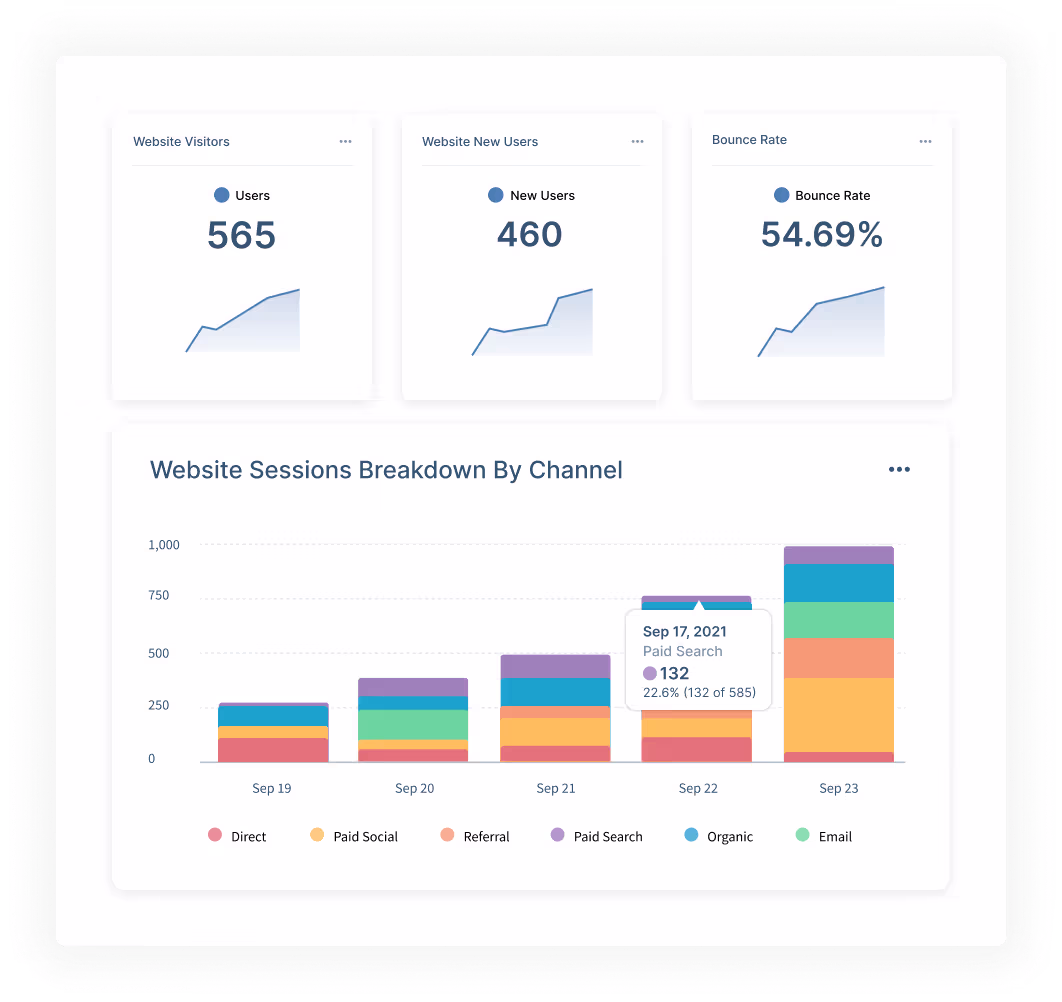
Offer intuitive interactions like drill-downs, filtering, and segmenting to customize views on demand. For instance, help users:
- Filter data by categories, campaigns, regions, or date ranges
- Drill down from aggregate metrics to detailed data breakdowns
- Isolate underperforming categories and campaigns
Such flexibility allows slicing and dicing data along different dimensions for deeper analysis.
Streamline Navigation
Create tabs or dropdowns to switch between views, campaigns, time frames, and other dimensions. Optimize compatibility across devices so users can access the dashboard anywhere conveniently.
Most importantly, align terminologies and visualizations to thought processes familiar to users through day-to-day work. Simplicity and intuitiveness accelerate adoption.
2. Unified Data Foundation Across Teams
Marketing cannot drive impact alone. Close alignment across teams provides comprehensive visibility into the end-to-end customer journey.
Break Departmental Silos
Integrate your CMO dashboard tightly with essential systems like CRM, sales analytics, web analytics, finance systems, etc. Automatically sync campaign data, lead status changes, deal progress, and other cross-functional data flows.
For instance, pull web visitor profiles from analytics platforms to enrich lead records. Or, pass lead quality assessment and scoring metrics from marketing to sales for better follow-ups.
Shared Visibility Through Attribution
Compare the performance of marketing-generated vs. sales-generated pipelines on metrics like lead quality, sales cycle times, win rates, and deal sizes.
Conduct multi-touch attribution to understand marketing's influence at each buying stage. Such unified visibility bridges departmental silos with shared goals and metrics, steering coordinated priorities across teams.
3. Flexibility to Highlight Strategic Focus Areas
While cross-functional data consolidation provides tremendous value, a one-size-fits-all dashboard rarely meets specialized business needs fully. You need the dashboard to be customizable and dynamic.
Customizable Templates
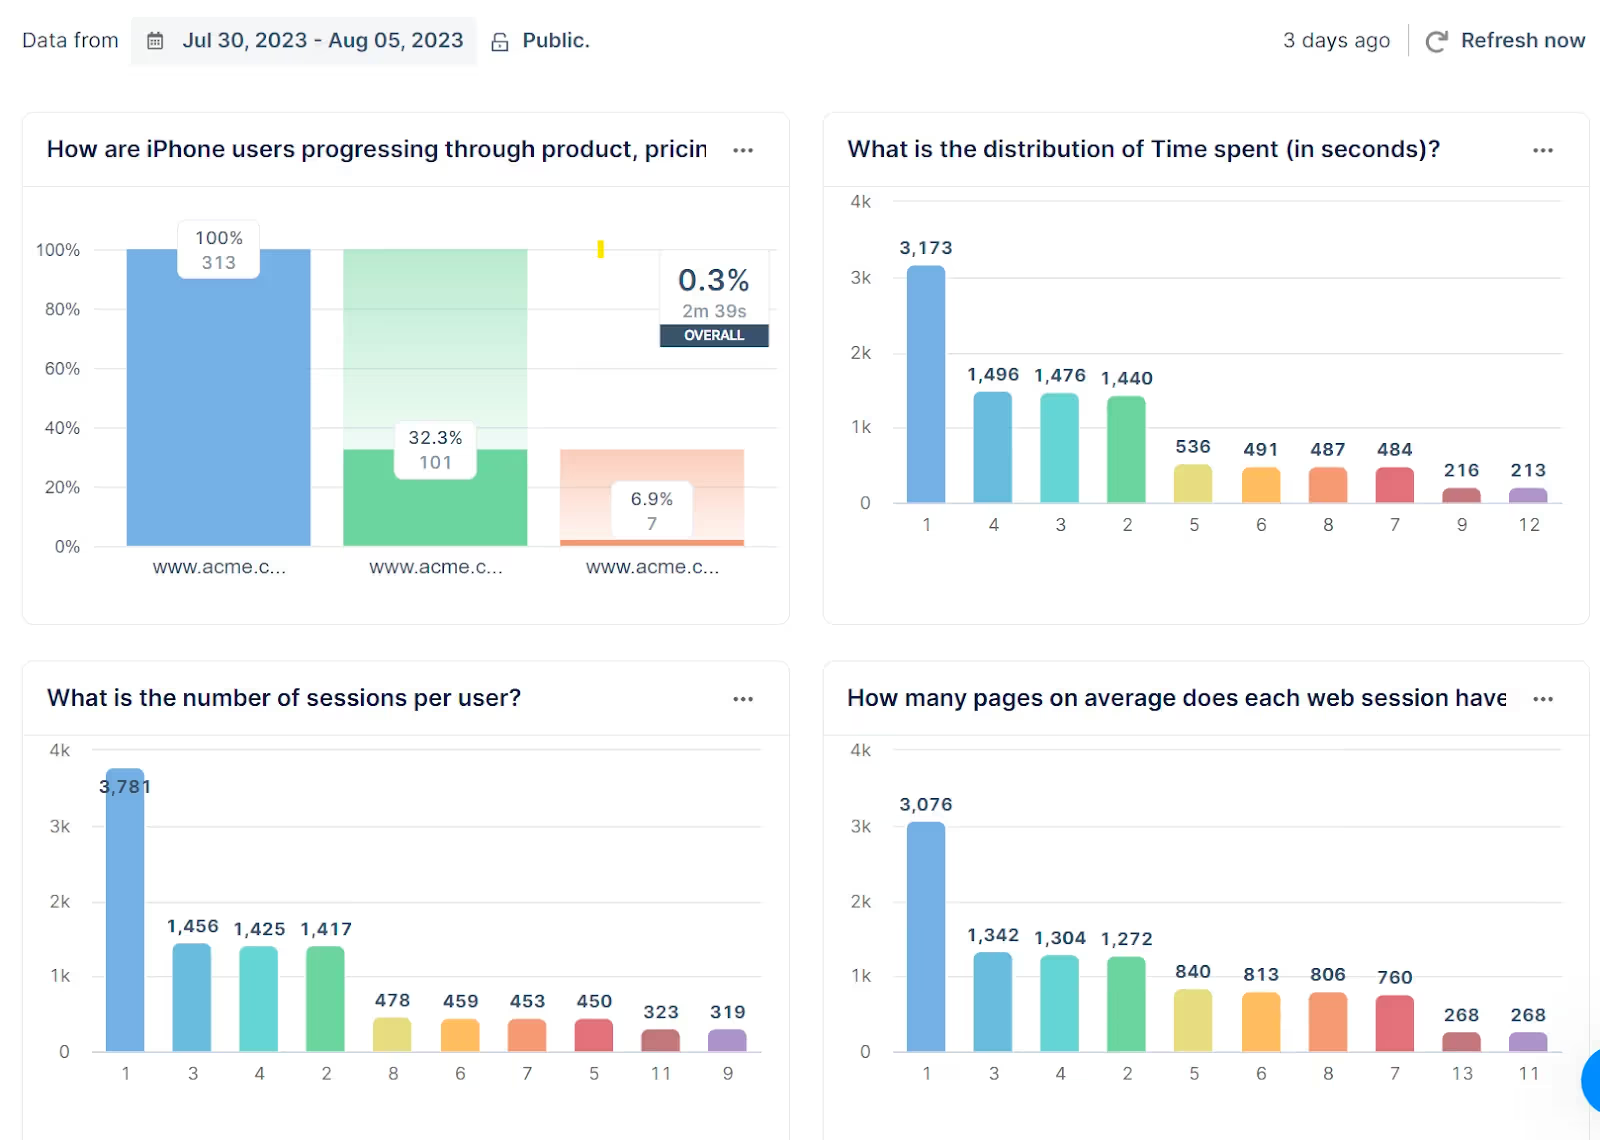
Empower users to highlight metrics aligned to their goals—broad awareness or targeted account-based sales—without relying on IT.
Provide pre-built templates for different personas and use cases that showcase industry-specific benchmarks more relevant to their context.
Dynamic Filtering and Segmentation
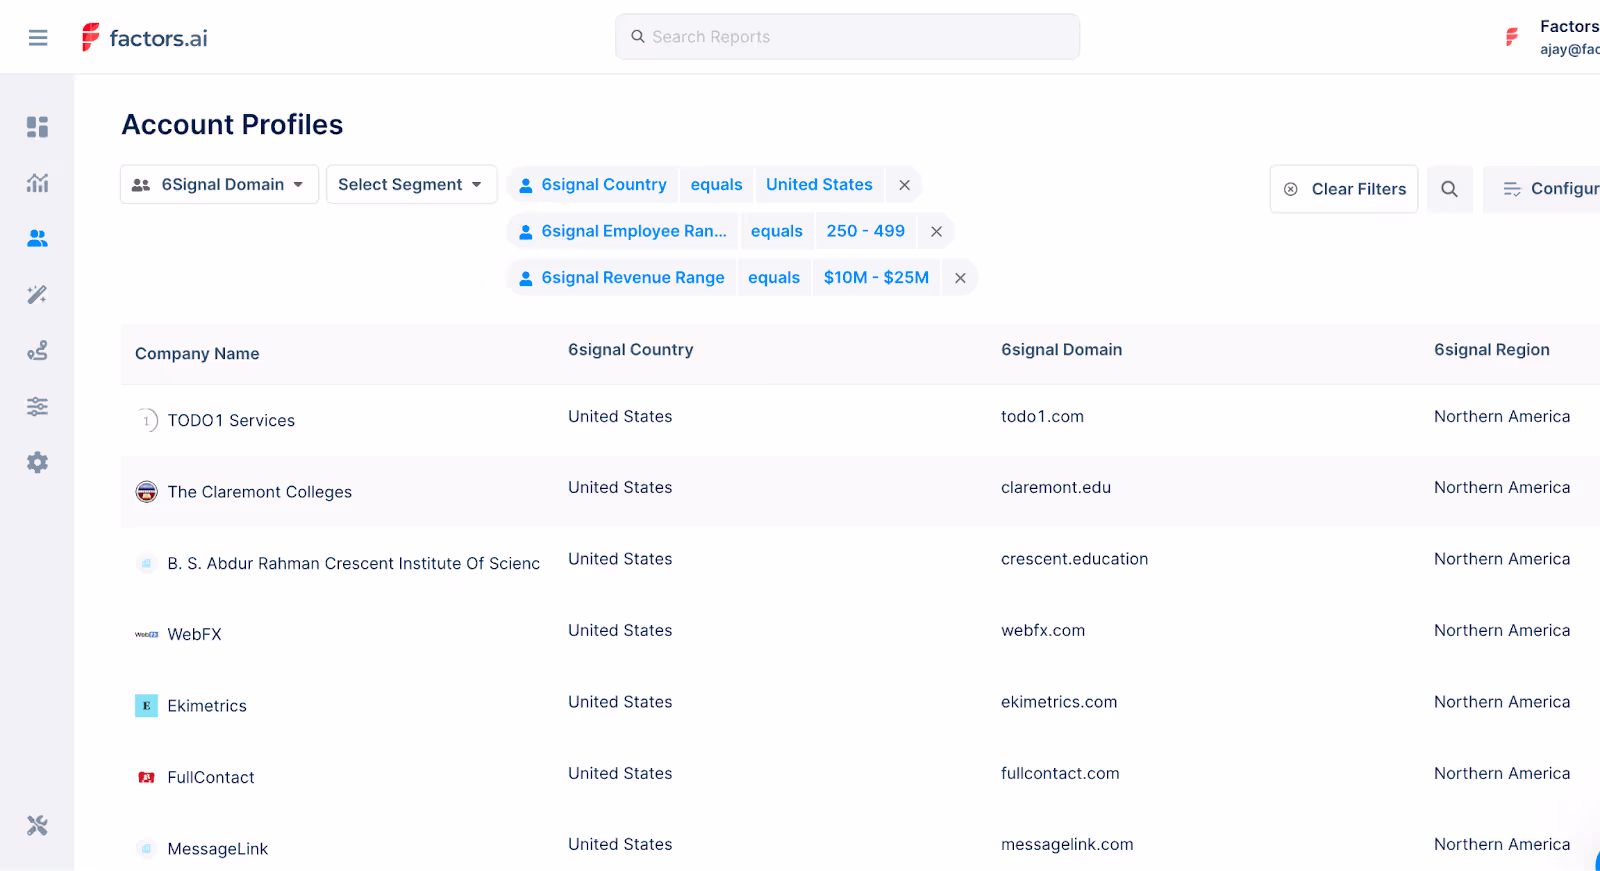
Offer easy-to-use customization options such as an intuitive template builder interface. Let marketers filter data views dynamically by parameters like region, customer persona, product line, etc.
Such flexibility allows teams to analyze performance through different lenses—whether for the leadership team or campaign managers. As business objectives evolve, custom-tailored dashboards stay focused on what matters most.
4. Ongoing Optimization and Iteration
No dashboard gets designed perfectly right from the beginning. As marketing campaigns and strategies adapt in response to market dynamics, your dashboards also continuously realign to maintain relevance.
User Testing and Feedback Analysis
Monitor usage patterns and user feedback to identify navigation, metric, or visualization enhancements: track clicks, hovers, and other interactions to uncover usability issues. Conduct user surveys and interviews to gather feedback.
Maintain Flexibility
Maintain flexibility for adding new datasets from emerging sources and channels. Continually experiment, test, and optimize to fulfill ever-changing information needs most effectively.
Through an intuitive and action-oriented design backed by an integrated, flexible data foundation, the CMO dashboard becomes a powerful nerve center driving shared visibility, coordinated execution, and data-informed decisions across the business.
CMO Dashboard KPIs and Metrics
A CMO dashboard can include tons of KPIs and metrics depending on what you’re trying to track. However, below are the ones that are of topmost priority:
1. Top-of-the-funnel metrics such as engagement, traffic, leads
Top-of-the-funnel metrics are brand awareness metrics like the engagement rate, traffic, and leads generated. Most SaaS marketing executives track these to attract the target audience and turn them into long-term subscribers.
1. Engagement rates are metrics used to measure and track the active involvement of your target audience for the content you produce. The engagement rate formula is:
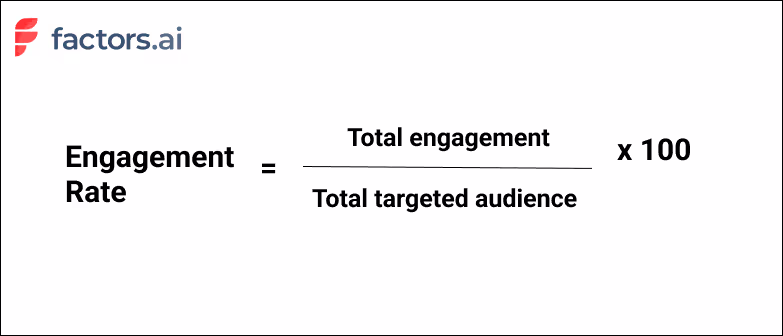
2. Traffic for SaaS companies is the volume or the total number of visitors their website gets over a certain time period.
3. Leads generated is a mandatory sales KPI every SaaS company must track. Measuring leads lets you uncover issues and nurture prospects further.
Why do these metrics matter?
Top-of-the-funnel metrics help measure the overall exposure of the target audience to your marketing efforts. Tracking and measuring them gives insight into what can help minimize roadblocks that stop prospects from signing up.
2. Conversion rates and efficiency
1. Conversion rates: measure the number of targeted users who converted from unknown prospects to engaged contacts. The higher the conversion rate, the more impact your marketing strategies have. The formula to calculate the conversion rate is:
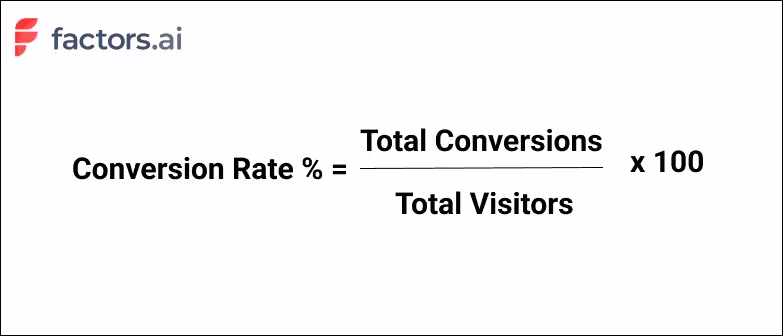
2. Efficiency: In marketing, the ROI measures the overall performance of your marketing efforts, and conversion rates directly indicate the performance. That means increasing conversion rates while reducing acquisition costs promises a better ROI and shows better strategy efficiency. The formula to calculate marketing efficiency is:
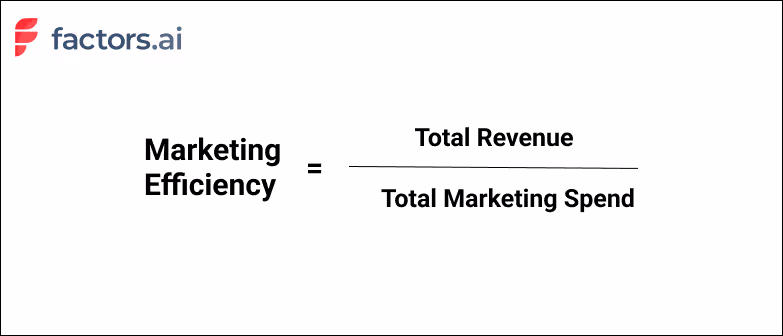
Why do these metrics matter?
Conversion rates and efficiency directly reflect how well your SaaS marketing activities are executed and determine the overall effectiveness of your business campaigns.
3. Cost of acquisition by channel
It’s best to track certain KPIs by marketing channels, such as social media, emails, ads, organic search, etc. Calculating the cost of customer acquisition (CAC) for each channel is one such KPI that indicates the marketing expenses spent on obtaining customers.The formula to calculate CAC by channel is:
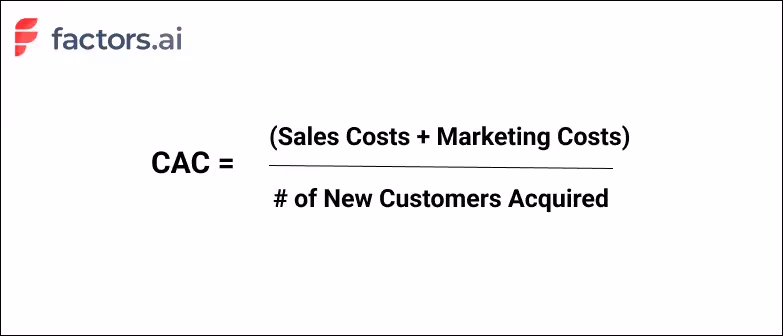
Why does this metric matter?
Measuring CAC lets you decide whether or not to pursue marketing for a particular channel and demonstrates high-performing marketing channels having low CAC.
4. Retention and churn rates
Customer retention and churn rates are opposites that indicate the number of customers retained or lost over a time period. The formula to calculate churn rate is:
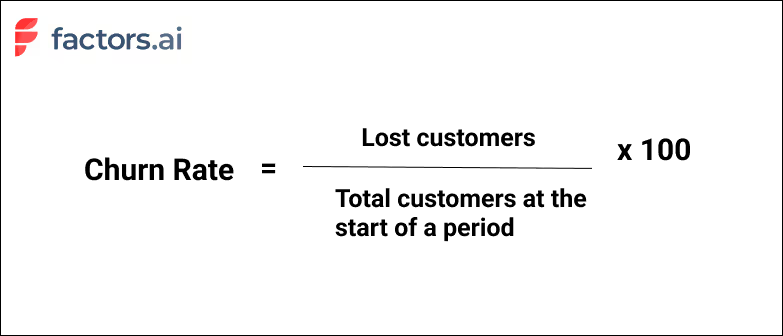
Why are these metrics important?
Customer churn and retention rates are one of the most important metrics for SaaS CMOs. Measuring churn rate can help shed light on why subscribers are refusing to renew your service, and based on high or low retention rates, you can decide whether to pursue the same strategies or refresh them.
5. Customer lifetime value
Customer lifetime value, or CLV, indicates the average pay throughout a customer’s relationship with your company. It is a critical SaaS KPI to showcase revenue as it conveys a customer’s worth on average. The formula to calculate CLV is:
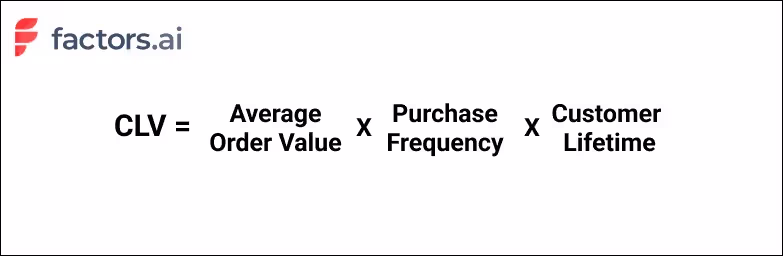
Why does this metric matter?
CLV is a critical SaaS business viability measure. It is essential for understanding the business value each customer brings and your SaaS company’s long-term potential.
6. Revenue and pipeline velocity by channel source
1. Revenue by channel source tracked by CMOs indicates how well their ads, campaigns, and other marketing efforts perform based on their source. Additionally, it tells you the aggregate revenue earned from successful conversions from each outlet.
2. Pipeline velocity by channel source is a key KPI indicating the speed at which leads move through your sales pipeline for each channel source.
Why do these metrics matter?
A high pipeline velocity means smoother onboarding processes and better conversions. So tracking this and revenue by channel source over various periods lets you improve conversions from each source.
7. Revenue Growth Percentage
Revenue growth percentage indicates how rapidly total company revenue increases over a set time, typically month-over-month or year-over-year. It shows the overall momentum and health of the business.
The formula to calculate revenue growth is straightforward—take the revenue difference between the current and past periods and divide that by the one-time period revenue.
For example, for year over year revenue growth, use the formula:
((Current Yearly Revenue - Last Year's Yearly Revenue) / Last Year's Yearly Revenue) x 100.
Why does this metric matter?
Monitoring rapid or declining growth % signals how well marketing and sales efforts are faring and hitting targets. When coupled with cost metrics, it also showcases profitability trends. Understanding growth by revenue streams also enables executives to double down on the highest traction channels.
8. Customer Lifetime Value
Customer lifetime value totals the likely earnings a business can generate from customers throughout their tenure. In essence, it conveys an average customer's worth.
The formula factors average order size, purchase frequency in a given period, and the average lifespan.
For instance, CLV may be calculated as: CLV = Average Order Value x Purchase Frequency Per Year x Average Lifespan in Years.
Why does this metric matter?
Tracking CLV over annual cohorts helps spotlight content, features, or channel innovations that make customers stickier. Comparing CLV vs acquisition cost also determines the breakeven period to recover expenses.
9. Cost Per Lead
Cost per lead signifies the average expenditure to generate a qualified marketing lead. It is calculated by dividing total lead gen marketing spend by the number of leads captured.
CPL can be calculated as: Total marketing dollars spent / Number of leads
If you spent $1000 to get 10 customers, that’s 1000/10 = $100 — Your CPL is $100.
Why does this metric matter?
Monitoring CPL trends determines the influence of brand equity on the sales funnel—a strong brand lowers CPL over time.
Comparing CPL by channel also helps optimize spending by identifying the lowest-cost customer acquisition sources. Analyzing CPL alongside customer lifetime value further ascertains profitable activities.
10. Brand Search Volume
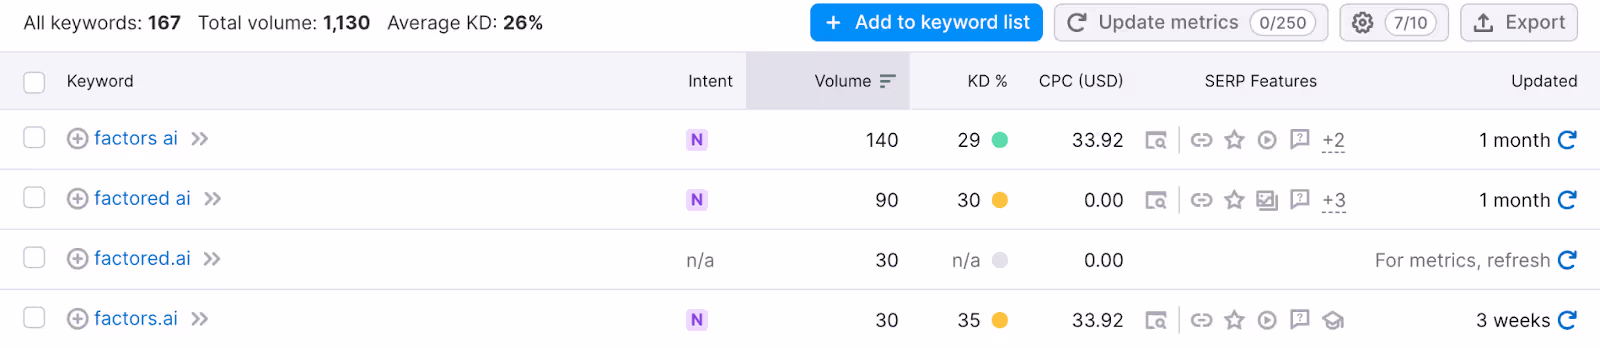
Brand search volume measures monthly search queries for your brand name and keywords. Sudden surges or declines show changing consumer interest.
Why does this metric matter?
Tracks brand visibility gains/losses to correlate awareness-building campaigns and events. Guides keyword targeting and content strategies.
Creating Effective CMO Dashboards in Factors AI
Over the course of this article, we’ve covered what a CMO dashboard is, what its benefits are, and a few common metrics for CMOs to track. But constructing a comprehensive CMO dashboard is easier said than done — unless of course, you leverage a tailor-made dashboarding tool like Factors.
Factors unifies and reports data across complex buyer journeys involving multiple stakeholders, touchpoints, and channels under one roof. What does this mean for you? No more individual tools to analyze campaign performance, website engagement, and pipeline/revenue related metrics.
It’s simply all the metrics you care about as CMO in one, intuitive, customizable dashboard. Here are a few nifty features loved by CMOs:
- Ad hoc filters and breakdowns: Slice and dice metrics and KPIs with a wide range of filters and breakdowns to answer questions like: “How does conversion rate vary between companies with at least 200 employees and smaller teams of less than 50?” or “What’s the difference in sales velocity between leads from paid search and organic social?”
- Automated AI-fueled insights: It’s one thing to have your data in one place — but how can CMOs make sense of the numbers? Factors offers automated insights into what’s helping and hurting a specific conversion goal. What’s driving demo form submissions? Our Explain engine may suggest Linkedin campaigns and the pricing page have a positive influence while Display ads and email outreach is limiting performance. This helps the larger team improve resource allocation and drive ROI.
- Custom funnels, KPIs, and properties: Every business has different requirements. This is no different when it comes to reporting and dashboarding needs. Factors supports limitless customizations to KPIs and properties so CMO dashboards can be tailor-made to the what matters most to you.
Curious to see Factors in action? Schedule a personalized demo here!
.webp)
The Ultimate Guide to Marketing Analytics for SaaS Companies
Marketing analytics has become an integral part of any successful marketing strategy.
The industry is expected to grow at a CAGR of 14.8% between 2023 and 2028. Meanwhile, businesses of all sizes must spend the time to upgrade their in-house tech and employee skill-set to stay ahead of the curve.
But with the industry peppering buzzwords and jargon, marketing analytics can seem more complicated than it actually is.
In this guide, we’ll work to make the complex simpler. We’ll discuss what marketing analytics is, why it is necessary, which teams and people in a company should look into it, common limitations and pitfalls, and more. Let’s get started.
What is Marketing Analytics?
Marketing analytics refers to the analysis of data to gain insights into the performance of marketing campaigns and activities. It relies on the number of leads generated, conversion rates, customer acquisition cost (CAC), and customer lifetime value (LTV). Analyzing these metrics can help marketers and founders pave the way for marketing campaigns.
For instance, marketing analytics can help businesses understand which marketing channels or strategies are generating the most leads or conversions, and which ones may need improvement. It can also help identify trends and patterns in customer behavior, preferences, and buying habits, enabling businesses to make more informed decisions about their marketing efforts.
This is done through the use of tools like Google Analytics, Looker Studio, Factors.ai, and others for data visualization, statistical analysis, and predictive modeling.
The data is analyzed from various sources, such as website traffic, social media platforms, email campaigns, and Customer Relationship Management (CRM) systems.
The Benefits of Marketing Analytics
Marketing analytics offers multiple benefits in a B2B context. It helps businesses with interpreting data and making the most accurate and informed decisions. But that’s just one aspect of it. Let’s take a look at some other benefits of marketing analytics:
Improves Targeting
Marketing analytics enables you to identify the most relevant and receptive audience for your product or service. Then combining demographic, psychographic, and behavioral metrics, you can create a detailed customer persona that represents your ideal target audience. This data-driven approach allows you to tailor your messaging, offers, and content to resonate with these individuals, ultimately leading to higher conversion rates.
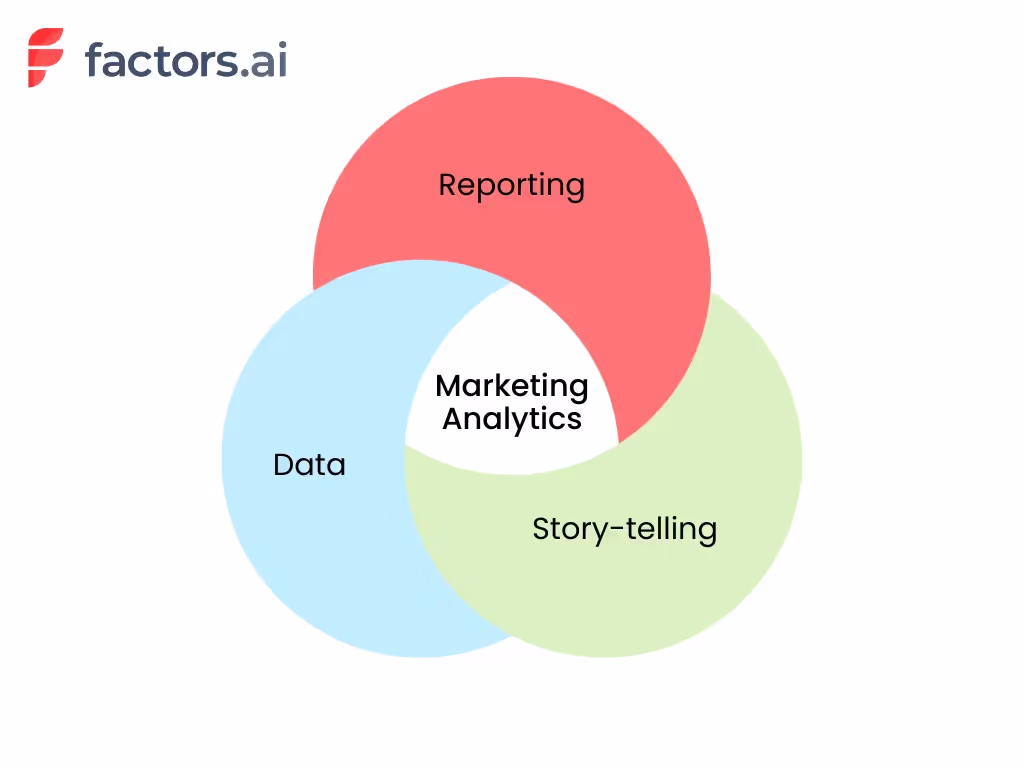
For instance, suppose your marketing analytics reveals that your most engaged customers are millennial entrepreneurs in the tech industry. In that case, you can fine-tune your marketing campaigns by focusing on the channels they frequent—such as LinkedIn and Twitter. Then begin creating content around industry trends, tips for startup growth, or case studies of successful tech entrepreneurs while subtly pitching your product or services.
Reduces Cost of Acquisition
The cost of acquiring a new customer can often exceed the expenses related to retaining an existing one. The average customer acquisition cost (CAC) including all SaaS industries is $704. Marketing analytics helps businesses identify the most cost-effective channels and methods for customer acquisition by studying metrics like cost-per-click, cost-per-lead, and return on ad spend.
.avif)
Let’s take an example here. Say your marketing analytics data shows that LinkedIn ads are generating a lower cost per acquisition (CPA) and higher conversion rate compared to Facebook ads. In this case, you can shift a larger portion of your ad budget to LinkedIn, driving down your overall cost of acquisition.
Improves the Customer Experience
86% of buyers are willing to pay more for brands that offer great customer experience. And SaaS companies doing $1 billion annually can expect to earn an additional $1 billion with just 3 years of investing in customer experience.
Analyzing customer feedback data can help SaaS marketers identify areas of improvement in their products or services. This leads to a better overall experience for customers. Marketing analytics can also help companies understand customer touchpoints, identify gaps in their communication strategies, and improve customer support.
Helps with Customer Retention
As time goes by, fewer and fewer customers stick around. This can be clearly demonstrated with the retention curve.
.avif)
However, spending money to retain existing customers is often more cost-effective than acquiring new ones.
Existing customers are 50% more likely to buy a product and spend 31% more on average than new customers. Marketing analytics can help businesses identify patterns and trends in customer behavior that may indicate potential churn or dissatisfaction.
For instance, if your marketing analytics reveals that customers who don't engage with your email campaigns are more likely to churn, you can modify your campaigns to launch a re-engagement strategy. You can target these at-risk customers with personalized content and offers to reignite their interest and loyalty. Sometimes, special pricing or preferential rates go a long way for customers.
Unveils Upselling Opportunities
Upselling is a powerful strategy in the B2B SaaS world. An average SaaS business generates 16% of its annual contract value (ACV) from upselling to customers. Companies doing $40 to $75 million annually can attribute twice as much revenue to upselling. With marketing analytics, you identify existing customers who are most likely to benefit from and be receptive to upgrading their current plans or purchasing additional products or services.
For instance, with marketing analytics data you may notice a few high-usage customers that could benefit from improved speed or better service offerings in your higher plans. Personalizing an upsell for those businesses and accounts can help you better improve your bottom lines in the long run.
What’s the Difference Between Product Analytics and Marketing Analytics?
Product analytics and marketing analytics are two important types of analytics that businesses need to use for making informed decisions. Unfortunately, these terms are used interchangeably and can cause confusion. Let’s look at the differences between product analytics and marketing analytics.
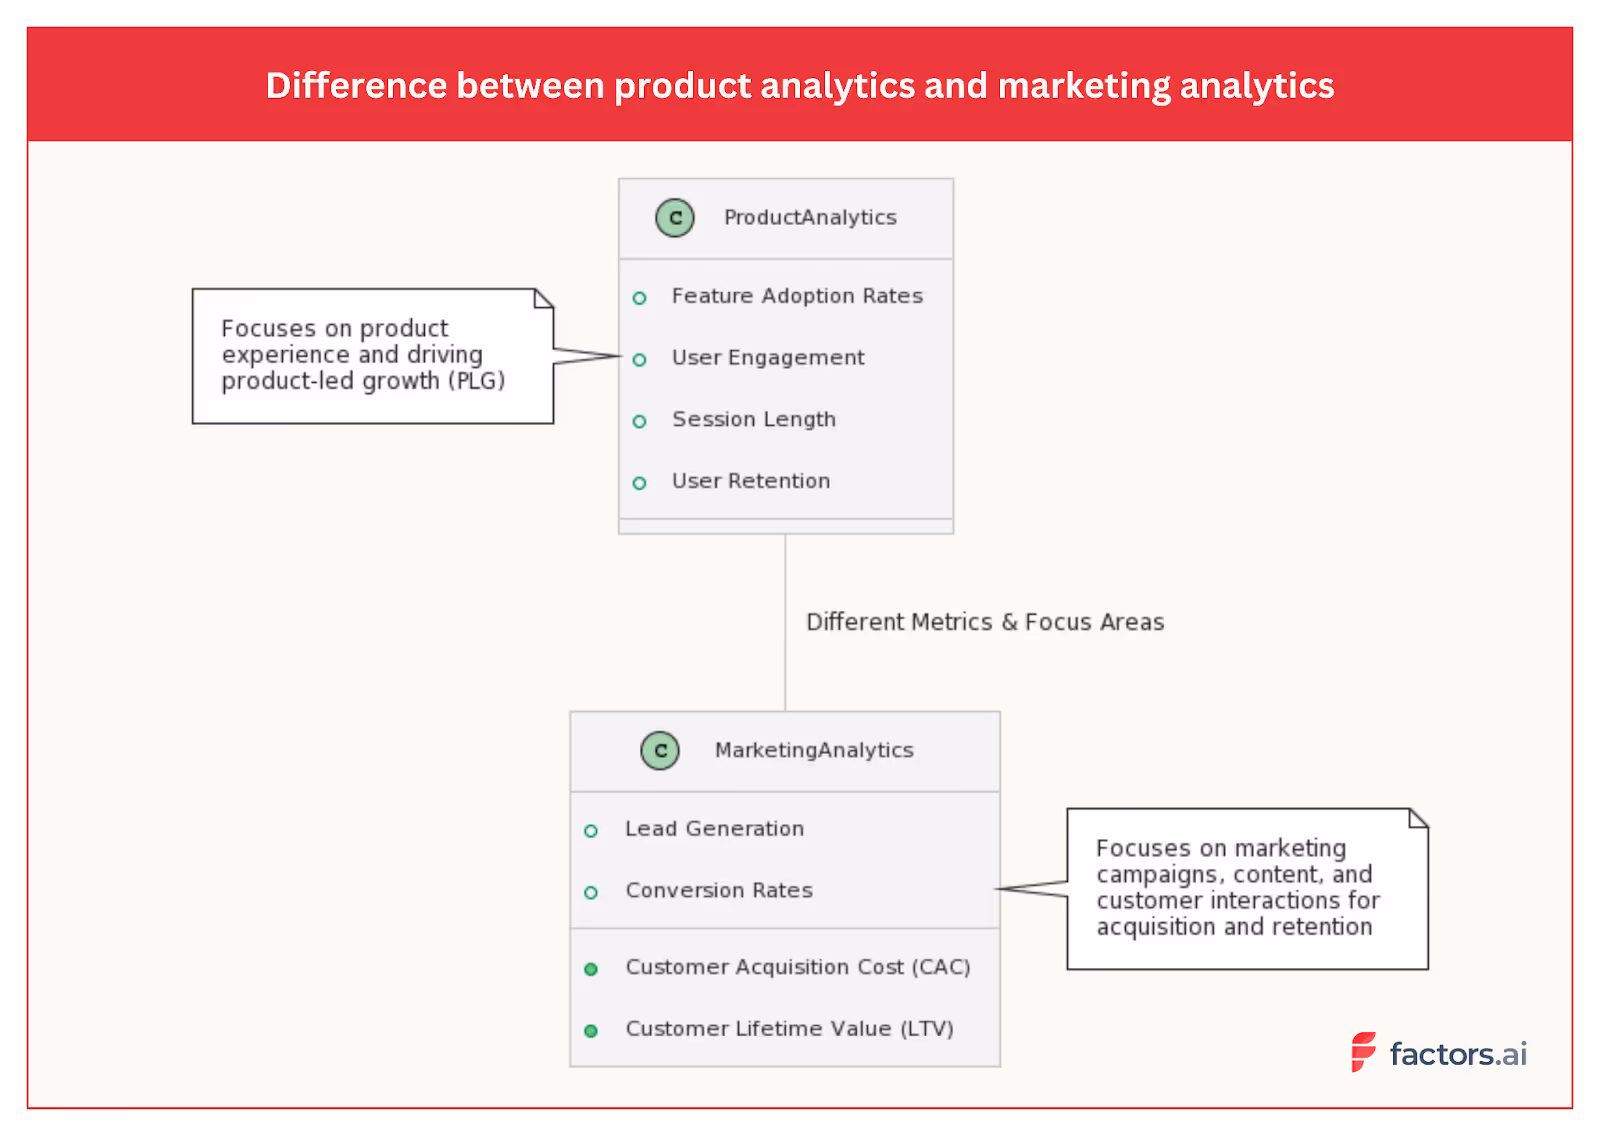
Product analytics analyzes the product experience. This type of analytics is generally performed on the data of users already using the product. It focuses on understanding how users interact with a product, including feature adoption, engagement, and product usage. With product analytics, the goal is to drive product-led growth by identifying areas for improvement, prioritizing feature development, and optimizing user experience.
Marketing analytics, on the other hand, helps identify how effective your marketing campaigns are. It helps identify how easily customers can find your product or website, what channels are working best for your marketing, and how many users are converting into paid users through the journey. Metrics for marketing analytics include lead generation, conversion rates, customer acquisition cost (CAC), and customer lifetime value (LTV).
For B2B businesses, both product and marketing analytics are important for driving growth. Product analytics helps businesses optimize product offerings and user experience. Marketing analytics helps companies improve their marketing strategies, target their audience more effectively, and allocate resources better.
Are Marketing Analytics and Marketing Attribution the Same Thing?
Marketing analytics and marketing attribution are complementary, yet distinct, disciplines within the realm of digital marketing. While both are essential for evaluating and optimizing marketing efforts, they serve different purposes and bring unique insights to the table. In this article, we will delve into the nuances of each concept, highlighting their primary focus, use cases, metrics, tools, and more.
Marketing Analytics vs Marketing Attribution - Quick Comparison
Marketing Analytics
Marketing analytics encompasses the measurement, management, and analysis of marketing performance data to optimize marketing effectiveness and maximize return on investment (ROI). Its primary focus is to provide a comprehensive understanding of marketing efforts, from the impact of individual campaigns to the overall health of a marketing strategy.
Use Cases:
- Identifying high-performing marketing channels
- Calculating customer acquisition cost (CAC) and customer lifetime value (LTV)
- Evaluating marketing ROI
- Tracking customer engagement and retention
- Analyzing data to inform marketing strategy and decision-making
Metrics:
Here are some of the marketing analytics metrics that you must keep a watch on.
- Customer acquisition cost (CAC): This metric helps you identify the cost of acquiring a new customer. It accounts for all the marketing and promotional costs involved in reaching and converting the customer.
- Lifetime value (LTV): Once a customer is converted, how long do they remain a paying customer? To find this value, note the length of time that each customer has stayed with your business and the total revenue generated by each. Then, multiply the average revenue per customer by the average length of time (lifespan). For example, if you have 100 customers paying, on average, $300 per month for 6 months, your customer lifetime value will be $300 x 6 = $1800.
- Churn Rate: How many of your customers are dropping off after they turn into paying customers? In fact, you can even count the churn rate for your free users as this can help you start digging deeper into the reasons why they don’t sign up for one of your paid plans.
- Retention Rate: This is the opposite of the churn rate. Here we check how many customers stick around for a specific period of time and more. For example, you may want to consider a customer as a retained one if they continue to pay for your SaaS for longer than 3 consecutive months.
- Return on investment: This metric is a must for businesses, no matter the industry. In the case of B2B SaaS businesses, this metric lets you understand how much money you are making based on the marketing spend.
Tools:
- Google Analytics: This is the most popular tool for marketing analytics—majorly because it’s free of cost. Google Analytics provides a wealth of information about traffic, user behavior, and much more.
- Factors: Factors is a powerful marketing analytics platform that specializes in B2B visitor identification, account analytics, and more. It integrates with your existing marketing stack and helps businesses reveal anonymous website visitors, decode customer journeys, and drive marketing ROI.
- Adobe Analytics: Adobe Analytics has a range of tools for tracking customer behavior, segmenting users, and identifying trends to improve overall marketing performance.
- Mixpanel: Mixpanel is more focused on product analytics. It enables businesses to monitor user interactions within web and mobile applications.
- Tableau: Tableau helps marketers transform raw marketing data into interactive visualizations that are easy to understand and share.
- HubSpot: HubSpot provides businesses with a holistic view of their performance and the tools necessary to optimize their strategies. From tracking website traffic and user behavior to measuring the effectiveness of email campaigns and social media outreach, it enables companies to make smarter marketing decisions and achieve better results.
Marketing Attribution
Marketing Attribution is the process of determining the value and impact of various touchpoints along the customer journey, helping marketers understand which channels, campaigns, and tactics are most effective in driving conversions and other desired outcomes. Attribution primarily focuses on assigning credit to specific marketing efforts that contribute to a conversion, sale, or other predefined goals.
Use Cases:
- Evaluating the effectiveness of individual marketing channels and campaigns
- Identifying the most influential touchpoints in the customer journey
- Optimizing marketing spend and resource allocation
- Informing marketing strategy and tactics based on attribution insights
- Tailoring messaging and targeting to maximize conversion potential
Attribution Models:
There are several attribution models available that help businesses assess the impact of their marketing efforts. Here is a breakdown of some of the most common types:
- Single-Touch Attribution: Assigns credit to a single touchpoint, either the first touch or the last touch. Common single-touch models include First-Touch Attribution, Last-Touch Attribution, and Last Non-Direct Touch Attribution.
- Multi-Touch Attribution: Distributes credit across multiple touchpoints throughout the customer journey. Examples of multi-touch models are Linear Attribution, U-Shaped Attribution, and Time Decay Attribution.
- Position-Based Attribution: This attribution model allocates credits based on the position of a touchpoint in the customer journey. For instance, it gives 40% of the credit to both the first and last ad interactions and corresponding keywords. The remaining 20% is spread across the other ad interactions on the user journey.
- Custom Attribution: Utilizes data and machine learning algorithms to create custom attribution models tailored to the unique needs of a specific business or industry. This approach allows for a more accurate representation of the customer journey and the impact of various marketing channels and tactics.
Tools:
- Factors: Factors is an AI-driven marketing attribution platform that provides detailed insights into the impact of each touchpoint on your customer journey. With its advanced modeling capabilities, Factors helps businesses make informed decisions on marketing spend and resource allocation.
- Adobe Marketo Measure: A part of the Adobe Marketo suite, Measure offers powerful marketing attribution and revenue planning features. By connecting marketing and sales data, Measure enables businesses to accurately attribute revenue to specific marketing efforts.
- Dreamdata: Dreamdata is a B2B revenue attribution platform that allows you to track and analyze the performance of your marketing efforts across all channels. By unifying data from various sources, Dreamdata provides a holistic view of your customer journey and helps optimize your marketing strategy.
- Ruler Analytics: Ruler Analytics is a marketing attribution platform that connects closed revenue data with the customer journey. It provides insights into which marketing channels are driving conversions, allowing businesses to optimize their efforts and improve ROI.
Who Should Be Thinking About Marketing Analytics at SaaS Companies?
Marketing analytics helps businesses measure the effectiveness of their marketing campaigns, optimize strategies, and make data-backed decisions to drive growth. But who should be thinking about marketing analytics at SaaS companies? Generally, it is CMOs, marketing executives, and CROs who stay updated with this information.
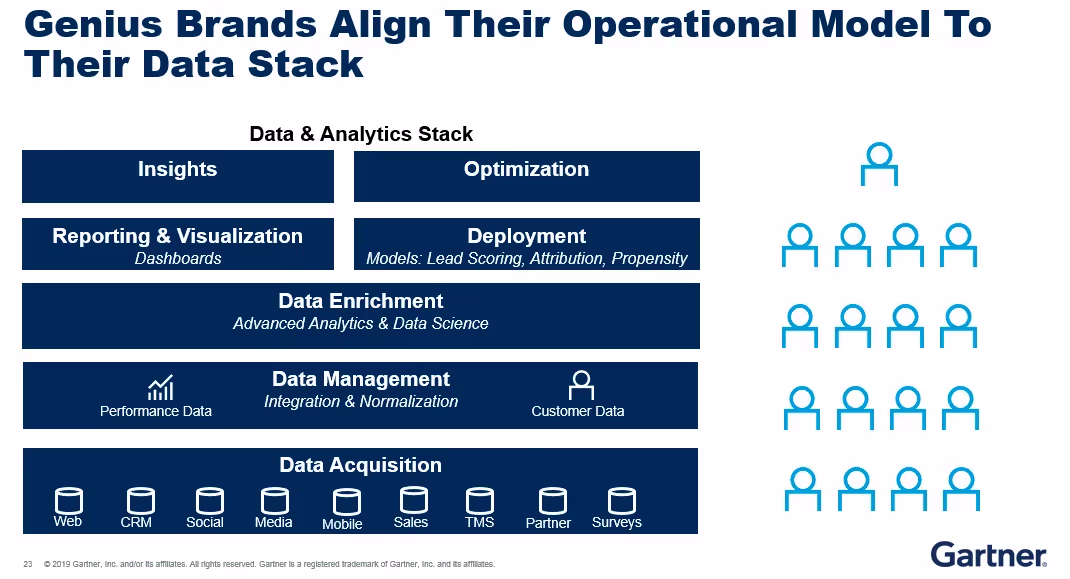
But, there's more to the story.
While it's essential for top-level executives and decision-makers to understand marketing metrics, it's not practical for everyone involved to monitor every single metric. Requiring the marketing team to constantly share their progress is counter-intuitive to progress as well. That’s where dashboards help teams stay in sync and keep tabs on what’s happening within marketing.
Dashboards offer a streamlined and efficient way to stay on top of the effectiveness of marketing strategies. They present data in a visually appealing and easy-to-understand format, allowing for quick insights and adjustments when needed. Here are a few benefits of dashboards.
- Enhanced collaboration: A well-designed dashboard helps teams across the board to stay updated with the changes in marketing. It also reduces the communication required to get data from individual teams as everyone can directly pull data from the dashboards. This increases transparency between teams.
- Increased accountability: Because of the increased transparency, teams, and individuals have accountability for the tasks assigned to them. This allows for greater productivity across teams and helps things progress faster.
- Customization: Dashboards are designed to be completely customizable. You do not need to showcase the same verbose data to everyone involved. Dashboards can help you summarize and visualize the required data based on who you want to demonstrate or showcase the data to.
If you want to implement a marketing dashboard within your company, we have an in-depth article on CMO dashboards. This will guide you through the process of designing a dashboard that serves the unique needs of your SaaS app development company.
Addressing Common Marketing Analytics Challenges
As businesses continue to evolve and adapt to the digital era, marketing analytics has become a vital aspect of marketing success. However, there are several common challenges that marketers face when trying to harness the power of data analysis.
Siloed data
The importance of seamless data integration cannot be overstated. With various marketing tools and platforms being used simultaneously, data can become fragmented and difficult to consolidate. Apart from that, customer data can get siloed at each of the touchpoints as well.
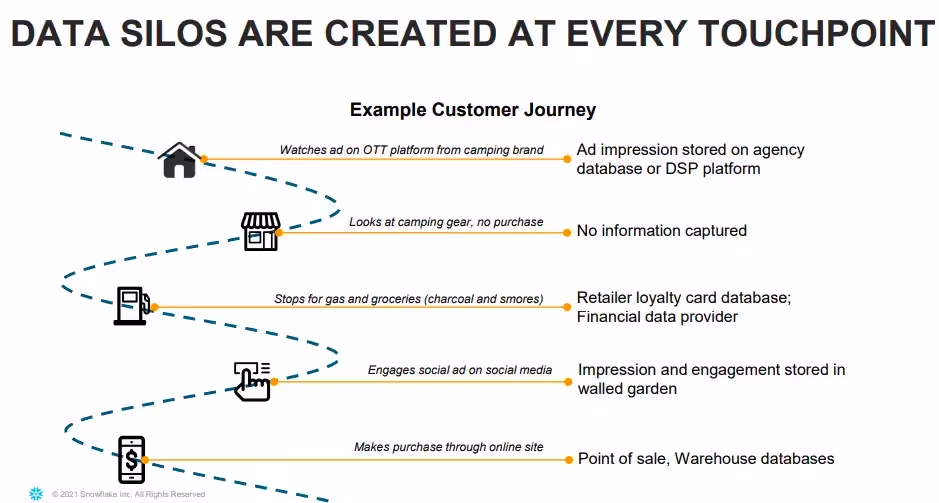
This siloed data can lead to an incomplete view of your marketing efforts and hinder your ability to make data-driven decisions. Marketing attribution tools like Factors combine data from multiple platforms and create a unified timeline that helps you view all the touchpoints of your customers in a single place.
Not knowing what to track
Identifying the right metrics to track is essential for marketing success. Focusing on the wrong metrics or not tracking them at all can lead to misguided decision-making. In fact, tracking a metric incorrectly can lead to worse outcomes than not tracking it at all.
For example, if you incorrectly attribute the success of your conversions to your paid ads, you may end up spending more on the wrong channel and wasting your marketing efforts.
Incorrect understanding of metrics
Metrics should be analyzed in tandem with other data to gain meaningful insights. For example, if the cost of acquisition in one quarter is dramatically lower than that of the previous two quarters, it could be the direct result of pausing a poor-performing marketing campaign.
But only looking at the CAC may lead to incorrect conclusions—CAC is going lower and thus your profits are going up.
Lack of automation and limited visualizations
Manual data analysis can be time-consuming, and error-prone, and ultimately limit your ability to make the most of it. Automating data collection and analysis processes is essential for maximizing efficiency and accuracy. Also, visualizing data through intuitive dashboards and reports enables easier understanding for everyone involved.
Factors address these common challenges by offering a powerful marketing analytics platform featuring seamless integrations, automation, and advanced visualization capabilities. Comprehensive marketing analytics and attribution solutions like Factors help overcome these challenges and ultimately achieve better results from your marketing efforts.
Top Marketing Analytics Use Cases for SaaS Companies
Marketing analytics can provide valuable insights and drive growth in various aspects of a SaaS company’s marketing efforts. The three key use cases for marketing analytics include acquisition and conversion tracking, campaign performance analysis, and customer segmentation and personalization. Here’s what each of them means:
1. Acquisition and Conversion Tracking
Acquisition and conversion tracking allows SaaS businesses to monitor how efficiently their marketing efforts are attracting and converting customers. For example, a SaaS company offering project management software might use acquisition and conversion tracking to analyze the sources of their website traffic. This could include social media platforms, search engines, and email marketing campaigns. They can then determine which channels are most effective in driving new users to sign up for their software. If the analysis reveals that content and SEO are generating a high number of sign-ups, the company can allocate more resources to that platform to capitalize on its success.
2. Campaign Performance Analysis
Campaign performance analysis evaluates the effectiveness of marketing campaigns and helps improve the campaigns through data. This involves monitoring click-through rates, conversion rates, and cost per acquisition, to determine the overall success of each campaign.
Imagine a SaaS company specializing in human resources software launches a Google Ads campaign targeting HR managers.
Campaign performance analysis can be used here to evaluate the effectiveness of the ads. If the data indicates that one type of ad is outperforming the others, the company can optimize the campaign by allocating a higher budget to the more successful ad. This constant analysis and improvement can lead to more efficient marketing campaigns and higher ROI.
3. Customer Segmentation and Personalization
Customer segmentation and personalization involve grouping customers based on shared characteristics and tailoring marketing messages and offers to meet their specific needs.
For instance, a SaaS company that provides email marketing software could segment its customers into groups based on their industry, company size, or the frequency of their email campaigns.
They could then create content and offers targeted at each segment. A small e-commerce business might receive tips on how to maximize its email open rates during the holiday season. A large enterprise client, on the other hand, might receive a case study showcasing how their email marketing success has successfully scaled email campaigns for similar organizations.
Grow your business with streamlined marketing analytics
Marketing analytics is a powerful tool for driving growth and improving marketing performance in B2B companies. Focusing on key use cases, such as acquisition and conversion tracking, campaign performance analysis, and customer segmentation and personalization, will enable you to make data-driven decisions and optimize your marketing efforts.
As a result, you'll attract more customers, improve customer satisfaction, and ultimately, increase your company's revenue. Don't miss out on the potential that marketing analytics can unlock for your SaaS company—start harnessing the power of data with Factors.ai today.
FAQs
Why is marketing analytics important?
Marketing analytics makes marketing effective. It offers deep insights into the preferences and behavior of your customers. It allows you to shape the marketing campaigns in accordance with your customer’s expectations and helps you make data-backed decisions rather than relying on intuition and experience.
What are the three types of analytics that can be used in marketing?
Descriptive analytics, predictive analytics, and prescriptive analytics.
- Descriptive analytics analyzes historical data to understand past performance.
- Predictive analytics uses data and statistical algorithms to forecast future outcomes
- Prescriptive analytics provides recommendations on how to optimize marketing efforts based on data-driven insights.

Identify & Target High-Intent Accounts With Webhooks & Pipedrive
Target the right accounts, at the right time with intent-based outreach
B2B sales teams spend a lot of time and effort reaching out to cold prospects only to achieve disappointing results. In fact, even successful benchmarks tag the average cold-call response rate at just 2%.
And honestly, It’s not difficult to see why.
While it’s simple enough to find lists of companies and contacts that fit your ideal client profile, it’s a monumental challenge to convince prospects to consider your solution when they’re not in the market for one.
So what’s the alternative to reaching out to the right accounts at the wrong time?
Reaching out to the right accounts at the right time of course! Or more specifically, it’s intent-based outreach based on the goldmine of anonymous, sales-ready companies already visiting your website.
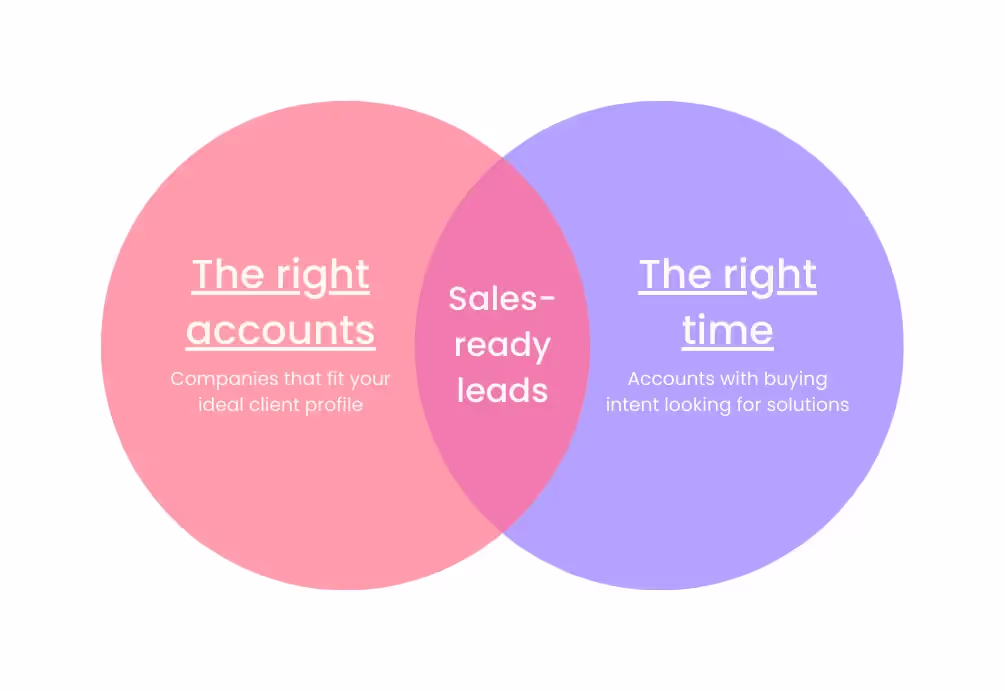
The following guide explores how to identify and target sales-ready accounts with the combined powers of Factors’ account identification and Pipedrive webhooks. We first discuss how this integration works, before delving into a handful of use-cases.
How It Works: Pushing data back into Pipedrive
Factors taps into industry-leading IP-lookup technology to identify up to 64% of anonymous website traffic at an account-level — without the need for form submissions. This includes company names as well as firmographics such as geography, industry, employee headcount, revenue range and more.
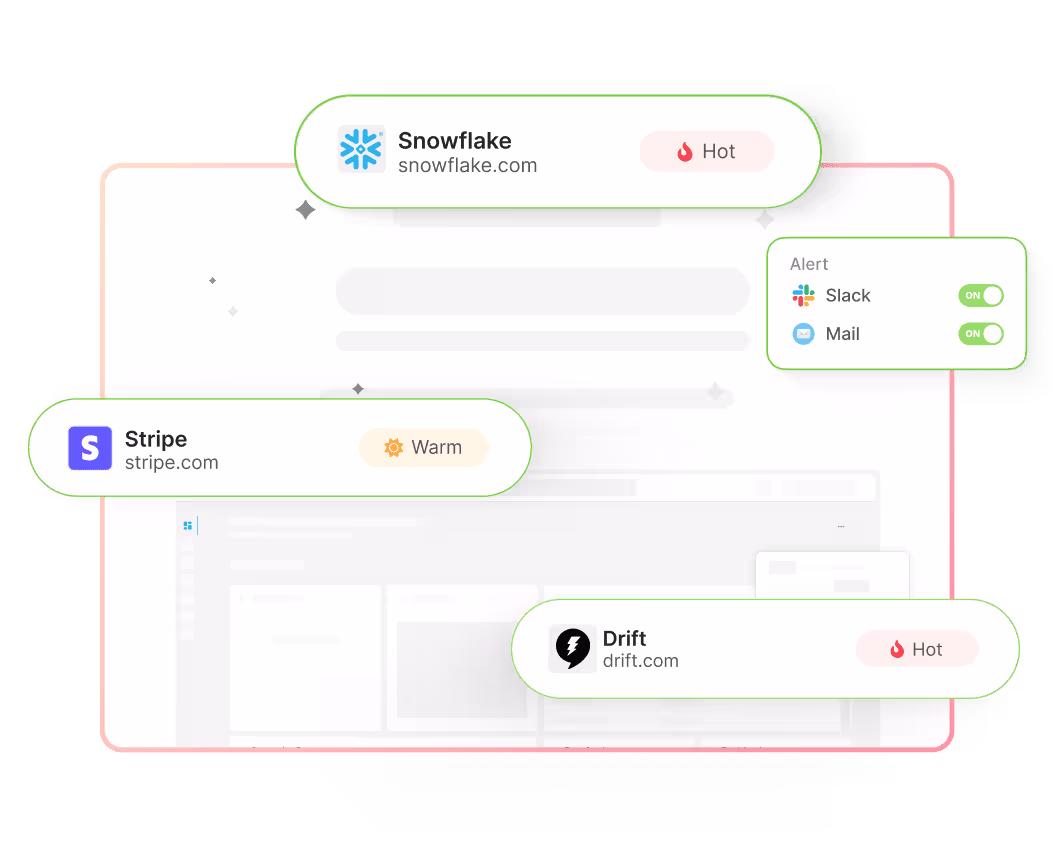
In addition, Factors auto-tracks account-level website activity, engagement, and intent with advanced analytics. This includes page views, button clicks, scroll-depth, account timelines, funnels and more.
With this information, users can filter the total set of anonymous website visitors down to ICP accounts that have expressed buying intent:
- ICP criteria: Filter down traffic based on firmographics such as industry, headcount and revenue-range to identify accounts that fit your ideal client profile.
- Intent criteria: Filter down traffic based on intent signals such as high-intent page views such as pricing, time-spent on page, and percentage scroll-depth to identify sales-ready buyers.
In short, access a list of high-intent ICP accounts that are already visiting your website but are yet to submit a form or sign-up.
Now, with webhooks and Zapier, it’s easier than ever to automatically push all this identification data from Factors into any other tool your team uses. This includes ad platforms, marketing automation platforms, and, in this case, Pipedrive CRM.
How will this help? Rather than going after cold leads with negligible chances of conversion, sales reps can view, segment, and target sales-ready accounts inside Pipedrive. As we’ll see in the next section, this dramatically simplifies and improves targeted sales outreach.
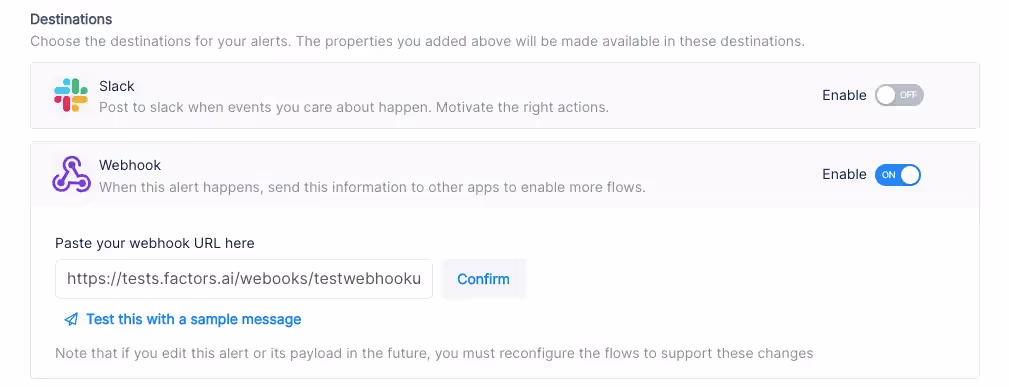
Implementing Webhooks on Factors is easy as pie. See how here.
Use-cases: Making the most of your website traffic
1. Identify new business opportunities
Factors surfaces anonymous, high-intent companies visiting your website. As previously discussed, this data can be filtered down to high-fit, high-intent accounts.
Using webhooks, this data can be pushed from Factors into Pipedrive. In other words, you can automatically create organizations inside Pipedrive for visitors that match your ICP and intent criteria.
For example, webhooks can be configured to create a new company when a visitor from a US-based software company with at least 250 employees is live on your website.
Here are a few more examples of what you can see inside your CRM with Factors:
- Accounts that visit a landing page through a search ad but fail to submit a form
- Software companies with at least 500 employees visiting high-intent pages like pricing
- US-based companies that have read through at least half a product comparison blog
Rather than relying on the 5% of website traffic that submits a form, teams can identify and target a deep new pool of potential pipeline — all within Pipedrive. What’s more? Alerts can be relayed to sales reps in real-time through Slack or MS teams so they can immediately reach out to live prospects.
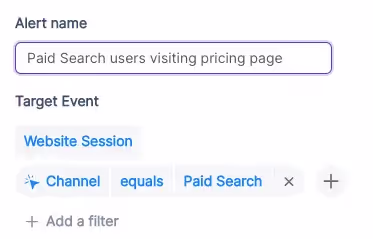
2. Stay on top of existing target accounts
In addition to recording new accounts visiting your website, Factors can be used to monitor and update data for target accounts that already exist within Pipedrive.
For example, say an account clicks on a search ad, submits a demo form, but never schedules time on your calendar. While the account's data is available in Pipedrive, it can be tedious to track and update their actions post the demo form submission.
To solve for this, Factors can automatically update CRM properties based on trigger criterias when account return to your website. Let’s say that the same account is back reading a product alternatives blog or visiting the pricing page after a couple of weeks. This event can be updated within Pipedrive, including their last active time.
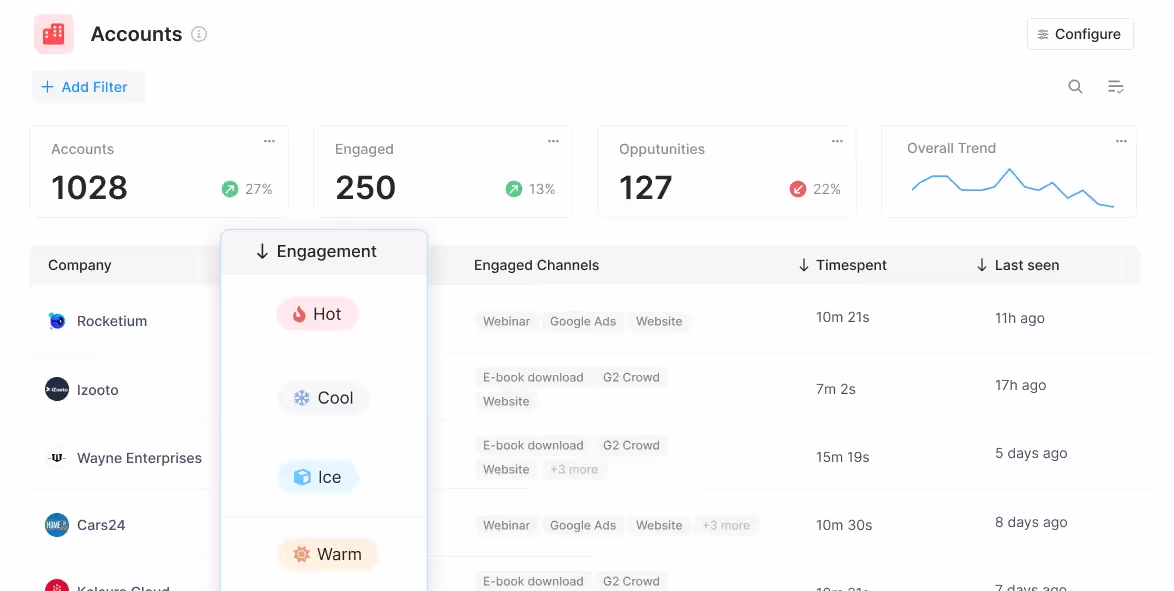
Sales reps can be notified with real-time when high-intent events take place so as to be able to immediately reach out to accounts and improve the odds of conversion.
3. Accelerate deals with behavioral data
Certain marketing material may or may not be relevant depending on the audience in question. For example, an enterprise-level account may be especially interested in security compliance related content. An early-stage start-up, on the other hand, may find content around cost-effective pricing more appealing.
Factors can track how various types of companies are interacting with your website to understand what target accounts care about most. This data can be pushed back into Pipedrive so sales reps can easily assess a prospect’s interactions, priorities and pain-points before jumping into a sales call.
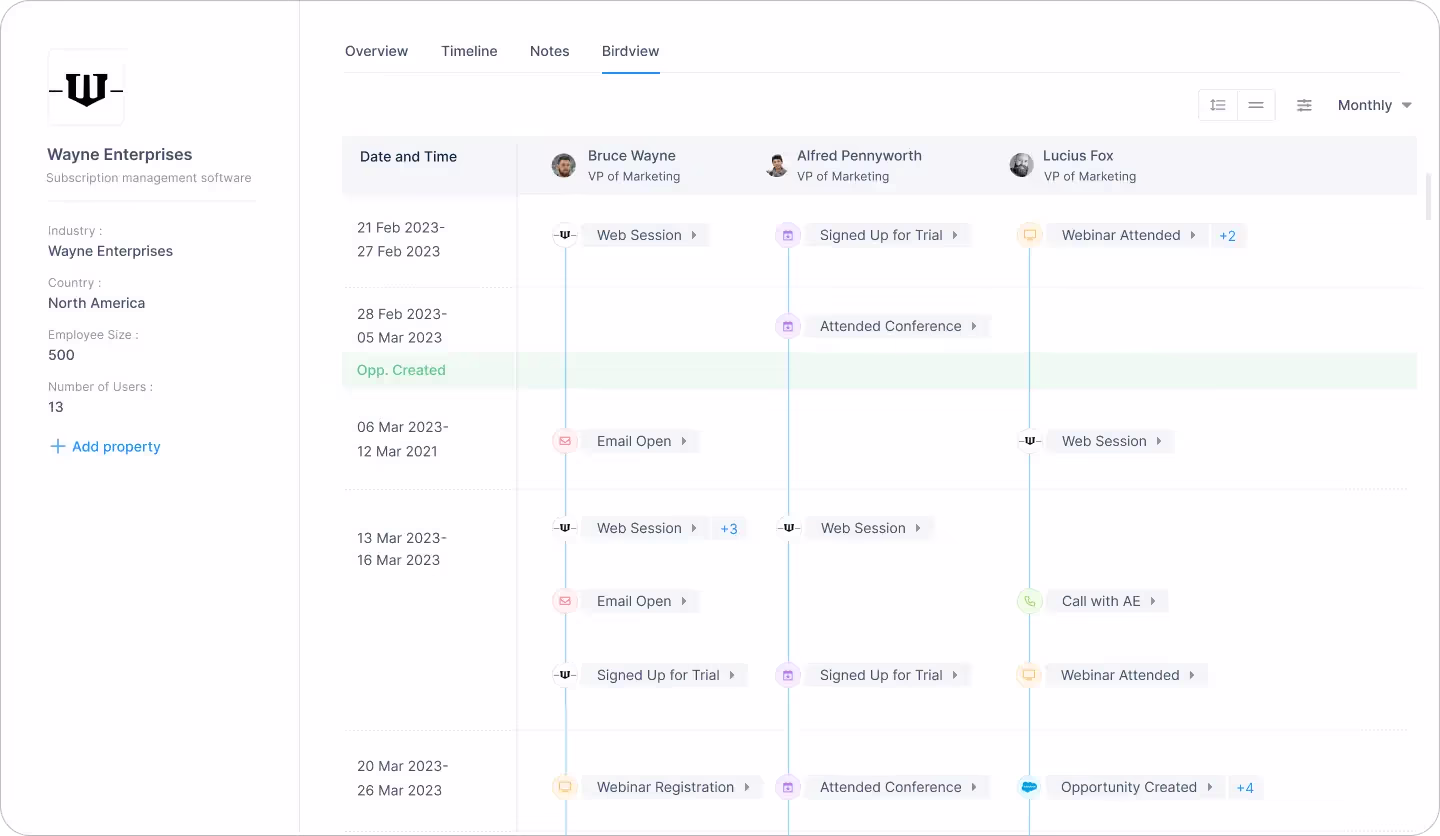
For one, sales reps can accelerate deals by personalizing the customer experience. For another, marketing teams can gauge what resonates best with the target audience and finetune content efforts accordingly.
4. Rekindle lost opportunities
Use Factors to track how prospects who have dropped off the funnel or former customers are returning to engage with your website. For instance, maybe a client who churned a couple of quarters ago is back interacting with a page that highlights a new feature release.
This may be an intent-signal that the account is reconsidering your product. It might be a good idea for sales reps to reach out and share some relevant information on what’s new. Of course, this doesn’t necessarily guarantee a conversion. But it’s far more effective than reaching out to an ice cold prospect.
This guide has covered a handful of ways in which pushing visitor data back into Pipedrive can be helpful. Ultimately, the goal is to align account data with relevant stakeholders and technologies in order to:
- Drive intent-based sales outreach
- Refine ABM efforts and spends
- Optimize retargeting campaigns
There are countless other use-cases with account identification working in conjunction with CRMs, MAPs, and more. With webhooks, Factors can push valuable website account data to nearly any platform on the planet. How you make the most of that data is really up to you — the possibilities are endless.

