Factors Blog
Insights Across All Things B2B Account Intelligence & Analytics

Why It's Worth Prioritizing Product Marketing
The modern business landscape requires modern solutions for several reasons. The market nurtures fierce competition while the expectations of customers are always evolving. In such a landscape, a business should ask itself how seriously it should approach product marketing. The answer to that is very simple - prioritizing product marketing is a must and non-negotiable. Stick around and explore why you should put an emphasis on your marketing efforts.

Benefits of Prioritizing Product Marketing
Product marketing encompasses the end-to-end journey of bringing a product to market and ensuring its growth. It involves using customer data and feedback from various sources. In the competitive business world, prioritizing product marketing offers a strategic advantage that shouldn't be overlooked. Here are the most prominent benefits of making product marketing a priority:
- It boosts product visibility so that the offering has a higher chance of being seen by the right people.
- It crafts clear and compelling messages that resonate with your audience, which makes the product irresistible.
- It gives your business a competitive edge by thoroughly understanding the competition and setting your product apart in a crowded market.
Nurturing the Customer Journey
When it comes to nurturing the customer journey, keep in mind that this process consists of two parts. First, you should view it as a guide that has the purpose of educating potential customers about the value and benefits of your product. It helps them make informed decisions and steers them from initial awareness to becoming a satisfied buyer.
You should also remember that product marketing doesn't stop at the point of purchase. It also plays a role in maximizing user adoption and satisfaction, making sure that customers not only choose your product but also get genuine satisfaction from its use. Such a focus on customer satisfaction is very important in cultivating loyalty and advocacy, which in turn contributes to business growth.

The Role of Product Marketing in Product Development
Effective product marketing bridges the gap between product development and the customer. It ensures that the development team understands customer needs and that customers get products tailored to their requirements. This is done by gathering market insights, which then influence product development decisions and steer them in a direction that aligns with market demand and innovation.
Measuring Success and Overcoming Challenges
Another important thing about product marketing that will ensure you are on the right path is to gather the necessary metrics. This type of measurement can help you overcome any upcoming obstacles and adapt your current strategy to get better results.
Demand metrics provide invaluable insights into what's working and what needs adjustment. In the broader perspective, the triumph of a marketing campaign essentially depends on your ability to measure and evaluate your efforts tangibly.
Key Performance Indicators (KPIs)
Key Performance Indicators, or KPIs, are like the compass for your marketing game. They're super important because they tell you how well your strategies are doing and guide your progress. We're talking about conversion rates, how much it costs to snag a new customer, how happy your customers are, and the return on investment (ROI).
What can help you get a better grasp on KPIs is a tool called a marketing dashboard. There are several marketing dashboard examples that can visualize a summary of your strategy, including Google Ads dashboard, LinkedIn Ads performance marketing dashboard, and more.

Common Hurdles
The journey of product marketing has its challenges. Common hurdles often include fierce market competition, shifting consumer preferences, and the rapid evolution of marketing technologies. To overcome these obstacles and ensure success, leveraging skills assessment tools using surveys and the right blend of adaptability, creativity, and strategic skills becomes crucial. This approach allows for a comprehensive understanding of team strengths and areas for development, enabling more informed and effective strategies in the dynamic landscape of product marketing.
The Future of Product Marketing
Marketing has evolved through the decades. From the simplest ways of reaching out to consumers through cold calls to modern-day digital marketing efforts, the future of product marketing holds the promise of transformation and innovation.
Emerging Trends and Technologies
Product marketing is about to go through a significant change thanks to new trends and remarkable technologies. We're talking about using AI and machine learning to understand what customers want, making excellent marketing experiences with virtual and augmented reality, using data analytics for super personalized marketing, and adopting unified marketing measurement strategies. It's like we're on the verge of a new product marketing era. To stay on the right path to success in the future will mean staying ahead of all these trends.
Preparing for the Future
Businesses should proactively prepare for the future of product marketing to be able to thrive in this dynamic environment. This involves several things, like staying on top of emerging trends, fostering innovation, and strategically building brand awareness. It's all about future-proofing your strategies and ensuring that your product marketing approaches remain relevant in an ever-evolving marketplace. Moreover, cultivating strong customer relationships and adapting swiftly to changing consumer preferences are pivotal aspects of navigating the evolving landscape of product marketing.

Focus on Product Marketing for Ultimate Success
From bringing a product into the market to its growth and adaptation, the importance of prioritizing product marketing is very clear. With benefits that include stronger visibility, compelling messaging, and competitive advantage, businesses are given the tools to help them thrive in a competitive marketplace. Nurturing your potential leads by educating and guiding them and maximizing user adoption and satisfaction solidifies the bond between the brand and its customers.
As we look to the future, the evolving trends and technologies promise to reshape the product marketing landscape. To navigate this dynamic future means staying prepared, embracing change, and fostering innovation. In the grand scheme of things, product marketing isn't simply a choice you may or may not take. It's a vital investment in ensuring your product doesn't just exist but thrives and flourishes. Investing in marketing means prioritizing your growth and solidifying your place as a key player in the ever-evolving world of business.

Understanding Google’s New Guidelines for Bulk Email Senders
Are you tired of unsolicited, spammy emails in your inbox? Well, all that will (to an extent) end in February 2024 as Google implements new guidelines for bulk email senders to make your inbox safer and spam-free.
Google will require bulk email senders (people who send over 5,000 emails per day to Gmail inboxes) to follow certain best practices requiring strong authentication, easy unsubscription, and lower spam rates.
“It’s clear that email has become an essential part of daily communication. And whether you’re submitting a job application or staying in touch with a loved one, your emails should be safe and secure.” – Neil Kumaran Group Product Manager, Gmail Security & Trust
Let’s dive into understanding these best practices and what these new policies mean for your cold outreach strategy in 2024.
Summary of Bulk Email Sender Guidelines
Here is a quick gist of Google’s email sender guidelines and the best practices they recommend for bulk email senders:
1. Requirements for Authentication
Ensure email authentication for each of your sending domains at your domain provider by settling up the following:
- SPF (Sender Policy Framework): This basic authentication method verifies if an email was sent from an authorized server. Bulk senders need to configure their domain to use SPF.
- DKIM (Domain Keys Identified Mail): This adds a digital signature to each email, allowing Gmail to verify the email's authenticity and integrity.
- DMARC (Domain-based Message Authentication, Reporting & Conformance): This builds on SPF and DKIM by providing reporting and enforcement mechanisms. Bulk senders must publish a DMARC policy that states what Gmail should do with emails that fail authentication.
- ARC(Authenticated Received Chain): it shows the previous authentication status of forwarded messages and previously failed authentication. Senders must use ARC authentication if they forward emails regularly.
Google recommends always using the same domain for email authentication and hosting your public website. Senders must have valid forward and reverse DNS records for these sending domains and IP addresses.

2. Requirements for Easy Unsubscription
If you send over 5,000 marketing and sales emails daily, your marketing and subscribed messages must support one-click unsubscribe.
- Unsubscribe links: Every email must contain a clear and readily available unsubscribe link. This link should be placed in a prominent location, such as the footer of the email.
- Preference centers: Bulk senders can offer preference centers where users can manage their subscription preferences and easily unsubscribe from specific email lists.
- Confirmation process: Unsubscribe requests should be confirmed promptly, and users should not receive further emails after opting out.

Google suggests that you only send emails to people who want to get your messages, so they’re less likely to report messages from your domain as spam.
3. Spam Rate Monitoring
You can track your spam rate using Postmaster tools. Ensure it stays below 0.10%, and avoid reaching a spam rate of 0.30% or higher.
Here are a few tips to avoid having your emails land in your receiver’s spam:
- Don't mix different types of content in the same message.
- Don't impersonate other domains or senders without permission.
- Don't purchase email addresses from other companies.
- Some countries and regions restrict automatic opt-in. Before you opt-in users automatically, check the laws in your region.

Bulk senders who fail to comply with the guidelines may face various consequences, including reduced deliverability rates, warnings, suspension of email-sending privileges, or even legal action.
How Does This Affect Your Cold Email Strategy?
Even if your sales/marketing team has these parameters in place, Google's refreshed bulk email sender guidelines signal that mass mailing prospects may slowly be on the decline. While this may sound like not-so-good news for your outbound marketing efforts, here's why this may actually be a blessing in disguise.
Email marketing, if implemented correctly, can continue to be one of the best B2B sales channels in your GTM strategy. The key, however, will be to adopt a systematic, intent-based approach as opposed to spray-and-pray tactics.
Let’s say you’re selling software that streamlines candidate assessment, and your buyer personas are hiring managers and CHROs.
If your sales team sends out emails to thousands of CHROs at random — without any insight into whether or not they’re in-market for your product, you’re bound to receive replies, if any, such as: “Sorry, we’re not currently looking to buy” or worse still, “unsubscribe 😠.”
Not only does this high-volume approach result in little result from lots of effort, but cold outreach may also leave a bad taste in the mouth of prospects who may be looking to buy down the road.
What’s the alternative to this? Intent-based, account-level outreach, of course! 😎
On average, only 4% of website visitors convert via sign-ups, but what if you could identify, qualify, and target the remaining 96% of anonymous website traffic with outreach based on intent? What if you could carefully research engagement amongst high-intent buyers and send them personalized cold emails highlighting exactly how your tool can meet their requirements?
Our experience working with hundreds of B2B teams finds that this results in far more conversions with far fewer emails.

Factors is an IP-based account intelligence and activation platform that:
- Identifies anonymous accounts visiting your website, viewing your LinkedIn, or interacting with your G2 pages
- Qualifies high-intent ICP accounts based on firmographics and cross-channel engagement
- Enriches sales-ready accounts with Apollo-fuelled contact data before activating outreach by integrating with your marketing automation platform.
Here’s a little about how it works:
First, our account intelligence feature allows you to uncover anonymous traffic with IP-based intelligence & enrichment.

Next, you can qualify ICP buyers based on their firmographics and score accounts based on their engagement across the website, G2, and LinkedIn intent signals.
Finally, create a list of accounts ready to buy and send emails with a compelling pitch to win sales-ready accounts over in no time. Want to learn the basics of account scoring?
▶️Check out our guide: An Introduction To B2B Account Scoring

Wrapping Up
Google has taken a much-needed step to establish these bulk email sender guidelines. Whether you’re executing cold outreach or email marketing campaigns, you must monitor your bulk emails and ensure basic email hygiene to create a secure email ecosystem.
If you want to ditch the cookie-cutter bulk email strategy and want to restructure your cold outreach efforts by focusing on high-intent buyers, book a demo with us today!

The Complete Guide to Channel Marketing
Channel marketing refers to the practice of leveraging various distribution channels to promote and sell products or services. These channels can include a spectrum of intermediaries, such as retailers, distributors, influencers, and even strategic partners, who play instrumental roles in bringing a product to the end consumer.
It's a strategic alliance between a company and its intermediaries to enhance reach, drive sales, and maximize overall market impact.
Take an Example: Apple's Channel Marketing Symphony
Take Apple., for instance, the tech giant employs a multifaceted channel marketing strategy, involving authorized resellers, the Apple Store, and online platforms. This approach ensures that Apple products are available through diverse channels, reaching customers at their preferred touchpoints. The result is a global melody of iPhones, MacBooks, and other Apple products, resonating across a myriad of channels.
How does Channel Marketing differ from Marketing Channels and Customer Bases?
What are the benefits of Channel Marketing?
1. Extended Market Reach
By leveraging various intermediaries such as distributors, retailers, and partners, channel marketing enables businesses to tap into markets that might be challenging to reach directly.
- Impact
This broadens the geographical and demographic scope, exposing products or services to a wider audience.
2. Efficient Distribution
Channel partners streamline the distribution process, ensuring products or services reach end customers swiftly and efficiently.
- Impact
This efficiency minimizes delays reduces logistics challenges and enhances overall customer satisfaction.
3. Cost-Effective Operations
Collaborating with channel partners often reduces the need for a direct sales force, resulting in cost savings for businesses.
- Impact
Companies can allocate resources more strategically and invest in other areas critical to business growth.
4. Expertise Utilization
Channel partners bring domain expertise and knowledge of local markets, which can be advantageous for businesses entering new territories.
- Impact
This enables businesses to leverage the specialized skills and understanding of their partners for more effective marketing and sales strategies.
5. Diverse Marketing Strategies
Different channel partners may employ varied marketing methods, allowing businesses to benefit from a diverse range of promotional approaches.
- Impact
This diversity helps in reaching different customer segments, ensuring a well-rounded and comprehensive marketing strategy.
6. Enhanced Customer Trust
Partnering with established distributors or retailers can enhance the credibility and trustworthiness of a brand in the eyes of consumers.
- Impact
Customers are more likely to trust products or services when they are available through reputable channels, contributing to increased sales.
7. Flexibility and Adaptability
Channel marketing allows for flexible adjustments to the distribution strategy based on market changes and trends.
- Impact
Businesses can adapt quickly to market shifts, staying ahead of competitors and responding effectively to customer demands.
8. Reduced Financial Risk
Sharing responsibilities with channel partners can mitigate financial risks associated with market uncertainties or economic fluctuations.
- Impact
This risk-sharing model provides a safety net, ensuring that businesses can navigate challenges more resiliently.
Types of Channel Marketing
Within channel marketing, two prominent approaches that businesses often employ are direct channel marketing and indirect channel marketing.
Direct channel marketing involves the direct sale of products or services from the producer to the end consumer without intermediaries. This approach allows businesses to have complete control over their brand messaging, pricing, and customer relationships.
Indirect channel marketing involves the use of intermediaries or third-party entities to distribute products or services to the end consumer. These intermediaries may include wholesalers, retailers, distributors, and agents. Let’s go over indirect channel marketing in more detail
- Resellers
Resellers are intermediary entities that purchase products from manufacturers and then resell them to end customers. They act as a bridge between the producer and the consumer, often adding value through services like customer support, distribution, and after-sales assistance.
For example, Dell employs resellers to distribute its computer hardware and services.
- Affiliates
Affiliates are external partners who promote a company's products or services and earn a commission for each sale or lead generated through their marketing efforts. They leverage their platforms, such as websites or social media channels, to drive traffic and conversions.
For example, Rakuten Marketing operates an affiliate marketing network, enabling businesses to partner with publishers for promotional activities.
- Consultants
Consultants in channel marketing are experts or agencies that provide strategic guidance and services to businesses seeking to optimize their channel strategies. They offer insights, conduct market research, and assist in the execution of effective channel programs.
For example, ChannelSight provides consultancy and technology solutions to enhance brands' digital commerce strategies.
Each type of channel partner brings unique advantages, and the strategic selection of partners aligns with the overall channel strategy of a business. In the next section, we will delve into the challenges associated with managing diverse channel partners and provide insights into effective channel partner management.

Channel Marketing Strategies
1. Choosing Channel Marketing Partners
- Alignment with Target Audience
Select partners whose audience aligns with your target market. This ensures that your message reaches potential customers who are genuinely interested in your product or service.
- Complementary Offerings
Look for partners whose products or services complement rather than compete with yours. This synergy can lead to mutually beneficial collaborations and cross-promotions.
- Channel Relevance
Evaluate the channels your potential partners use to reach their audience. Ensure that these channels align with your marketing goals and provide an effective means of communication.
- Reputation and Credibility
Partner with reputable and credible businesses. Associating your brand with trusted names in the industry enhances your credibility and builds trust among consumers.
2. Criteria for Selecting the Right Partners
- Shared Values and Objectives
Identify partners who share similar values and business objectives. This fosters a more cohesive collaboration and ensures a unified message to the shared audience.
- Performance Metrics
Establish clear performance metrics and expectations. Define key performance indicators (KPIs) that align with your marketing goals, ensuring accountability and success measurement.
- Communication and Responsiveness
Choose partners who exhibit effective communication and responsiveness. Timely collaboration is essential for successful channel marketing, and partners who are proactive in communication contribute to a smoother process.
- Flexibility and Adaptability
Opt for partners who are flexible and adaptable to changing market dynamics. A willingness to evolve strategies based on performance data and market trends is crucial for sustained success.
3. Maximizing the Potential of Channel Marketing
- Collaborative Campaigns
Create joint marketing campaigns that leverage the strengths of both partners. This could include co-branded content, shared events, or collaborative social media campaigns.
- Training and Resources
Provide training and resources to channel partners to ensure they understand your product or service thoroughly. Well-informed partners are more effective at communicating your value proposition.
- Incentives and Rewards
Implement incentive programs to motivate channel partners. This could include tiered commission structures, bonuses for reaching milestones, or exclusive rewards for top-performing partners.
- Data Analysis and Optimization
Regularly analyze data from channel marketing efforts to identify what works and what doesn't. Use this information to optimize strategies, refine targeting, and enhance overall performance.
Channel Marketing Best Practices and Tactics
- Segmentation and Targeting
Utilize data-driven insights to segment the target audience effectively. Tailor marketing messages and strategies to different segments to maximize relevance and engagement.
- Cross-Promotion Opportunities
Identify opportunities for cross-promotion with partners. This can involve featuring each other's products in marketing materials, co-hosting events, or cross-referencing customers.
Challenges and Solutions in Channel Marketing
Here are some common roadblocks faced by businesses.
1. Competitive Conflicts
Channel partners may carry products or services that directly compete with each other. This creates a challenge in maintaining a cohesive marketing strategy, as conflicting interests may arise.
Addressing Competitive Conflicts
- Clear Partner Segmentation
Segment partners based on their offerings and ensure that competitive products or services are not placed in direct competition within the same segment. This minimizes conflicts and allows partners to focus on their unique strengths.
- Exclusive Territories
Define exclusive territories for certain products or services to avoid direct competition between partners. This helps in creating a balanced distribution and ensures each partner has a defined market area.
2. Communication and Coordination Issues
Inconsistent communication and coordination between the brand and channel partners can lead to misunderstandings, misalignment of strategies, and ultimately, a less effective marketing effort.
Addressing Communication and Coordination Issues
- Regular Meetings and Updates
Establish a regular schedule for meetings or updates to enhance communication. This ensures that all channel partners are informed about the latest developments, marketing strategies, and any changes in expectations.
- Centralized Communication Platforms
Implement centralized communication platforms, such as a partner portal or collaboration tools. These platforms provide a centralized hub for sharing documents, updates, and important information, fostering better coordination.
- Dedicated Channel Manager
Assign a dedicated channel manager responsible for maintaining communication with partners. This individual can serve as a point of contact, address concerns promptly, and ensure that partners are aligned with the overall marketing strategy.
3. Brand Consistency
Maintaining consistent brand messaging across diverse channel partners can be challenging. Divergent interpretations of the brand identity may dilute the overall marketing impact.
Addressing Brand Consistency Issues
- Brand Guidelines and Training
Provide comprehensive brand guidelines and training to channel partners. This ensures a shared understanding of the brand identity and messaging, promoting consistency across all marketing efforts.
- Co-branded Marketing Materials
Develop co-branded marketing materials that align with the brand guidelines. This allows partners to customize materials while maintaining a cohesive overall look and feel.
4. Channel Partner Performance Variability
Not all channel partners may perform at the same level. Variances in performance can affect overall marketing outcomes and create disparities in the value derived from different partnerships.
Addressing Performance Metrics Issues
- Performance Metrics and Incentives
Establish clear performance metrics and incentive programs to motivate channel partners. Recognize and reward high-performing partners to maintain a competitive yet collaborative environment.
- Training and Support
Provide ongoing training and support to enhance the capabilities of all channel partners. This helps level the playing field and ensures that each partner has the knowledge and tools needed for success
Solutions and Strategies for Overcoming Challenges
1. Establishing Clear Expectations and Guidelines
- Documented Agreements
Ensure that all expectations, guidelines, and agreements are documented in written contracts. This provides a reference point for both the brand and channel partners, reducing the likelihood of misunderstandings.
- Regular Review Meetings
Schedule regular review meetings to discuss performance, address concerns, and reinforce expectations. This ongoing dialogue helps maintain a strong and collaborative relationship.
2. Leveraging Technology and Automation
- Integrated Technology Platforms
Invest in integrated technology platforms that facilitate seamless communication and collaboration. This can include Customer Relationship Management (CRM) systems, marketing automation tools, and partner portals.
- Automated Reporting and AnalyticsImplement automated reporting and analytics tools to track the performance of channel partners. This data-driven approach allows for quick identification of trends, areas for improvement, and successful strategies.

Channel marketing, when executed strategically, can be a powerful engine for business growth. However, navigating the challenges that come with diverse partnerships requires thoughtful planning and proactive solutions. By addressing common obstacles and implementing effective strategies, businesses can foster strong collaborations with channel partners, ensuring a harmonious and impactful marketing effort.
Key Takeaways
Diversity Breeds Success
Embrace the diversity of channel partners, recognizing that each type brings distinct advantages to your marketing symphony.
Strategic Collaboration
Forge partnerships strategically, align the strengths of resellers, affiliates, and consultants with your business goals.
Orchestrated Management
Effective communication and alignment with partners are essential for a harmonious performance.
Constant Refinement
Remember that channel marketing is an ongoing process. Regularly evaluate, refine, and adapt your strategy to stay attuned to the ever-changing market dynamics.

Driving B2B Growth With Account-Based Everything
Sales and marketing have seen a shift over the years, with account-based selling and account-based marketing taking the world by storm. But what if we could combine both these approaches?
Enter account-based everything, a strategy that operationalizes sales and marketing efforts to target and convert high-value accounts.
This article provides a detailed overview of how to take the account-based everything route for long-term pipeline growth.
Why Shift to an Account-Based Everything Approach?
While alignment is one piece of the puzzle, the larger goal for any organization is driving revenue. Sales, marketing, and customer success must work together across the customer lifecycle to drive growth. Everyone knows about ABM, but there’s a new kid on the block: account-based everything
Account-based everything, or ABE/ABX, is a strategy that empowers sales, marketing, and customer success to collaborate and focus on high-value accounts. It personalizes engagement, aligns teams, and maximizes ROI by tailoring efforts to specific target accounts, fostering stronger customer relationships, and driving revenue growth.
Think of ABE as a refined, all-encompassing version of ABM, where your company aims for a smooth transition between all phases of the sales cycle. The core principle of ABE is that every customer touchpoint is an opportunity to convey that your product is the best fit for them.
“The approach companies take with ABM today isn’t as personalized, and the focus is not much on the buyer experience, hence the new movement for "everything .” – Dan Renyi, Founder at Klear B2B

ABE ditches the siloed approach and helps align departments, identify and sync tactics, and segment personalization efforts.
To execute ABE, you’ll need specialized assets depending on the account you target. The resources required to fuel your ABE strategy with the right content can balloon quickly, which is why it’s so important to define your ABE strategy upfront and choose your target accounts wisely.
Here's Gartner's framework for account-based everything. It's a great starting point for teams to gauge the extent of alignment and commitment required to succeed with an account-based go-to-market strategy.

Here are 5 steps you must follow to implement an account-based everything program in your organization:
1. Align target accounts across teams
When marketing and sales don’t have a common understanding of target accounts and ICP, building pipeline can get tricky Creating an ideal client profile is a foundational, company-wide decision that impacts downstream sales and marketing efforts.
You can start by identifying what a high-value account looks like and create a target account list of 100-500 such companies. You can conduct account research as per these aspects:
- Markets: Competitors, regulatory changes, regional developments
- Companies: Organizational hierarchy, financials, key initiatives and challenges
Once you have your list, you gain clarity on the accounts you need to focus on.
While it’s one thing to know who your ICP is, it’s also critical to establish who doesn’t qualify as your ICP.
Ensure you lay down proper specifications for who exactly comes under your ICP. For instance, if you’re selling a recruitment automation platform and a talent acquisition specialist reaches out to you, you’d prioritize them over someone in customer service or legal.
You can use this matrix to identify how to prioritize your inbound requests:

Marketing and sales should collaborate and agree upon the following questions:

When you answer these questions, all teams can work in sync to target the right accounts and provide a seamless buying experience.
2. Analyze Marketing’s Role in Driving Engagement
Once you have chosen which accounts to target, figure out how your marketing team will engage with each account. Should you engage with a prospect who visited your blog in the same way you would with a webinar attendee?
The level of engagement required also varies on the stage of the funnel. For instance, you can initiate a nurture sequence if someone new to your website books a demo. If they've already invested in your tool, just email them product updates to keep them engaged.
Not to mention, it also depends upon the tier of the company you’re engaging with. When a Fortune 500 company and a seed startup contact you, it's obvious to focus on the big brand because it’ll significantly impact revenue growth.

3. Focus on Engagement Quality
When marketing engages with an account, interacting with decision-makers alone doesn’t cut it. Quality engagement with end users, champions, and adjacent teams like finance, IT, etc. is equally important if you want to seal the deal.
Let’s say you’ve engaged with two or more decision-makers like the CEO and Director, your engagement quality is high, but if you’ve only been able to speak to one end user, you’d need to level up your game.
You can use engagement scoring to gauge how marketing can best engage with high-value accounts in different customer lifecycle stages.
4. Drive Awareness Across the Customer Lifecycle
Marketing creates content on various topics for every stage of the customer lifecycle, whether it’s case studies, ROI calculators, or the help docs on your website. The ultimate goal is to drive awareness with product-led content, and you can categorize your content in “topic clusters” to share it with your prospects.
While many organizations encourage prospects to schedule a demonstration, most buyers are not ready to speak to sales yet.
Instead of pushing them to talk to sales, you can create high-value plays that are likelier to incite buyer participation and engagement. Offer something of value such as a custom report or a presentation with findings relevant to that particular account or their peers.
Once they’re solution aware, you need to make them “your solution aware,”. This is where sales can share their demo call insights with the marketing team so that they can create personalized content for the account in question. Some ideas include:
- Personalized sections in landing pages based on an ICP’s company
- A chatbot that recognizes the account
- Sharing templates that streamline their workflow

5. Use Account Intelligence Tools
Leveraging an account intelligence platform (Hint: Factors.ai) can be a game changer in terms of how you engage with accounts in your pipeline and close deals. Here’s how we help marketing and sales teams implement account-based programs:
Our list-building and segmentation feature filters and segments visitors based on the type of companies or behavior you’re interested in. Plus, you also get MS Teams or Slack notifications any time an account that matches your ICP visits your site.

Sales teams can use this information to tailor email campaigns, sales calls, and other efforts to target those accounts individually and improve engagement and conversions
{{CTA_BANNER}}
You can prioritize accounts and close deals faster with our cross-channel account scoring feature that uses machine learning to qualify and target the right accounts based on website engagement, intent signals, and firmographics.
▶️Read our guide to account scoring
Factors also offers users complete visibility of the account journey across known and anonymous users so you can identify touch points that improve conversion and optimize points of friction and drop-offs.

Our platform helps you determine engagement quality thanks to the ABM analytics feature which enables custom dashboard creation that ensures reliable account-level reporting across marketing campaigns & sales activities.

Operationalise Sales and Marketing Alignment with Factors Today
Buyer expectations are at an all-time high, and it’s up to your business to refine its playbook to meet and exceed those expectations. B2B sales and marketing professionals should find a way to begin implementing ABE at their company to enable early engagement with multiple stakeholders and drive real results.
Book a demo to find out how we can help you engage and convert target accounts at scale.

Step-by-Step Guide to SaaS Content Marketing
“The global SaaS market is projected to grow from $273.55 billion in 2023 to $908.21 billion by 2030 at a CAGR of 18.7%.”
With such growth figures, comes great marketing responsibility. And what’s a better tool than SaaS Content Marketing to take your organic marketing efforts to the next level? If you’re a little iffy about creating content for your SaaS company, this blog is written for you!
Without much ado, let’s get right into clarifying the basics before we jump into the step-by-step guide for SaaS content marketing.

But, what is SaaS Content Marketing?
SaaS Content Marketing is the strategic creation and distribution of relevant, valuable, and consistent content to attract, engage, and retain a target audience within the SaaS industry.
Unlike traditional marketing approaches that emphasize direct selling, SaaS Content Marketing centers around providing information and insights, positioning the brand as a trusted advisor. It serves as the bridge between a SaaS company and its audience, fostering a relationship built on trust and authority. SaaS Content Marketing stands apart due to its focus on delivering targeted, highly informative content tailored to the needs of a tech-savvy audience. Effective content marketing positions the brand as an industry leader resonates with the pain points of the target audience, and ultimately drives customer loyalty and advocacy. It focuses on educating users, offering in-depth insights into the product's functionality, and guiding them through the complexities of the software.

Building a Value Proposition and Demonstrating the Brand's Authority
A compelling value proposition is at the core of successful SaaS Content Marketing. Content should articulate not only the features of the SaaS solution but, more importantly, the value it brings to users. Whether through whitepapers, webinars, or interactive demos, SaaS content should communicate how the product addresses specific pain points, enhances efficiency, and delivers tangible benefits. Establishing the brand's authority involves consistently offering valuable insights, staying abreast of industry trends, and showcasing thought leadership through authoritative content.
Step-by-Step Guide To Content Marketing
Since you’ve made it this far into the article, we’d like to think you’re considering SaaS content marketing. So, as promised, here’s the step-by-step guide that will enable you and your teams to create a framework and scale your content marketing efforts.
Step 1
Market Research: Laying the Foundation
The first step in building a formidable SaaS Content Marketing strategy is laying a strong foundation through thorough market research. This step includes identifying market trends, understanding customer pain points, and analyzing competitors. The goal is to unearth insights that will inform content strategies and ensure they align with the dynamic needs of the target audience.
Market research in SaaS Content Marketing should address the following key aspects:
- Audience Persona Development
Define and understand the various personas within the SaaS target audience. Recognizing their challenges, preferences, and decision-making criteria lays the foundation for tailored content.
- Competitor Analysis
Evaluate the content strategies of key competitors. Identify content gaps, assess engagement levels, and discern successful tactics. This analysis informs the creation of content that stands out in a space that may already be cluttered with content.
- Trend Identification
Stay abreast of industry trends and emerging technologies. This not only showcases the brand's commitment to staying current but also provides valuable content ideas that resonate with a tech-savvy audience.
- Content Consumption Patterns
Understand how the target audience consumes content. Whether through blog posts, videos, webinars, or interactive experiences, aligning content formats with audience preferences enhances engagement.
- SEO
Analyze the way SEO works within the SaaS domain. Identify high-performing keywords, assess competitors' keyword strategies, and uncover opportunities to enhance search engine visibility.
Step 2
Keyword Research: Unlocking Visibility
Keyword research is the cornerstone of an effective SaaS Content Marketing strategy. In fact, a survey conducted among startup founders indicated that 90% consider SEO to be a crucial factor in driving brand awareness and generating leads for their businesses.
SEO involves identifying and targeting the specific terms and phrases that potential users will likely use when searching for SaaS solutions.
A robust keyword research process encompasses the following key steps:
- Identifying Core Keywords
Begin by identifying primary keywords that align with the SaaS offering. These should encapsulate the core functionalities and unique selling propositions of the product.
- Long-Tail Keyword Exploration
Explore long-tail keywords that reflect specific user queries and intent. This is mainly because long-tail keywords are less likely to have high competition and can drive traffic that is relevant to the brand’s target audience.
- Competitor Keyword Analysis
Analyze the keyword strategies of competitors. Identify keywords they are ranking for and evaluate the competitiveness of these terms.
- User Intent Understanding
Consider the intent behind user searches.
Are they searching for some information?
Are they seeking solutions to a problem?
Are they set to buy?
Align keywords with the various stages of the customer journey.
- Seasonal and Trend-Related Keywords
Factor in seasonal trends and industry-specific events. Creating content around timely keywords enhances relevance and visibility during peak periods.
- Localization Strategies
If applicable, incorporate localization into keyword research. This is crucial for SaaS providers targeting specific geographic regions.

Step 3
Choosing the Right Formats for SaaS Marketing: Navigating the Sea of Content
Within SaaS content marketing, the choice of content formats is akin to selecting the sails for a seafaring vessel. Each format serves a distinct purpose, resonates with varying audience preferences, and contributes uniquely to the overarching content strategy. Let's embark on a journey to explore the sea of content formats available for SaaS marketing:
- Blog Posts:
Purpose: Inform, Educate, and Build Authority.
Why? Blogs are the workhorses of content marketing. They offer a platform for in-depth exploration of industry trends, product features, and thought leadership. Regular, well-optimized blog posts enhance SEO and keep the audience engaged.
Did you know?
Approximately 36% of sizable SaaS enterprises employ their blog posts to educate readers on various industry topics. - Whitepapers:
Purpose: Thought Leadership and In-Depth Insights.
Why? Whitepapers dive deep into complex topics, providing comprehensive insights, research findings, and expert opinions. They are instrumental in establishing the brand as a thought leader and a go-to source for industry knowledge.
- Webinars:
Purpose: Engagement, Education, and Interactivity.
Why? Webinars bring a dynamic, interactive element to SaaS marketing. They allow real-time engagement with the audience, facilitating product demonstrations, Q&A sessions, and discussions. Webinars forge a more personal connection with potential users.
Did you know?
In the B2B sector, it is strongly believed that webinars contribute to generating nearly 75% of sales leads.
- Video Tutorials:
Purpose: User onboarding and product understanding.
Why? Visual learners rejoice with video tutorials. These concise, visually appealing guides help users navigate software interfaces, understand features, and maximize the value of the SaaS product. Video tutorials enhance user onboarding and reduce the learning curve. - Case Studies:
Purpose: Showcase real-world successes.
Why? Case studies are testimonials on steroids. They delve into real-world scenarios where the SaaS solution has addressed specific challenges and delivered tangible results. Case studies provide social proof, instilling confidence in potential users. - Infographics:
Purpose: Visual representation of information.
Why? Infographics distil complex information into visually appealing, easily digestible graphics. They are perfect for conveying statistics, processes, and key data points. Infographics enhance content shareability on social media platforms. - Ebooks:
Purpose: In-depth guides and resources.
Why? Ebooks offer a comprehensive exploration of a topic, often serving as downloadable resources. They are valuable assets for lead generation, requiring users to provide their information in exchange for in-depth content. - Interactive Content:
Purpose: Engage and entertain.
Why? Interactive content, such as quizzes, assessments, and interactive guides, adds a layer of engagement. It not only captures attention but also provides users with a personalized experience. - Podcasts:
Purpose: Audio-based thought leadership.
Why: Podcasts are a versatile format for conveying industry insights, interviews, and discussions. They cater to audiences who prefer consuming content while on the go.
Did you know?
Podcasts serve as a marketing tool for a minimum of 18% of the leading SaaS app businesses.
Choosing the right mix of content formats depends on various factors, including the target audience, the complexity of the SaaS solution, and the goals of the marketing strategy. The next segment will illuminate the significance of distribution channels and amplify the reach of SaaS content.

Step 4
Creating a Content Outline in SaaS Content Marketing: Crafting the Story
As we embark on the intricate journey of SaaS Content Marketing, the creation of a content piece is akin to sketching the blueprint of a masterpiece. A well-structured outline lays the foundation for an engaging and informative piece that resonates with the audience.
Here's a step-by-step guide on crafting a content outline for your SaaS marketing endeavours:
- Define Your Objective:
Clearly articulate the purpose of your content piece. Whether it's to educate, entertain, or persuade, a well-defined objective guides the entire creation process.
- Know Your Audience:
Know more about your target audience, including their likes, needs preferences, and even their pain points. Tailor your content to address their specific challenges and provide valuable insights.
- Research Thoroughly:
Dive deep into the subject matter. Conduct thorough research to gather relevant data, statistics, and examples. A well-researched piece enhances credibility and authority.
- Choose the Right Format:
Based on your objective and audience preferences, select the most suitable content format. Whether it's a blog post, whitepaper, webinar, or video tutorial, the format should align with your goals.
- Craft a Compelling Title:
The title is the gateway to your content. Craft a compelling and attention-grabbing title that sparks curiosity and conveys the value of your piece. - Develop a Structured Flow:
Organize your content logically. Create a flow that takes the reader or viewer through a journey, from introduction to conclusion. A structured flow enhances comprehension. - Break Down Into Sections:
Divide your content into sections or chapters. This not only makes it more digestible but also allows readers to navigate easily, focusing on specific areas of interest.
- Incorporate Visual Elements:
Integrate visuals strategically. Whether it's images, infographics, or charts, visual elements enhance engagement and break the monotony of text. - Craft Engaging Headlines and Subheadings:
Headlines and subheadings should be captivating and descriptive. They provide a roadmap for readers, guiding them through the main points of your content.
- Incorporate Key Keywords:
Identify and add relevant SEO keywords to all your content pieces. This optimization ensures better visibility on search engines and attracts your target audience.
- Ensure Consistency:
Maintain consistency in tone, style, and formatting throughout your content. Consistency contributes to a seamless reading or viewing experience.
- Add a Compelling Conclusion:
Summarize key takeaways and end your piece with a compelling conclusion. Leave a lasting impression on your audience and give them a clear call to action before they step out.
Creating a content outline is not just a preliminary step; it's the architectural blueprint that shapes the entire content marketing edifice. The next leg of our journey will delve into the crucial aspects of distributing and promoting your meticulously crafted SaaS content.
Step 5
Writing Your SaaS Content Piece: Crafting the Masterpiece
The writing phase is where ideas, research, and creativity converge to create a compelling narrative. Let's delve into the key steps for bringing your content to life:
- Start with a Captivating Introduction:
The opening should grab attention and set the tone for what follows. Intrigue your audience with a compelling hook that encourages them to read on. - Follow the Flow of Your Outline:
Refer to your meticulously crafted outline. It serves as a roadmap, guiding you through the logical flow of ideas. Each section should seamlessly connect to the next. - Infuse Personality and Style:
Let your brand's personality shine through your writing. Whether it's a conversational tone, a touch of humour, or a more formal approach, maintain consistency with your brand voice. - Prioritize Clarity and Simplicity:
Keep your language clear and concise. Avoid unnecessary jargon or complexity. Aim for simplicity without sacrificing depth. - Provide Value Through Insights:
Deliver on the promises made in your outline. Provide valuable insights, backed by research and examples. This is the substance that keeps your audience engaged. - Craft Engaging Headlines and Subheadings:
Headlines and subheadings should not only guide the reader but also pique their interest. Make them compelling and reflective of the content beneath. - Use Visuals Strategically:
If your outline includes visual elements, strategically integrate them into your content. Visuals break the monotony of text and enhance overall engagement. - Optimize for Readability:
Format your content for easy readability. Try adding shorter paragraphs, headings, subheadings, and pointers to break a full wall of content and information. This enhances the user experience, especially in online reading.
- Ensure Originality:
The audience you're targeting via SaaS content marketing campaigns would like to see valuable and original content. Hence, avoiding plagiarism is a must. You should check plagiarism to maintain originality and impress your targeted audience. An advanced plagiarism checker would help you do that without requiring much time and effort.
- Inject a Personal Touch:
Personal anecdotes or real-life examples can add a human touch to your content, in turn building a personal connection with your audience. - Refine and Polish:
Once the initial draft is complete, revisit and refine it. Polish your content for clarity, coherence, and overall effectiveness. - Incorporate SEO Best Practices:
If SEO is a crucial aspect of your strategy (which it should be), ensure that your content incorporates relevant keywords naturally, to up visibility on search engines. - Craft a Compelling Conclusion:
Conclude your piece with a strong and memorable closing. Summarize key points, restate the main message, and provide a clear call to action.
Writing is the heartbeat of your content strategy. It breathes life into your ideas and transforms them into a cohesive narrative.
Step 6
Distributing Your SaaS Content: Ensuring it Reaches the Right Audience
Now, let's ensure that your masterpiece reaches its intended audience. Distribution is a crucial phase in the content marketing journey, and here's your guide to orchestrating it effectively:
- Leverage Social Media Platforms:
Share your content across relevant social media channels. Craft engaging captions and leverage hashtags to increase discoverability. Each platform has its unique audience, so tailor your approach accordingly.
- Email Marketing:
Harness the power of your email list. Send out newsletters or dedicated emails featuring your content. Personalize your messages to make them more compelling. Email marketing is used by 93% of B2B marketers for distributing their content.
- Partner with Influencers:
Identify influencers or thought leaders in your industry. Collaborate with them to share your content and amplify your reach.
- Repurpose for Different Platforms:
Modify your content to suit various platforms. Create snippets for Instagram, shorter versions for LinkedIn, or visually appealing graphics for Pinterest.
- Utilize Paid Promotion:
Boost your content's visibility through paid promotions. Allocate a budget for strategic target-based promotion.
- Engage in Online Communities:
Participate in forums, groups, or communities relevant to your industry. Share your content where appropriate, but ensure it adds value to the conversation.
- Collaborate with Industry Publications:
Reach out to industry publications and offer your content for publication. This can expose your content to a broader audience and establish your brand as an authoritative voice.
- Optimize for SEO:
Ensure your content is optimized for search engines. This includes using relevant keywords, creating a captivating meta description, and having a clean URL structure.
- Monitor and Respond:
Keep an eye on how your content is performing. Monitor social media comments, respond to queries, and engage with your audience. This will help boost traction, and visibility while enabling you to build a community around your content.
- Explore Guest Posting:
Contribute your content to reputable websites in your industry through guest posting. This can enhance your brand's visibility and authority.
- Collaborate with Your Network:
Leverage your professional network. Encourage your team members, colleagues, and industry connections to share the content within their circles.
- Measure and Adjust:
Use analytics tools to measure the performance of your distribution efforts. Track engagement, click-through rates, and other relevant metrics. Based on the data, refine your distribution strategy for future content.
An important point to remember here is that distribution is not a one-size-fits-all endeavour. Tailor your approach based on your target audience, industry dynamics, and the nature of your content.

Kickstart SaaS Content Marketing for your Organization: A Step-by-Step Guide
All geared up to start SaaS content marketing for your brand, but where do you begin? Let's break it down into actionable steps to guide you through the process:
- Define Your Objectives:
Clearly outline your content marketing goals. Whether it's increasing brand awareness, driving leads, or establishing thought leadership, having a clear purpose will shape your strategy. - Identify Your Target Audience:
Understand who your ideal customers are. Create buyer personas that will help shape your content strategy and process. This ensures that your content speaks directly to the needs and interests of your audience. - Craft a Content Calendar:
Plan your content in advance, a content calendar helps you maintain consistency and ensures a diverse mix of topics. Consider seasonality, industry events, and product launches in your scheduling. - Find Skilled Freelance Writers:
Engaging freelance writers can inject fresh perspectives into your content. Look for writers with experience in SaaS or related industries. Platforms like Upwork, Freelancer, or content creation agencies are excellent resources. - Types of Writers You Need:
Keep in mind the content formats you plan on creating. You may need writers skilled in blog writing, whitepapers, case studies, or video scripts. Having a mix ensures your content strategy is comprehensive. - Set Clear Guidelines:
Provide detailed guidelines to your freelance writers. Clearly communicate your brand voice, style preferences, and formatting requirements. A well-defined brief ensures your writers deliver content aligned with your vision. - Manage the Process Efficiently:
Use project management tools to streamline the content creation process. Platforms like Asana or Trello help in assigning tasks, setting deadlines, and maintaining communication with your freelance writers. - When to Bring in In-House Writers?
As your content strategy matures and the volume of content increases, you might consider bringing in-house writers. In-house writers offer dedicated support and align closely with your brand's nuances. However, before you bring in in-house writers, ensure that you have a comprehensive plan and framework in place, to optimise their time and talent. - Establish a Collaborative Workflow:
Foster collaboration between your in-house and freelance writers. Communicate your brand's messaging, goals, and evolving strategies clearly. A unified team ensures consistency in your content output. - Say Hello to Continuous Learning:
Encourage a culture of continuous learning within your content team. Stay updated on industry trends, SEO best practices, and evolving customer preferences. This ensures your content remains relevant and impactful. - Measure Performance:
Implement analytics tools to measure the performance of your content. Track key metrics such as engagement, conversions, and leads generated, and ensure you avoid these five mistakes when measuring content marketing ROI.
That said, the key to successful SaaS content marketing lies in a strategic and flexible approach. Adapt your strategy based on the evolving needs of your audience and the ever-changing SaaS industry.

Emerging Trends in SaaS Content Marketing
- Interactive Content Takes Center Stage
The demand for interactive content experiences is on the rise. Infographics, quizzes, polls, and immersive video content are becoming powerful tools to engage audiences and enhance user experience.
- Personalization Reaches New Heights
Personalized content tailored to individual user preferences is no longer an option but a necessity. AI-driven algorithms and machine learning enable SaaS marketers to deliver highly relevant and targeted content to their audiences.
- Voice Search Optimization
With the growing prevalence of voice-activated devices, optimizing content for voice search is a trend gaining momentum. Tailoring your content to match natural language queries enhances visibility in voice search results. - Long-Form Content for Thought Leadership
In-depth, long-form content is making a comeback. SaaS brands are leveraging comprehensive guides, research papers, and expert insights to establish thought leadership and provide valuable resources for their audience.
Innovations and Technologies Shaping the Future
- Blockchain for Content Security
The decentralized and secure nature of blockchain is finding applications beyond cryptocurrencies. In SaaS content marketing, blockchain can enhance content security, protect intellectual property, and ensure transparent attribution.
- Augmented and Virtual Reality Experiences:
AR and VR technologies are poised to transform content experiences. SaaS marketers can explore immersive product demos, virtual walkthroughs, and interactive AR applications to engage audiences in novel ways. - 5G for Faster Content Delivery
The advent of 5G technology will revolutionize content delivery, providing faster and more reliable connections. SaaS marketers can leverage this for seamless video streaming, enhanced user experiences, and real-time interactions.
Through this article, right from the definition and unique characteristics to the strategic nuances of crafting compelling content – one thing’s clear - the world of SaaS Content Marketing is changing constantly. Brands that adapt to these changes and leverage cutting-edge technologies will be well-positioned to capture the attention and loyalty of their target audiences in the future.
The future of SaaS content marketing is teeming with opportunities. From the increasing demand for interactive and personalized content to the transformative potential of emerging technologies, the evolution is both exciting and relentless.
As we come to a close, it’s important to note that the key to success lies in a blend of creativity, strategic insight, and a keen understanding of your audience. Whether you're embracing the power of AI, delving into immersive experiences with AR and VR, or optimizing for the era of voice search, staying at the forefront of innovation is your mantra for success.
SaaS content marketing is not just about conveying messages; it's about creating experiences, forging connections, and establishing lasting relationships with your audience.

Top 10 Warmly.AI Alternatives-Compare Pros, Cons & Pricing
Account identification and targeted outreach are imperative for B2B marketing and sales teams aiming to engage elusive prospects already demonstrating interest.
But, while Warmly provides capabilities to reveal anonymous website traffic, you may be looking for warmly alternatives based on your specific requirements.
This guide will compare Warmly against the ten similar competing solutions and evaluate each platform across key factors like features, accuracy, integrations, support, and pricing to determine the best fit across various use cases and budgets. Read on for an in-depth assessment before deciding on an account-based intelligence and analytics tool to deploy.
What Does Warmly Do?

Warmly is an autonomous sales orchestration platform that helps businesses scale personalized sales outreach and account-based marketing programs. It enriches anonymous account data, provides intent data, and engages high-value accounts in real-time.
Using predictive analytics and powerful engagement tools Warmly helps with personalized outreach across multiple channels to generate more leads and sales.
Key Features of Warmly
Warmly focuses on account & contact identification and outreach to known contacts. Main features include:
- Autonomous Sales Orchestration: Captures buyer interest by combining intent and action data to personalize engagement across email, LinkedIn, and live chat.
- Automated Intent-Driven Outreach: Uses AI to connect with prospects at optimal moments in their buyer’s journey by identifying the buying committee of accounts that recently visited the website.
- Scales Sales Capacity: Allows engaging with every target account visiting the website via multi-threaded conversations without needing to add headcount.
- Orchestrates Tech Stack: Consolidates tools, workflows, and actions to instantly capture decision-makers' interest by integrating with Warmly.
Pricing (As of Dec 2023)
- Free forever: Supports 500 monthly identified accounts and enrichment of 60 leads
- Paid plans: Starts at $850 per month, billed annually for up to 25,000 monthly identified accounts
- Enterprise plans: If you need to identify more than 25,000 monthly accounts, you can connect with their sales team for a custom plan.
Top 10 Warmly Alternatives for Account-Based Marketing in 2025
So, if not Warmly, which tool should you pick for your account-based marketing?
Let’s deep dive into 10 leading Warmly alternatives for identifying and converting anonymous B2B accounts through account-based approaches.
1. Factors.AI

Factors is an account-based marketing and analytics platform built to help B2B organizations identify anonymous website visitors, analyze their journeys, attribute revenue to marketing efforts, and unify cross-channel data.
It empowers marketing and sales teams by turning previously unknown website traffic into qualified leads and customers. The strong foundation of datasets allows Factors to identify and enrich up to 64% of anonymous traffic—significantly higher than most alternatives in the market.
Key Features of Factors
- Account Intelligence: Factors leverages a large proprietary IP database combining 6sense intelligence on over 100 million businesses with Clearbit's 4.5 billion IP addresses and business information catalog. With that, Factors can identify over 60% of website traffic and immediately alert users about companies visiting any of their marketing channels, including websites, LinkedIn pages (or ads), G2 pages, and more. This method of using IP data sets, paired with company intelligence, captures a wider range of anonymous traffic than nearly all competitors focused solely on IP logs or declared traffic sources.
- Account Scoring: Factors enriches identified traffic with 220+ attributes from data partners to construct complete firmographic profiles. This includes intelligence on company size, industry, tech stack details, buying committee contacts, location information, and intent signals scraped from LinkedIn. Sophisticated machine learning algorithms analyze activities across accounts to generate an AccountAI Score reflecting overall sales readiness. This helps marketing and sales teams effectively tier and prioritize follow-ups based on demonstrated interest levels.
- Customer Journey Analytics: Factors maps complete end-to-end customer journeys by connecting anonymous visitors to downstream marketing and sales events across channels. Users can visualize touchpoints influencing account progression through the funnel, isolate key bottlenecks impacting conversion rates, and see true time-to-revenue for guiding optimization.
- Unified Reporting and Attribution: Factors also allows the creation of customized analytics reports, unifying data from ad platforms, web analytics tools, marketing automation systems, and other sources via APIs. This empowers accurately measuring campaign, content, and other marketing efforts driving pipeline and revenue. Users can validate media mix and double down on the highest converting initiatives.
Benefits
- Factors is unique in capturing holistic intent signals across LinkedIn and G2 engagements and the website. This means users can identify anonymous accounts and map touchpoints from ad impressions, G2 review page views, and more.
- At the time of writing, Factors can identify and enrich more accounts per dollar than Warmly
- Higher reported data accuracy—The data and scoring methodology result in more precise identification of ideal customers. This means less wasted effort chasing poor fits.
- More integrated communication channels like Slack and Microsoft Teams - Seamlessly continue the conversation where your team already collaborates without switching tools or losing context.
- Unlimited seats for all plans so you can scale your operations without worrying about increasing costs.
Limitations
- Relatively fewer direct integrations with CRMs and API access beyond HubSpot, Salesforce, and Leadsquared. However, these limitations are resolved with Factors’ integration with Make.com and Zapier, giving you access to thousands of tools and integration possibilities.
Pricing
- Free forever plan: 100 account identifications per month
- Starting paid plan: $99 per month for up to 350 visits, billed annually
{{INLINE_CTA_A}}
2. Leadfeeder/DealFront

DealFront, formerly Leadfeeder, takes an IP logging approach to identify companies driving website traffic and appending helpful intent signals for outreach.
Key features of DealFront:
- Account Identification: DealFront leverages techniques like IP mapping and fingerprinting matched to a database of 66 million businesses to determine companies behind roughly 40% of site traffic.
- Contact and Account Enrichment: The platform enriches lead records for identified traffic sources with dozens of valuable attributes like company size, industry vertical, technologies used, intent signals, location information, and more through proprietary data models.
- Analytics Capabilities: It tracks granular prospect behavior data like content downloads, time spent per page, and referrers to provide complete visibility into research activities across site visits.
Benefits
- Lead scoring models automatically tier accounts by engagement levels to accelerate sales prioritization.
- Identifying remote and roaming devices provides a more complete view of account committee behavior.
- An expansive integration ecosystem centralizes anonymous traffic data across 300+ apps for greater visibility.
- Enriched firmographic data appended to 70% of matched visitor records.
Limitations
- Some user reviews cite issues handling changes in contractual terms, pricing, or subscriptions upon renewal and delays in resolving technical problems.
- Reliance on external data sources may impact identification latency or accuracy for certain types of traffic according to observed effects by some customers.
Pricing
- Starts at €139 per month for 100 identified accounts, billed annually.
3. Lead Forensics

Lead Forensics focuses specifically on matching website IP addresses to an internal database of company information. It alerts sales teams about target account visits for rapid outreach.
- Account Identification: The platform cross-checks IP addresses from web traffic against a catalog of 1.4 billion IPs to identify associated businesses, typically providing company attributes for roughly 40% of visits.
- Lead Routing and Notifications: Real-time browser alerts notify reps when target accounts exhibit research behaviors across site pages. Lead Forensics automatically updates lead records in supported CRM platforms like Salesforce for immediate sales follow-up.
- Enhanced Profiles: For matched traffic, Lead Forensics enriches visitor data with useful B2B metrics like company size band, geographic details, industry classification codes, and more to support segmenting by firmographic criteria.
Benefits
- Real-time alerts enable sales follow-up within 5 minutes of high-value visits to improve conversion results by 45%.
- AI-enabled scoring is available for lead prioritization assistance.
- GDPR compliant to support international data handling requirements.
- Predictive analytics forecast buyer readiness without intensive data science resources.
- Emergency weekend support services ensure critical issues get rapid attention.
Limitations
- With a comparatively smaller database of 1.4 billion IP addresses to check against and a <50% data accuracy, fewer accounts visiting your website can get matched to the companies.
- Currently, Lead Forensics lacks account timelines, multi-touch attribution, or revenue analytics.
Pricing
- Currently, the exact pricing is not available publicly, and you need to reach out to the sales team for quotes which are based on usage and data needs.
4. Lead Lander

Lead Lander offers an expansive, frequently updated IP database with predictive analytics to identify anonymous accounts, score their potential, and automatically transfer hot leads to CRMs for sales execution.
- Account Identification: By comparing website IP logs against its database, Lead Lander can determine associated business details for accounts. However, depending on the industry, they offer an accuracy of <50% of the traffic.
- Lead Analytics and Scoring: Proprietary machine learning algorithms analyze account and contact-level data points like repeat visits, page views, referer quality, time on site, and recent activity to generate an automated lead score reflecting sales potential.
- Campaign Exposure Tracking: Lead Lander pairs inbound research activity with outbound campaign deployment dates across channels like email, events, content syndication, and paid media. This closed-loop reporting validates prospect-level awareness, engagement lift, and sales impact across tactical programs.
Benefits
- Pre-built integrations with platforms like HubSpot and Salesforce help streamline data flows to improve workflow efficiency.
- Account enrichment features enhance seller context for personalized outreach by surfacing intelligence on firmographics, recent triggers, and a timeline view of historical account behavior.
- Lead Lander’s form tracking visibility supports understanding how landing pages and forms convert so teams can optimize lead capture processes.
Limitations
- A maximum of 100 identified monthly (for the base plan) accounts will likely prove too restrictive for sales teams needing to run large-scale account-based campaigns and outreach initiatives.
- Some reviewers believe that <50% data accuracy can lead to data inaccuracy. Other competing solutions like Factors (65+%) and Warmly offer more.
Pricing
- Base plan: Starts at $99/month. It is an affordable solution for identifying accounts and contacts. Offers a maximum of 100 accounts that can be identified in this plan.
{{INLINE_CTA_A}}
5. LeadInfo

LeadInfo captures IP addresses from anonymous accounts that visit your website and appends actionable intelligence to accelerate sales prospecting.
Key Features of LeadInfo
- Real-Time Account Identification: LeadInfo leverages an IP cross-check database of over 220 million businesses to instantly identify details on companies driving web traffic, typically matching 30-40% of monthly accounts to commercial entities. Alerts get pushed in real-time to CRM and email platforms.
- Enriched Profile: For identified companies, LeadInfo enriches visitor data with dozens of valuable B2B attributes around industry classification, technologies used, regional headquarters, and contact roles to facilitate lead qualification, routing, and prioritization for sales teams.
- Lead Management: Intuitive lead dashboards allow filtering website traffic by source, time on page, keyword usage, and other engagement metrics. Teams can easily tag records matching customer criteria for ideal follow-up segmentation across sales and marketing.
Benefits
- 220M+ firmographic database is also one of the largest company databases on this list and can be quite useful for businesses.
- LeadInfo is known to offer excellent and prompt support for customer queries.
- GDPR compliance helps you ensure you are not breaching any EU laws while trying to capture data.
Limitations
- Anecdotal evidence suggests that LeadInfo offers <50% match rate for anonymous traffic–leading to lost connection opportunities as prospects conduct research without triggering any follow-ups due to data gaps.
- Per user feedback, the absence of contact-level insights or personnel names available in firmographic data makes it challenging to personalize initial outreach messaging.
Pricing
- Base plan: €129 monthly pricing (billed annually) for up to 400 identified accounts.
6. LeadPost

LeadPost combines anonymous account identification with seamless integrations across advertising channels to enable targeted account-based digital campaigns through core capabilities.
Key Features
- Account Identification: LeadPost uses IP tracking matched against an internal database to reveal company details on just 20% of monthly website traffic. Lower match rates mean more anonymous accounts get missed for outreach.
- Retargeting Integration: Matched accounts get automatically added to customizable target lists for deployment across search, social media, and programmatic display advertising through supported platforms like Facebook, LinkedIn, Google, and more.
- Orchestration Tools: LeadPost allows configuring specific paid media budgets across integrated ad platforms to set and optimize cost controls easily. Real-time dashboards provide campaign performance visibility like clicks, conversions, and return on ad spend in one unified view with CRM data.
Benefits
- LeadPost has integrated budget controls that allow you to set custom monthly ad spend limits and optimize costs.
- Like most Warmly alternatives, it offers one-click integrations to push leads into CRMs like Salesforce and HubSpot for automated lead delivery.
- You can integrate suppression lists to filter out existing contacts and capture new prospects.
Limitations
- LeadPost only identifies up to 20% of anonymous accounts, lower than other tools like Factors (60+%) and LeadFeeder (40%).
- Unlike other tools, LeadPost does not provide keyword-level tracking of accounts or allow you to view pages visited.
- It lacks predictive lead scoring to identify high-propensity prospects based on behavior and attributes. Most competitors offer this feature.
Pricing
- Base plan: LeadPost starts at $99/month for up to 250 leads. The plan offers all the features you need to get started. Your website must have at least 1000 monthly unique visits to integrate with LeadPost.
7. Albacross

Albacross combines IP-to-company matching with real-time sales alerts and cross-channel advertising capabilities for account-based activation.
Key Features
- Account Identification: The platform identifies businesses based on IP address, matched against an internal database of over 15 million companies to reveal some attributes about matched traffic sources.
- Sales Notification Tools: In real-time, Albacross alerts designated CRM users and other integrated collaboration platforms when target accounts exhibit website engagement during their buyer journeys to drive rapid, personalized outreach.
- Advertising Integrations: Matched accounts get automatically added to customizable target segments for deploying display advertising campaigns across platforms like LinkedIn, Google, and Facebook. Advertising capabilities span early to mid-funnel only.
Benefits
- Easy to set up and integrate with CRM, marketing automation, Slack, etc.
- Identifies companies visiting the website and captures their intent signals like pages visited. Provides insights into the ideal customer profile. (Newaz Chowdhury, Marketing Executive)
- Alerts sales reps in real-time when target accounts visit the site so they can engage quickly. (Thorsten B., Team Lead Digital Marketing)
- Helps segment and target accounts for account-based marketing and sales campaigns.
- Provides firmographic data like industry, revenue, and location to enrich visitor profiles.
Limitations
- Unlike competing tools, Albacross does not have third-party intent data, and the "personal" contact details are vague. (G2 Reviewer)
- Some metrics are not as straightforward, and it is unclear how some KPIs are calculated (for example, Activity Bar/Scoring). (G2 Reviewer)
- The sorting of segments and filtering could be more agile. Currently, you can't filter on name or size. (Anne Katrine V., Head of Marketing)
- The prices can be steep if you have a high-traffic site and would like to identify more accounts than just the 100 in their base plan. (David C., Chief Marketing Officer)
- Albacross does not offer CRM integrations and no direct connection. So, a tool like Zapier must connect data between tools. (Lara L., S)
Pricing
- Base plan: $79 per month, billed annually, for 100 identified accounts. The plan offers all the other features of Albacross. Higher plans require you to get a quote from the team.
{{INLINE_CTA_A}}
8. Visitor Queue

Visitor Queue identifies anonymous website traffic in real-time and builds differentiated site experiences for accounts based on matched attributes and behaviors through tools like:
Key Features
- Account Identification and Analytics: By comparing website IP logs against an internal database, Visitor Queue provides the name, industry vertical, location, and technology details of businesses. However, it lags behind industry standards in the percentage of identified accounts.
- Lead Management and Transfer: Matched accounts get automatically added to customizable queues with capabilities to filter and search records by keywords, data fields, and website analytics metrics.
- Personalization Engine: Visitor Queue allows serving tailored site content like banners, case studies, testimonials, and pricing for identified accounts matched to configured audiences across categories like company size, industry, tech used, and others to boost engagement.
Benefits
- VisitorQueue provides unlimited user seats, enabling sales teams to widely share account intelligence across the organization without incurring additional licensing fees or access limitations.
- Native contact enrichment capabilities equip sales reps with firmographic, technographic, and intent data to personalize and contextualize outreach messaging for improved response rates.
- Direct integration with CRM systems (only in Pro plans) helps sales teams streamline flows of enriched visitor data into these downstream platforms to align with existing workflows.
Limitations
- As per anecdotal evidence, the data accuracy isn’t as good as the competitive solutions, which puts the effectiveness of any outreach actions taken on VisitorQueue intelligence into question.
- We couldn’t find information on their company database sourcing, scope, or rigor, making it difficult to assess quality standards for enterprise readiness.
- It only connects with Zapier for integrations versus more robust connectivity offerings from rival tools.
Pricing
- Base plan: Starts at $31 per month. This makes VisitorQueue quite affordable, helping smaller or growing revenue teams try out account intelligence without a lot of investment. Like most other tools, this plan allows the identification of up to 100 unique companies/month.
9. Snitcher

Snitcher identifies and segments anonymous accounts for building targeted remarketing campaigns and custom analytics reporting through core features like:
Key Features
- Account Identification: Snitcher uses automatic IP address tracking matched to an internal company database to reveal business details. However, their accuracy may be reportedly lower than other top Warmly competitors.
- Analytics Integration and Segmentation: Snitcher pushes visitor data into integrated marketing platforms like Google Analytics and Facebook to construct target account audiences for search, social media, and display advertising remarketing.
- Lead Management: Proprietary algorithms score identified traffic on various engagement metrics to classify visitor quality as low, medium, or high conversion potential. High scores get automatically routed into supported CRM systems like Salesforce for sales execution.
Benefits
- Snitcher accurately identifies companies visiting your website, allowing you to turn unknown traffic into actionable leads. (Maciej H., PR & Marketing Specialist)
- The platform enriches visitor data with detailed firmographic information like company name, industry, location, etc. This provides context to understand better and segment your traffic. (Shashank S.)
- Snitcher is quick and easy to implement, with minimal technical know-how required. The intuitive interface allows anyone to analyze traffic and export data effectively. (G2 reviewer)
Limitations
- The lower pricing tiers limit the number of leads identified, which may be restrictive for higher-traffic websites. (Jakub M., CEO of a Small Business)
- While identification is accurate overall, some reviewers noted inconsistencies in enriching some visitor data with company information. (Jeroen A.)
- Reviews mentioned the need for more advanced analytics and visualization capabilities built into the platform. (Nikolaj Storgaard P.)
Pricing
- Base plan: Starts at $39/month, making Snitcher an affordable solution. You can identify a maximum of 100 unique accounts per month.
{{INLINE_CTA_A}}
10. Untitled Firm

Rather than simple account identification, Untitled Firm takes an identity resolution approach using probabilistic matching to connect behavior across known and anonymous individuals.
Key Features
- Identity Graph: Untitled Firm builds an identity graph mapping interactions to individuals using statistical models assessing signals like name, location, employer, title, and more to determine matches across authenticated and unauthenticated events.
- 360 Profiles and Segmentation: By combining data from CRM records, transaction systems, web analytics, and other sources, Untitled Firm offers enriched customer records reflecting commercial, behavioral, and technical data. Through integrated data science capabilities, you can then use this to inform personalization use cases across marketing, sales, and service scenarios.
- Activation Channels: Marketer users can leverage persona scores, lookalike modeling, churn analysis, and other data applications as triggers for orchestration across messaging channels and deliver tailored experiences.
Benefits
- Unified customer profiles can help sales and marketing teams gain a more holistic understanding of customers to drive personalized engagement.
- Identity resolution provides visibility into entire customer journeys across devices and touchpoints that are lacking with IP identification alone.
- Lead enrichment enables acting on anonymous traffic instead of losing those prospects, potentially increasing conversion rates.
- Privacy controls can help ensure compliance in the new data privacy regulatory environment.
Limitations
- Less extensive third-party data integration may limit lead enrichment capabilities compared to some alternatives.
- It is still new, so technology and features may not be as mature as established players.
- Reliance on pre-built integrations can make connecting new data sources or platforms more difficult.
- Advanced analytics capabilities lagging competitors means less customizable reporting and visualization currently.
- The accuracy of identity resolution has yet to be fully proven across diverse customer bases and websites.
Pricing
- Base plan: Untitled Firm charges based on the monthly traffic and account resolutions. The pricing starts at $500/month for 0-1000 resolutions and grows to $17,500/month and beyond.
Top Alternatives to Warmly.ai
Finding the right alternative to Warmly.ai ensures businesses can enhance account identification and targeted outreach effectively.
- Leading Platforms: Apollo.io, Qualified, 6sense, ZoomInfo Sales, and Drift.
- Key Features: AI-driven insights, real-time engagement, predictive analytics, sales intelligence, and conversational marketing.
- Strategic Benefits: Improve lead generation, enhance B2B targeting, automate workflows, and personalize outreach.
Evaluating these tools based on integration capabilities, pricing, and feature sets helps businesses find the best fit for their needs.
Go For the Best Warmly Alternative and Enhance Pipelines
With account identification and engagement vital for B2B revenue growth, platforms like Warmly capture and reveal anonymous accounts and help sales teams prioritize their outreach and follow-up. That being said, based on your requirements, you may find an alternate solution to be a better fit. Here's why Factors could be the right choice for you:
- Industry-leading account identification rates of up to 60%
- Account scoring and full funnel analytics
- Enhanced data unification and attribution quantifying marketing’s pipeline impact
- Forever free version with all capabilities and indigenous integrations
{{INLINE_CTA_A}}
With its immense proprietary database and machine learning-driven analytics, Factors helps you:
- Capture 27% more anonymous website visitors than most competitors
- Score accounts and prioritize sales outreach more intelligently
- Visualize complete journeys and optimize channel spending allocation
- Prove ROI across programs to double down on growth drivers
Want to see how Factors can help you? Book a personalized Factors demo today!
See how account intelligence and machine-learning-based analytics capabilities can drive more value and accelerate account-based pipeline growth.

B2B Sales And Marketing Alignment | 101 Guide
"Marketing isn't sending us quality leads," "Sales can't close the deal fast enough" – sound familiar?
With conflicting opinions and an ongoing blame game, sales and marketing are always at war, but the only thing getting killed is your chance to drive revenue. 52.2% of sales professionals find that sales and marketing team misalignment results in lost pipeline and revenue.
We're here to tell you everything you need about B2B sales and marketing alignment to foster healthy collaboration and avoid losing revenue. This blog covers:
- Reasons for Sales and marketing misalignment
- Why sales and marketing alignment is a must
- Must-try sales and marketing alignment strategies
First off, What does Sales and Marketing Alignment even mean?
Sales and marketing alignment is the strategic integration and collaboration between sales and marketing teams to boost business efficiency and drive growth. It ensures that both departments eliminate silos by communicating effectively and working in tandem toward common objectives.
While operating in silos would’ve worked in the past, it’s crucial for B2B sales and marketing teams to unify their go-to-market efforts.

Why is B2B Sales and Marketing Alignment Important?
Here are 5 reasons why B2B sales and marketing alignment is important:
1. Deliver a Unified and Seamless Customer Experience
The B2B customer journey is non-linear and complex. With countless marketing and sales touchpoints to analyze and optimize, it’s no surprise that businesses still struggle to understand it. Plus, when your sales and marketing teams are misaligned, it only complicates the situation further.
Aligning customer engagement across marketing and sales efforts leads to a more holistic view of the customer journey map and allows both teams to execute their strategies coherently while offering a seamless customer experience.
2. Improved Understanding of Your Ideal Customer
Sales and marketing interact with buyers differently, which means they have completely different understandings of their customers. For example, marketers have a more holistic understanding of aggregate buying behavior across a large number of buyers. but sales has more personal knowledge of each buyer.
Sales understands the major pain points and objections buyers overcome before investing in a product. Marketing uses insights from market research, website analytics, and social media data to craft content aligned with the buyer's journey. By combining these insights, you'll gain a much better understanding of your customer.
3. Clearer and More Productive Feedback
Let’s say marketing fails to inform sales about a lead they gain from a blog about SOC II compliance. As a result, sales doesn’t highlight the tool’s compliance feature, prompting your prospect to look for a secure alternative.
When your teams are aligned, it opens doors to clearer communication.
An open line of communication allows you to focus on refining strategies and keeps the team receptive to constructive feedback.
For instance, when your sales team receives insight from their sales calls about your competitor's product being too complicated to use, marketing can use this to create content and launch campaigns that highlight your product’s ease of use.
“Our strategic approach to teamwork entails focused measures at RecurPost. For example, the teams engaged in joint planning sessions for introducing a new subscription plan where such messaging was coordinated making the customer journey seamless.
Using a shared feedback loop in everyday meetings was effective. During a recent content campaign, sales generated customized messaging which ultimately raised lead engagement by 20% after one week.” – Debbie Moran, Marketing Manager at RecurPost
4. Improves Team Performance
When marketing and sales focus on divergent KPIs and metrics (Eg: Marketing focuses on MQLs and Sales focuses on revenue), there's much more room for conflict and blame.
When both teams align on metrics like "pipeline/revenue generation," it's in their interest to collaborate to optimize ROI and pipeline.
5. Higher ROI from GTM Efforts
When the sales and marketing GTM motions are misaligned, you risk losing opportunities to close deals and create the potential for infighting among teams.
Alignment between sales and marketing is crucial to executing a successful GTM strategy. According to Forrester when your company aligns on tech, processes, and people, you can see 36% more revenue growth and 28% more profitability.
This is because smarketing empowers:
- Better experience for each member of the buying group
- Engagement with more members of the buying committee
- Relevant, aligned messaging across marketing and sales channels
- Better brand recall and perception amongst buyers that your brand is an expert
Why is Sales and Marketing Alignment Difficult?
While occasional disagreement between sales and marketing is natural, certain red flags indicate misalignment. There are many tell-tale signs for when your B2B sales and marketing teams aren't aligned, such as:
- The sales team repeatedly blames marketing for "low-quality" leads.
- SDRs disqualify the majority of MQLs right off the bat.
- Marketing collateral goes unused by the sales team.
- Your marketing and sales team operates in silos

We believe there are 4 main reasons for this misalignment:
1. Lack of Strategic Function in Marketing
Marketing is often known just to write blogs and create pretty infographics while not directly contributing to revenue. It has always been seen as a service function instead of a strategic one. This is because marketers have a one-track mind to measure success – getting leads.

Rather than ending their responsibility at leads, where they might not care about what happens after they are passed to sales, marketing must be held responsible for:
- New Customer Acquisition - all the way from getting leads to account engagement, opportunity acceleration and revenue generation
- Expansion and Upsell Revenue - engaging and educating existing customers to get additional revenue
- Retention and Churn prevention - Product Education to help customers realise value from the product and hence drive retention
2. Misaligned Priorities
Even though sales and marketing have common goals of increasing revenue and improving CLV, they use different metrics to measure success, with sales carrying the major burden of bringing in revenue. An aligned strategy begins with the shared goal of prioritizing customer value. Use this commonality to jointly create campaigns that target the same audiences and accounts while ensuring an overlap in your teams' measurement and KPIs.
3. Ownership of Customer Data
We can access customer data at our fingertips today but said data has minimal value when left in disparate systems. 60% of sales reps say marketing and sales don't co-own customer strategy and data, and 25% say customer data is still owned in silos by marketing and sales.
For example, if you use CRM tools and marketing automation platforms, ensure they're easily linked. By uniting their data, both teams will gain more insight into the full process and a clearer picture of campaign efforts that drive the most ROI.
4. Operating in Silos
The most common challenge when aligning sales and marketing teams is balancing "healthy competition" and collaboration.

When deals are attributed as "Marketing" or "Sales," it creates an "us" vs. "them" mentality between the two teams, and each of them is under immense pressure to perform. The elimination of silos and the establishment of a collaborative, cross-functional, and revenue-generating unified team is a key driver for future success as the typical buyer journey continues to evolve.
The best way to break down these silos is by having constructive conversations with both teams to answer the following:
- What does marketing need from sales?
- What does sales need marketing?
- What does the typical customer journey look like?
- What does our ICP look like?
- What does a qualified lead look like?
- What can each team do better?
"Given that many marketing and sales misalignments stem from in-fighting over attribution, a multi-touch attribution model that accounts for sales and marketing efforts can help." Joe Kevens, Director of Demand Generation at PartnerStack and the Founder of B2B SaaS Reviews
▶️Learn more about multi-touch attribution models here.
8 B2B Sales and Marketing Alignment Best Practices You Must Follow
1. Agree on a Common Buyer Persona
Creating a sales and marketing alignment strategy without a clear understanding of your target buyer is like driving in the dark without headlights. Sales and marketing teams must collaborate to understand their buyers, tailor their messaging, and pitch accordingly to win deals.
"We create buyer personas in Cisco to identify the perfect buyer, the perfect person that we could target with a marketing message based on segments, job descriptions, and based on where a person is currently in the buyer journey." – Carola Van Der Linden, Global Virtual Marketing Manager, Cisco

2. Set Shared Goals and KPIs
Marketers and sales teams have their eyes on different metrics and short-term goals. Getting them to agree may require a new focus point for both groups. Technically, marketing and sales teams share the same goal: converting new leads. However, this process can seem like two separate stages because of the perceived handoff from marketing to sales. Encourage your teams to think about the sales funnel as one process rather than two different processes.
"Concerning key KPIs for gauging sales and marketing alignment success– revenue growth, lead conversion rate, and customer acquisition cost are amongst the classic ones. To ensure these KPIs truly mirror the impact on revenue and customer satisfaction, I recommend organizations to use tools that track customer lifecycle value and provide a holistic view of the customer journey." Will Yang, Head of Growth & Customer Success at Instrumentl
The new sales-marketing relationship should be guided by shared metrics, which reveal an organization's data agility and ability to hand off real-time data insights. Shared metrics encapsulate the state of the current relationship, alignment initiatives, collaboration technology, and outcomes. They keep everyone on the same page and determine how to redefine the relationship.
3. Prioritize the Right Buyers with Account Scoring
When you’re scoring leads based on their interest in your business, their current place in the buying cycle, and their demographic fit, you can ensure that your sales reps are talking to the right leads at the right time. Your marketing and sales teams should get together to determine score thresholds—at what score does a lead get sent to sales?
Scoring accounts also helps the marketing and sales team prioritize "sales-ready" accounts and work together to target a focused pool of targets as opposed to casting a wide, uncertain net.
Snowflake has a “one team GTM” with an account-based marketing strategy that combines intent data, personalized touchpoints, and collaboration between sales and marketing teams. This strategy has been successful in targeting and engaging key accounts.
▶️Check out our latest guide on Account Scoring here
4. Promote Clear Communication and Collaboration
Ensuring collaboration doesn't mean creating a Slack channel with SDRs and marketers or sending each other multiple links. There are many ways you can nurture a good relationship between both teams. Some ideas include:
- Joint meetings and training sessions
- A day where marketing shadows the sales team and vice versa
- Collaborative exercises where the teams work together
"A specific initiative that yielded remarkable results at Synthesis AI Studio was our 'Customer Journey Mapping' exercise, where sales and marketing collaboratively analyzed and mapped out the entire customer journey, leading to a more cohesive customer experience strategy.
Our pivotal moment was when we restructured our approach to product launches. By involving both sales and marketing from the inception stage, we ensured that marketing strategies were in sync with sales objectives. This alignment led to one of our most successful product launches, with a 40% increase in lead conversion rates." – Oliver Goodwin, Founder & CEO at Synthesis
5. Use Technology to Bridge the Gap
You must build a solid tech stack to manage your data and progress toward your smarketing goals. Here’s how Factors can help you propel sales and marketing alignment in your organization:
- Identify and engage with anonymous, high-intent accounts engaging with your brand across marketing and sales touchpoints
- Identify points of friction and optimize conversions with AI-powered customer journey insights
- Monitor marketing ROI with Revenue Attribution to scale campaigns that get results
- Complete visibility of customer data and pipeline for sales and marketing teams by integrating with existing tools.
.avif)
▶️Check out how Factors.ai helped Klenty increase conversions by 34%
{{CTA_BANNER}}
6. Ensure Consistency In Your Messaging
Unclear messaging creates a subpar brand experience–and hampers win rates. Both sales and marketing should understand and reinforce your product's value proposition.
Your messaging must fall into three sections:
- What we do;
- How we do it;
- Why do we do it.

When what, how, and why are aligned, you have a filter to help you make marketing and sales decisions about your core message.
"There was one time that our sales and marketing team used different messaging. Once we noticed that, we created this guidebook for a shared language and developed a unified messaging framework. This involved joint workshops to ensure that marketing materials and sales pitches were aligned. Now, we come up with consistent messaging. This has improved customer understanding– we know that as there are as we've observed a drastic reduction in clients seeking confirmation about our offerings." -- Andre Oentoro, CEO of Breadnbeyond
7. Create Useful Sales Enablement Content
Even before talking to a salesperson, a prospect is more than halfway through their buying journey. Marketing teams create lead-generation content and campaigns to drive interest in their services and products.
However, they need in-depth insights from sales on the types of content your prospects care about. Customers aren't impressed by a landing page listing endless features, they want to know how your solution resolves their pain points, and who better to ask about customer pain points than your sales team?

Encourage your marketing team members to shadow sales calls. While time-consuming, the exercise can provide customer insights for marketing initiatives and new content ideas. Marketing can also suggest improvements to sales call scripts.
Meanwhile, your sales team can also suggest new content ideas. If there's an urgent need for a content piece, request marketing to prioritize the subject in the content calendar.
8. Create a Systematic Process for Working With Leads
Sales and marketing operate on two different levels, with marketers focusing only on obtaining MQLs and sales focusing on closing SQLs. When you have multiple funnels and lead nurturing processes, both teams operate at different paces toward different goals.

Consider these aspects when reworking your process of working with leads:
Routing: Where do the leads go between marketing and sales?
Priority: What's the order in which we reach out to our leads?
Timing: How quickly should you reach out to prospects, how often, and over what timeframe?
For example, leads from review or comparison websites can be contacted within two hours, while leads from lead gen forms can be contacted within six hours.
It is also crucial to know at what stage each team must engage with the lead to avoid bombarding customers with information overload. To help divide engagement responsibilities between sales and marketing teams, you can use a "Fit & Intent" matrix.

- Fit is how well your product solves the needs of the customer.
- Intent is how motivated your prospect is to invest in your product
Here's the breakdown of how marketing and sales can handle each lead according to each quadrant:
Low fit, low intent: This area focuses on nurturing leads, which can be handled by either marketing or sales, depending on the lead source.
Low fit, high intent: A lead in this quadrant wants more information to gauge if your product can help them. The marketing team has primary responsibility here, with support from sales as required.
High fit, low intent: This quadrant needs joint ownership and support from marketing and sales. Examples of this can include MoFU content, sharing pricing plans, or demo calls with sales representatives.
High fit, high intent: A lead in this quadrant is ready to buy, so it's time for sales to own the process and drive the conversion.
Align Your Sales and Marketing Team Today
Rome wasn't built in a day, and neither is B2B sales and marketing alignment. Only when sales and marketers work from the ground up to collaborate and understand their buyers while focusing on providing value to prospects – can you see tangible results.
.webp)
How to Establish a Comprehensive Content Ecosystem for Your Brand
Digital marketing has become increasingly important in recent years as more and more people spend time online. In fact, according to a recent study by Statista, over 5.3 billion people use the internet worldwide. This means that digital marketing is a great way to reach a large and engaged audience.

Content plays an increasingly central role in modern marketing strategies. In the current landscape, 82% of marketers invest in content marketing, with short-form video taking center stage as it delivers high ROI and is the trend that will see the most growth in the near future.
Furthermore, 71% of B2B marketers believe content marketing has become more important to their organizations in the last year. With these statistics in mind, it’s clear that establishing a comprehensive content ecosystem is essential for any brand looking to thrive digitally.

All these digital tools require content. Content in digital marketing refers to any type of information that is created and shared online to promote a brand or product. This can include blog posts, articles, infographics, videos, podcasts, social media posts, and more.
The role of content in modern marketing strategies
Content is essential for promoting your business or product brand in today's digital world. It helps your business to achieve several important goals, including:
- Increase brand awareness and visibility: When your business creates and shares high-quality content regularly, you increase the chances of being seen by potential customers.
- Drive traffic to your website: Content can be used to attract visitors to your business's website through search engine optimization (SEO) and social media marketing.
- Generate leads and sales: You can use content to generate leads and sales by offering valuable information to potential customers in exchange for their contact information.
- Build trust and credibility: When your business consistently creates and shares high-quality content, you build trust and credibility with your target audience.
- Position your business as an expert in its field: By creating and sharing content that demonstrates its expertise in its field, your business can be positioned as thought leaders and attract more customers.
But the creation and distribution of content is not a simple, “click the button and you are done” task. It requires time and investments to make sure that the content is suited to your business and its audience and is relevant over a long period.
For this, you must develop a “content ecosystem” that covers all your products, brands, types of content, content teams, technologies, and distribution channels.
This blog will cover the main elements of a content ecosystem. It will highlight the importance of building an ecosystem, its components, the steps to create an actionable ecosystem, and the benefits of a well-designed content ecosystem.
What is a content ecosystem?

A content ecosystem refers to how the publication of content fits into the broader context of an enterprise. It is a strategic network of interconnected content assets that work together to achieve a common goal such as increasing brand awareness to generating leads and sales.
A robust content ecosystem is built upon five critical pillars:
- Content strategy
- Governance
- Creation
- Distribution
- Analytics
These components work in harmony to ensure that content is not only created and shared across the right channels but also analyzed for effectiveness, allowing for data-driven decisions to refine the strategy and content offerings.
But where does a content ecosystem fit within broader content marketing and digital marketing strategies?
Content ecosystems enable businesses to create and distribute content to the right people at the right time. They are a critical component of broader content marketing and digital marketing strategies. Here's why:
- Strategic Integration: Content ecosystems integrate with broader marketing strategies, ensuring content reaches the right audience when it's most impactful.
- Holistic Framework: They offer a structured approach, mapping out how different content pieces interconnect and support each other.
- Streamlined Process: Ecosystems streamline content production, promoting efficiency and the reusability of content assets.
- Optimization: They ensure content is crafted for maximum relevance and engagement, ready for multi-channel distribution across diverse platforms, broadening reach and enhancing brand visibility.
- Lead Generation: Through high-quality content, ecosystems attract site visitors, generate leads, and help convert these leads into sales.
Why does your company or brand need a content ecosystem?
Joe Pulizzi, Founder of Content Marketing Institute, says "A content ecosystem is a living, breathing thing. It's not just a collection of content assets. It's a network of interconnected content that works together to achieve a common goal."
What are the core components of a content ecosystem?
The core components of any content ecosystem include:
- Content Types: This includes both core content like website pages, product descriptions, FAQs, and supplementary content such as blogs, whitepapers, ebooks, social media updates, videos, podcasts, and case studies. The diversity in content types serves various objectives, from customer acquisition and retention to establishing industry thought leadership.
- Content Governance: These are the policies, practices, and standards that oversee the development, management, and dissemination of digital content within an organization. It ensures content aligns with the brand's messaging, values, and legal requirements, and involves defining roles and responsibilities among content creators.
- Content Creation: This is the process of generating digital content across different formats, designed to appeal to the target audience and presented in an easily digestible manner.

Did you know that Pepper CMP's Pepper Docs comes with an inbuilt SEO Grader that analyzes your content and grades it? Furthermore, you can use AI Writer to leverage the power of generative AI to improve your content, check plagiarism and readability scores, optimize your content for the SERPs with the SEO Guidelines feature, and more.
- Content Distribution: It involves the strategic sharing of digital content through chosen platforms like websites, email newsletters, and social media channels, tailored to the audience's consumption preferences.
- Content Analytics: This aspect refers to the measurement of content's success, monitoring metrics like website traffic, engagement, and conversion rates to inform data-driven improvements in the content strategy.

For example, Pepper CMP's Content Analytics and ROI feature not only helps you track KPIs such as traffic, engagement rate, and session durations, but it also fetches the dollar value of your content with insights such as organic search traffic value and average cost per click (CPC) so you can always stay on top of your ROI game.
- Content Platforms: Content platforms such as CMS, marketing automation tools, and digital asset management systems are used to produce, curate, and manage content.
How should you establish your content ecosystem?
You need to establish your content ecosystem in a way that supports your goals. The following steps can help you establish a robust ecosystem:
Step 1: Define your goals and conduct content research
Before diving into content creation, it's important to define your goals and conduct thorough research. Answer questions like:
- What values and messages do you want to convey?

Pepper CMP's Content Idea lab, for example, is an excellent tool that will help you with a seamless content ideation process. You can discover keywords, get outline recommendations, generate topic suggestions, and more — all while keeping track of parameters such as search volume, intent, ranking difficulty, etc.
- Who is your target audience?
- What are your competitors doing in the content space?
This will help you understand your target audience, identify relevant keywords, and develop a content strategy that aligns with your business objectives.
Step 2: Develop a Content Strategy
A well-thought-out content strategy is the backbone of a successful content ecosystem. It involves planning the type of content you want to create, the platforms you want to utilize, and the goals you want to achieve. Your strategy should be tailored to your brand's unique needs and objectives.
.avif)
Step 3: Create High-Quality Content
Whether it's blog articles, social media posts, or videos, make sure your content is of high quality and value-driven. This means it should be informative, engaging, and visually appealing. When creating content:
- Understand your audience’s search intent, that is, whether navigational, educational, commercial, or transactional.

Here's an example of Pepper CMP's Discover Keywords feature that gives intent and other parameters before you select a few to find topics to get started with.
- Ensure proper formatting, thorough research, fact-checking, originality, and review your content before publishing.
- Invest in creating in-depth posts, which generate 9 times more leads than shorter content.
Step 4: Optimize for SEO
To ensure your content reaches a wider audience, it's important to optimize it for search engines. Conduct keyword research and incorporate relevant keywords naturally into your content. Additionally, focus on creating valuable and shareable content that others would want to link to.

For instance, Pepper CMP's SEO Writing Assistance equips you with all the necessary SEO guidelines such as keyword integration, content grade, readability score, and more to ensure your content is well optimized.
Step 5: Streamline your content marketing workflows
Managing your content marketing workflows is essential to ensure smooth operations. Streamline the processes involved and identify the stakeholders responsible for each task. This will help you maintain consistency and ensure timely delivery of content. Use collaboration tools like the Pepper Content Marketing Platform to organize your tasks into projects for better oversight of the content creation process.
Step 6: Distribute your content across appropriate channels
Once your content is created, it's time to distribute it across appropriate channels. Utilize various platforms such as social media and email marketing to reach your target audience. Tailor your distribution strategy based on the preferences of your audience.
Step 7: Promote Your Content
Creating great content is just the first step. To maximize its reach, you need to promote it effectively. Share your content on social media, reach out to influencers in your industry, and engage with your audience through comments and discussions. The more visibility your content gets, the stronger your content ecosystem becomes.
Step 8: Analyze and track performance to make data-driven adjustments
Lastly, use analytics tools to track the performance of your content. Monitor key metrics such as website traffic, engagement, and conversions. Analyze the data to identify areas for improvement and make data-driven adjustments to your content strategy.
Conclusion
Building a content ecosystem can be a recurring process, but it's worth the investment. By consistently creating and distributing high-quality content, you can achieve your business goals and build a strong and loyal customer base.
Remember, your content ecosystem is a reflection of your brand's voice and values. Invest in creating high-quality, relevant, and engaging content that resonates with your target audience, and you'll reap the rewards in the form of increased brand awareness, customer engagement, and business growth.
Looking for an all-in-one content marketing platform that helps businesses create, distribute, and manage their content? Pepper Content Marketing Platform is here to help!
This guide to creating a comprehensive content ecosystem is a guest post by our friends over at Pepper Content. Book a demo to learn more about Pepper content
.webp)
Leverage Engagement Scoring To Drive B2B Marketing Performance
Traditional metrics such as sourcing and influence metrics, while valuable, have their limitations, often leaving a gap in understanding accurate marketing performance.
This is where engagement scoring emerges as a game changer.
Engagement Scoring Unveiled
Engagement scoring is the systematic process of assessing and quantifying customer interactions with your brand. Engagement scoring goes beyond merely counting clicks or page views; it delves deep into the quality, timing, and relevance of these actions. These interactions encompass a broad spectrum, from ad views, web sessions, content downloads, email engagement, social media activity, event attendance, and more.
The Growing Significance of Engagement
The days of bombarding potential customers with generic messaging are long gone. In an era where buyers have a plethora of options and information at their fingertips, understanding their preferences, intent, and fitment is indispensable. Engagement scoring becomes the compass that guides you through this complex landscape.
Filling in the Gaps Left by Sourcing and Influence Metrics
Sourcing metrics primarily focus on quantifying the revenue that marketing has directly sourced. For example, sourcing metrics, such as win rates, deal sizes, and revenue lift, do not tell you anything about the lead's level of interest or intent.
Influence metrics, on the other hand, aim to measure the impact of marketing on the decision-making process of potential clients. Influence metrics, such as social media following and website traffic, can give you some indication of a lead's influence, but they do not tell you how engaged they are with your product or service.
These traditional metrics are often rooted in a binary understanding sourced or not sourced, influenced or not influenced.

Engagement scoring steps in to offer a more nuanced perspective. It recognizes that the buyer's journey is not linear but a complex web of interactions and engagements. Every click, download, or event attendance provides a piece of the puzzle. Instead of classifying potential clients into rigid categories, engagement scoring paints a dynamic picture that captures their level of interest, the stage in their decision-making process, and their responsiveness to marketing efforts. Moreover, engagement scoring can enhance your ability to focus marketing efforts on prospects who are most likely to convert, ultimately boosting conversion rates and ROI.
The Significance of Engagement in B2B Marketing
Picture the modern-day B2B business as a bustling marketplace. The traditional approach to B2B marketing can be likened to standing in this marketplace, megaphone in hand, and shouting generic messages to anyone who will listen. In the past, such an approach might have yielded some results, but the dynamics of B2B marketing have undergone a profound transformation.
Engagement scoring is the need of the hour, especially because it places buyers at the forefront of the strategy.
The Evolution of Buyer Behavior
Buyer behavior is no longer a linear journey. Gone are the days when prospects would embark on a clear, predictable path from awareness to consideration and finally, decision. Instead, today's B2B buyers navigate a labyrinth of choices, resources, and options. It's akin to a journey through a maze, where every turn presents new choices, challenges, and opportunities.

Buyers in the B2B space research extensively, gathering information from various sources, and often remain anonymous for longer periods. They interact with your brand, your competitors, and a lot of content across different platforms. In this convoluted landscape, their level of engagement with your brand becomes insightful.
The Power of Engagement in Driving Revenue Growth
By now, we understand that engagement isn't just a buzzword; it's an important strategy that determines marketing success. Engaged prospects and customers are those who have shown genuine interest in your offerings, interacted with your content, and actively participated in your marketing initiatives. They are the ones who click through your emails, download your resources, attend your webinars, and seek out your solutions.
But why does this matter?
Engaged prospects are more than just passive observers; they are active participants in their buying journey. They have moved beyond the initial stages of awareness and consideration and are now evaluating their options, inching closer to the decision phase. This readiness to engage signifies their receptiveness to your brand's messaging and an increased likelihood of conversion.
The Basics of Engagement Scoring
Now that we've established the role of engagement in B2B marketing, let’s dive into the mechanics of engagement scoring. This fundamental concept acts as the compass guiding your efforts in nurturing prospects and driving revenue growth.
At its core, engagement scoring is a method of assigning values to various interactions prospects and customers have with your brand. These values reflect the depth and significance of each engagement. By systematically calculating these scores, you gain insight into where a prospect stands in their journey and how to tailor your marketing strategies accordingly.
The Components of Engagement Scoring
- Interaction Tracking
Every action a prospect takes, from opening an email to downloading a resource, attending a webinar, or visiting your website, is considered an interaction. Each interaction carries its weight in the scoring system, with some being more indicative of intent and engagement than others.
- Scoring Rules
Your engagement scoring system is governed by a set of predefined rules. These rules dictate how many points are assigned to each type of interaction. For instance, opening an email might earn a prospect a few points, while attending a live product demonstration could carry a much higher score.
- Engagement Tiers
Engagement scoring often employs a tiered structure. Prospects start in the lower tiers, and as they accumulate more points, they progress upward. Each tier corresponds to a certain level of engagement and readiness to make a purchase.

Types of Engagement Metrics in Scoring
- Explicit Engagement Metrics
These metrics are based on direct actions taken by prospects. Examples include downloading a whitepaper, signing up for a newsletter, or requesting a demo. These actions indicate a clear interest in your offerings and are typically assigned higher scores.
- Implicit Engagement Metrics
These metrics gauge engagement without prospects taking direct actions. Metrics like email open rates, website visits, or social media interactions are implicit signals that suggest prospects are interested in your content and brand.
- Behavior-Based Metrics
Behavior-based metrics are more advanced and analyze the patterns and sequences of interactions. For example, if a prospect follows a specific sequence of webinars and downloads, it can signal a deeper level of engagement and intent.
Setting Up an Effective Engagement Scoring System
To harness the potential of engagement scoring, consider these best practices
1. Alignment with Buyer Journey
Tailor your engagement scoring system to align with your buyer's journey. Assign higher scores to interactions that typically indicate prospects are advancing through the stages of awareness, consideration, and decision-making.
2. Regular Review and Adjustment
Your scoring system isn't set in stone. Regularly review the rules and criteria. As prospect behavior evolves, ensure your scoring system evolves with it.
3. Collaboration Across Teams
Collaboration between your marketing and sales teams is crucial. Your sales team's insights can help fine-tune your scoring system to ensure it accurately reflects the prospects' readiness for a sales conversation.
4. Scoring Automation
Implement automation tools to streamline the scoring process. Many marketing automation platforms offer built-in engagement scoring capabilities that can simplify the task.
5. Progressive Profiling
Use progressive profiling to gather additional information about prospects as they engage more deeply. This enables more accurate scoring and customization of your nurturing strategies.
6. Data Privacy and Compliance
Be mindful of data privacy regulations when collecting and using prospect data for scoring. Ensure compliance with relevant laws and regulations.

Understanding the basics of engagement scoring is the first step in unlocking its potential. In the next part of this series, we'll explore advanced strategies and real-life examples of how engagement scoring can be a game changer in B2B marketing.
Let’s Understand with a Case Study Uni
Uni is a B2B SaaS company that provides a platform for businesses to manage their sales and collections pipeline. They were facing a challenge in identifying and prioritizing high-intent leads. They were using a traditional lead scoring model based on demographic data and website visits, but this was not giving them accurate results.
Uni decided to implement an engagement scoring model. They used a variety of data points to calculate their engagement score, including
- Number of page views
- Time spent on the website
- Number of downloads
- Free trial signups
- Email opens and clicks
- Product usage
Uni then used its engagement score to segment its leads and prioritize its sales efforts. They focused on reaching out to high-engagement leads first, and they offered them personalized outreach based on their interests and stage in the sales funnel.
As a result of implementing engagement scoring, Uni saw a 4X increase in customers and a significant increase in sales efficiency.
The Game-Changing Potential of Engagement Scoring
In the previous sections, we’ve understood the transformative power of engagement scoring in B2B marketing, we've covered the importance of engagement, its significance, and the core components of scoring. Now, let's explore how engagement scoring can truly revolutionize your marketing strategies and elevate your campaigns to new heights.
A Shift from Traditional Metrics
Engagement scoring represents a paradigm shift in the way we measure the effectiveness of marketing efforts. Traditional metrics like click-through rates, open rates, or the number of leads generated provide limited insights into prospect intent and readiness for a sales conversation. Engagement scoring, on the other hand, allows you to delve deeper into each prospect's journey and quantify their level of interest.
Benefits of Lead Prioritization
One of the game-changing aspects of engagement scoring is its ability to prioritize leads effectively. No longer will your sales team waste time chasing cold leads or prospects who are not yet ready to make a purchasing decision. With a well-structured scoring system, your sales team can focus their efforts on prospects who have demonstrated high levels of engagement and are more likely to convert.
Segmentation for Personalization
Effective engagement scoring enables advanced segmentation. By categorizing your prospects based on their scores, you can tailor your content and message to each group. For instance, highly engaged prospects can receive content that delves into the finer details of your offerings, while those in the early stages of engagement might receive introductory material. This level of personalization enhances the overall customer experience and drives better results.
Enhanced Content Targeting
Engagement scoring also amplifies your content-targeting efforts. You can precisely target prospects based on their scores, ensuring that they receive content that resonates with their level of interest and position in the buyer's journey. As prospects move up the engagement tiers, they receive increasingly relevant content, nurturing them towards a buying decision.
Conversion Rate Optimization
Scoring allows for more accurate lead nurturing and follow-up strategies. You can determine the most appropriate moment to transition a prospect from marketing to sales. By doing so, you increase the chances of converting high-scoring leads into paying customers, ultimately optimizing your conversion rates.
Real-Life Benefits of Engagement Scoring
To illustrate the real-life benefits of engagement scoring, consider the example of Company X, a B2B software provider. Company X implemented an engagement scoring system that factored in various interactions, from email opens to webinar attendance and document downloads. By prioritizing highly engaged leads, the sales team saw a significant increase in conversion rates. They were now speaking to prospects who were not only aware of the product but had also shown genuine interest. The result? A boost in revenue and shortened sales cycles.
In this age of data-driven marketing, engagement scoring stands out as a game changer, offering unparalleled insights into prospect behavior and intent. As we continue our exploration of engagement scoring in the next part of this series, we'll delve into advanced strategies for implementation and share more success stories from the B2B marketing landscape. Stay tuned for more insights on how engagement scoring can redefine your marketing efforts.
Implementing Engagement Scoring A Strategic Approach
Now that we've established the potential of engagement scoring to revolutionize your B2B marketing, it's time to roll up our sleeves and discuss how you can successfully implement this game-changing tool. In this section, we'll provide you with actionable strategies, recommendations, and tips for a smooth integration of engagement scoring into your marketing strategy.
1. Define Your Objectives and Goals
The first step in implementing engagement scoring is to clearly define your objectives. What do you aim to achieve with this system? Are you primarily looking to prioritize leads for the sales team, or do you want to improve personalization and content targeting? By setting specific goals, you can tailor your engagement scoring system to meet your unique needs effectively.
2. Choose the Right Engagement Metrics
Selecting the right engagement metrics is a critical step in implementing scoring effectively. While the choice of metrics depends on your specific business and goals, some metrics commonly used in engagement scoring include
- Email Interactions
Metrics as email opens, click-through rates, and response rates provide insights into a prospect's interest and responsiveness to your messages.
- Web Behavior
Monitor website visits, page views, and time spent on your site. Analyze which pages or content attract the most attention.
- Content Engagement
Track the consumption of your content, such as whitepapers, ebooks, and case studies. Determine which assets resonate most with your audience.
- Social Media Engagement
Evaluate interactions on your social media profiles, such as likes, shares, and comments. These actions indicate engagement with your brand.
- Event Participation
Measure engagement with webinars, seminars, and events. Attendance and participation reflect a prospect's willingness to invest time in your offerings.
3. Define Scoring Criteria
Once you've identified your goals and metrics, it's time to create a scoring system. Establish clear criteria for assigning scores to various interactions. Define how points will be awarded for each action and determine the threshold at which a lead is considered highly engaged. This step requires collaboration between your marketing and sales teams to ensure alignment on lead qualification.
4. Leverage Automation Tools
Effective engagement scoring often involves the processing of a large volume of data. To manage this efficiently, leverage marketing automation and customer relationship management (CRM) tools. These technologies can automate the tracking of prospect interactions and calculate scores in real time. Automation tools such as those we have at Factors, also allow for seamless integration with your sales team's workflow.
5. Monitor and Adjust
Engagement scoring is not a one-and-done process. It requires continuous monitoring and adjustment. Regularly review your scoring criteria and metrics to ensure they remain aligned with your goals and reflect the changing behavior of your prospects. The flexibility to make real-time adjustments is one of the advantages of an automated scoring system.
Overcoming Common Challenges
As with any new strategy, engagement scoring may present challenges. Here's how to address some common ones
- Data Accuracy
Ensure data accuracy by regularly cleaning your contact database. Implement data validation tools to minimize errors.
- Scalability
As your marketing efforts grow, you'll need to scale your engagement scoring system. Regularly review and update your scoring model to accommodate new metrics and actions.
- Sales Alignment
Collaboration between marketing and sales is crucial. Hold regular meetings to align strategies and ensure a smooth lead handover process.
- Data Privacy Compliance
Be aware of data privacy regulations like GDPR or CCPA. Ensure that your engagement scoring practices are compliant.
- Scoring Model Complexity
Keep your scoring model simple and easy to understand. Complex models may confuse teams and hinder adoption.
Implementing engagement scoring successfully requires a well-defined strategy, the right metrics, and a commitment to overcoming challenges. By aligning your efforts with your business objectives and prospect behaviors, you can harness the full game-changing potential of engagement scoring in B2B marketing.
Unlocking Business Potential with Engagement Scoring
Prioritization and Personalization
One of the central benefits of engagement scoring is its role in lead prioritization. No longer do you need to guess which leads are most likely to convert; the data guides your decision-making process. This results in more effective lead nurturing and a streamlined handover to the sales team. Additionally, engagement scoring enables the personalization of content and messaging, enhancing the prospect's experience and boosting your chances of success.
Embracing the Change
Now, more than ever, marketing professionals, CMOs, and CXOs need to adapt and innovate. The dynamic B2B marketing landscape demands a shift towards more data-driven, personalized, and effective strategies. Engagement scoring is not just a tool; it's a mindset that can set your marketing efforts apart.
Explore and Implement
All in all, the future of B2B marketing is about understanding your audience on a deeper level, using data to drive strategies, and elevating your marketing game. Engagement scoring is your key to unlocking this potential. By doing so, you'll not only stay ahead of the competition but also lead the way in this ever-evolving marketing landscape. It's time to redefine your marketing playbook and harness the game-changing power of engagement scoring.
Onward to a brighter, more engaging future!
.webp)
Going Beyond Status Quo Marketing Measurement Metrics
Introduction to Sourcing and Influence Metrics
Performance measurement is a dynamic and multifaceted challenge. Across different companies, there exists a wide variation in how marketing's effectiveness and impact are evaluated. This diversity stems from the complexity of modern marketing strategies and the evolving landscape of the business-to-business domain.
Two common techniques for measuring marketing performance at an executive level are Marketing Sourcing Metrics and Marketing Influence Metrics. Both techniques aim to provide insights into how marketing initiatives contribute to business outcomes, yet they do so from distinct angles. Understanding the nuances of sourcing and influence metrics is essential in the pursuit of an accurate and comprehensive understanding of marketing impact.
So, let’s dive right in!
Sourcing Metrics: Rooted in Inbound Marketing History
Sourcing metrics, often associated with the emergence of inbound marketing, focus on measuring how much business was originally sourced by marketing efforts. In essence, they track the leads and opportunities that marketing directly generates. This metric is crucial for quantifying the immediate impact of marketing initiatives on lead generation, a vital aspect of B2B marketing.
Influence Metrics: A Staple of Marketing Practice
Influence metrics, on the other hand, have been around as long as marketing itself. They aim to gauge how much business is influenced or impacted by marketing activities. While sourcing metrics focus on the origin of leads, influence metrics delve into how marketing contributes to the customer journey and decision-making process. These metrics are tracked over a longer period of time, capturing the enduring influence of marketing on potential clients and business development.
The Ongoing Symbiosis of Marketing and Sales
Historically, marketing has enabled sales. It creates awareness, generates leads, and nurtures prospects to the point where the sales team can engage and convert deals effectively. Yet, marketing's role doesn't end there; it extends well into the customer journey, ensuring that the customer's experience aligns with the brand's promise.
So, are they same-same but different?
Marketing and sales differ significantly when it comes to measuring performance. Sales activities are usually more quantifiable, making it relatively straightforward to measure their contribution. In contrast, marketing's influence may not always be easily quantifiable, as it encompasses a wider array of touchpoints throughout the customer journey.
In the C-level meetings at the executive level, where strategic decisions are made, understanding marketing's impact is pivotal. C-level executives seek to evaluate marketing's performance to assess its alignment with overall business goals, determine resource allocation, and make informed decisions. This assessment often revolves around sourcing and influence metrics, as they provide valuable insights into marketing's direct and indirect contributions to business growth.
Marketing's influence is evident in the numbers that matter most to an organization: revenue, customer acquisition, and brand reputation. To translate marketing's influence into measurable impact, sourcing and influence metrics have been serving as tools for the modern marketing professional.
But are these two tools enough?
In the next sections, we will understand both tools in more detail, explore their limitations and propose new strategies that can help marketing professionals move beyond the current status quo of marketing measurement metrics and achieve a more accurate reflection of their impact on business success.
The Role of Sourcing Metrics in B2B Marketing
Traditionally, sourcing metrics are harnessed to evaluate the immediate and tangible outcomes of marketing efforts. B2B marketing strategies often involve content marketing, advertising campaigns, email marketing, and social media engagement. These activities are strategically designed to draw the attention of potential clients and encourage them to take specific actions, such as signing up for a newsletter, downloading a whitepaper, or requesting a product demonstration.
Sourcing metrics come into play by measuring the efficacy of these marketing tactics. They help determine how many leads and opportunities are sourced directly from these campaigns, providing marketing professionals with a clear and quantifiable understanding of their impact on lead generation.
The metrics often encompass:
- Lead Generation: The number of leads generated through marketing initiatives.
- Conversion Rate: The percentage of leads that successfully convert into opportunities.
- Customer Acquisition Cost (CAC): The cost incurred to acquire a new customer.
- Return on Investment (ROI): The return generated for each marketing dollar spent.
Limitations of Sourcing Metrics
While sourcing metrics offer valuable insights into the immediate impact of marketing initiatives, they have inherent limitations when used in isolation. These limitations can hinder a comprehensive understanding of marketing performance, particularly when it comes to B2B marketing.
1. Short-term focus
Sourcing metrics primarily reflect short-term results. They capture leads generated and conversions made but may not account for the enduring impact of marketing on the customer's journey. In B2B marketing, where sales cycles are often longer, an overemphasis on sourcing metrics might lead to an incomplete assessment.
2. Overlooking Influence
Sourcing metrics tend to downplay the broader influence of marketing on potential clients. They focus on quantifying the immediate lead generation but may not capture the touchpoints that influence a prospect's decision-making process over time. This omission results in a less comprehensive understanding of marketing's contribution.
3. Neglecting Brand Building
Sourcing metrics often does not adequately account for brand-building efforts, which are fundamental in the B2B landscape. Building a strong brand presence influences prospects even before they become leads. This early-stage brand awareness might not be fully reflected in sourcing metrics.
The Need for a Holistic Approach
The limitations of sourcing metrics become increasingly evident when considering the complexity of the B2B marketing environment. B2B deals often involve intricate decision-making processes, extended sales cycles, and multiple stakeholders. These factors necessitate a holistic approach to marketing measurement that goes beyond sourcing metrics.
Case Study: Why are sourcing metrics insufficient?
Case Study
HP Inc. is a multinational information technology company that specializes in personal computing and related products. In the past, HP used sourcing metrics to measure the effectiveness of its marketing campaigns. These metrics included the number of leads generated, the number of opportunities created, and the number of sales closed.
However, HP realized that these metrics were not a true reflection of the success of its marketing campaigns. For example, a campaign might generate a large number of leads, but only a few of those leads might actually be qualified or converted into sales.
HP also realized that its marketing campaigns were not aligned with its overall business goals. For example, HP might be running a campaign to generate leads for a new product, but its sales team might not be ready to sell that product yet.
Solution
- HP decided to shift its focus from sourcing metrics to customer-centric metrics. Customer-centric metrics measure the impact of marketing campaigns on customer engagement, satisfaction, and loyalty.
- HP began tracking customer metrics such as the number of website visits, the number of social media interactions, and the number of customer inquiries. HP also began tracking customer satisfaction and loyalty through surveys and other forms of feedback.
- By focusing on customer-centric metrics, HP was able to create more effective marketing campaigns that were aligned with its overall business goals.
In a nutshell:
HP's case study shows that sourcing metrics can be a flawed way to measure the effectiveness of marketing campaigns. Companies should focus on customer-centric metrics instead, as these metrics provide a more accurate reflection of the impact of marketing on the business.

Influence Metrics in B2B Marketing
From the above section, it's clear that sourcing metrics, while valuable, do not provide a complete picture of marketing performance. Now, let’s delve deeper into the realm of influence metrics and explore how they contribute to a more comprehensive understanding of marketing performance in B2B.
Why did organizations shift to influence metrics?
The transition from solely relying on sourcing metrics to incorporating influence metrics in B2B marketing is driven by the need for a more comprehensive view of marketing's role. Compared to sourcing metrics, influence metrics offer a more complete understanding of how marketing initiatives influence decision-making throughout the entire customer journey.
The shift towards influence metrics was further motivated by the following factors:
1. Prolonged Decision-Making
B2B sales cycles are often protracted, spanning several months or even years. During this time, potential clients interact with various marketing touchpoints, each of which contributes to their eventual decision. Influence metrics enable marketers to track and evaluate these extended interactions, which sourcing metrics might overlook.
2. Multichannel Engagement
In today's digital age, prospects engage with marketing content across multiple channels. They might receive emails, browse a company's website, attend webinars, and interact on social media. Influence metrics provide a holistic perspective by accounting for the impact of each of these channels, recognizing their cumulative influence on decision-making.
3. Multiple Stakeholders
B2B purchases often involve multiple stakeholders within an organization. Influence metrics consider the influence of marketing efforts on various decision-makers, acknowledging the diverse touchpoints that cater to each stakeholder's needs.
Limitations of Influence Metrics
While influence metrics offer valuable insights into the broader impact of marketing in the B2B arena, they also have their set of limitations. Acknowledging these limitations is essential for gaining a more realistic view of marketing performance.
1. Difficulty in Quantifying Influence
Influence metrics, by nature, deal with qualitative data and soft measurements. They can provide insight into the impact of marketing efforts but may not be as easily quantifiable as sourcing metrics. This makes it challenging to attribute a specific monetary value to influence.
2. Data Complexity
These metrics often involve tracking a multitude of touchpoints and interactions across diverse channels. Managing and analyzing this vast amount of data can become complex, requiring sophisticated tools and methodologies.
3. Synchronizing with Sales Data
Aligning influence metrics with sales data can be challenging. Unlike sourcing metrics, influence metrics may not directly correlate with short-term sales figures. This can lead to discrepancies when trying to measure marketing's contribution in terms of revenue generation.
The Need for Balance
As B2B marketing continues to evolve, the consensus is clear: reliance solely on sourcing metrics or influence metrics might not provide a complete picture of marketing performance.
Now that we’ve understood sourcing metrics and influence metrics, it’s clear that both have their roles and strengths. However, the most insightful evaluation emerges when they are used together, along with other metrics that set off their disadvantages, respectively.
Relying solely on one or the other can lead to an incomplete picture of marketing performance. It's not an "either-or" scenario; it's a "both-and" strategy that paints a more comprehensive canvas of marketing's influence.
So, what’s the way forward?
Acknowledging the above limitations has paved the way for exploring alternative approaches to marketing measurement: Engagement Scoring.
Exploring Engagement Scoring
One promising alternative on the horizon is engagement scoring. Unlike sourcing and influence metrics, which primarily focus on lead generation and the influence of marketing touchpoints, engagement scoring takes a different route. It prioritizes measuring how engaged and receptive your audience is to your marketing efforts.
Engagement scoring considers a spectrum of interactions, such as content consumption, participation in webinars, social media engagement, and email responses. It doesn't just stop at identifying whether a prospect is interested in your product; it delves deeper into how engaged they are and what specific content or interactions resonate with them.
For a more in-depth exploration of engagement scoring, stay tuned for our next blog, where we will dissect this emerging approach and its application in modern B2B marketing measurement.
Moving Towards a New Approach
From the above sections, one thing has become abundantly clear: B2B marketing is in a state of constant evolution.
The limitations of the existing techniques have set us on a quest for a more holistic and encompassing approach. It's a journey that's far from over, and it's a journey that demands adaptability and innovation.
Embracing a data-driven approach is the cornerstone of effective marketing performance measurement. Data is the lifeblood of modern marketing, and by harnessing the insights from sourcing metrics, influence metrics, and engagement scoring, we can fine-tune our strategies and maximize our impact.
The path to optimizing marketing measurement is a dynamic one, where change is the only constant. And as you can tell, the world of B2B marketing is ever-evolving, and so must be our approach to measurement. It's not a destination but an ongoing journey.
So, as we move forward, let's leverage the full potential of sourcing metrics and marketing influence, all while remaining receptive to emerging approaches that enhance the art and science of B2B marketing. By doing so, we not only meet the challenges of today but also prepare for the exciting opportunities of the future.
.webp)
Amplitude vs. Heap: How to Pick the Best Web Analytics Tool?
Amplitude has been around since 2012 and has thus been a pioneer in the product analytics market. Its biggest selling point is that it allows companies to track user flows and journeys. It is also easy to use, so any employee can easily note the behavioral patterns of a company’s website users.
Heap is also a similar tool to Amplitude. However, the major advantage of Heap is that it can readily capture user actions through automatic event tracking. It allows for a better understanding of user behavior without a dedicated understanding of background coding for companies. This article helps you decide which tool is better in aiding your company to achieve its goals for growth.
tl;dr
- Amplitude is allowing data leaders to experiment with their data through a product called Amplitude Experiment.
- Amplitude provides granular user segmentation and greater event tracking flexibility compared to Heap.
- ContentSquare, a leading digital market analytics company, signed a contract to acquire Heap in September 2023.
- Heap has notable attributes such as a user-friendly interface and automatic event tracking that allow for easy and quick implementations, making it attractive to many B2B companies.
In this article, you’ll find out whether Amplitude–with its personalization capabilities–is the better option for your company compared to Heap, which is much more user-friendly.
CRM integrations
All B2B companies use CRM tools, so it’s necessary that your company’s operating web analytics tools also integrate with the CRM tools you’re used to. These integrations allow you to have all the necessary data in one platform so that you can work seamlessly. CRM integrations offer cross-collaborations that increase the scalability of your processes and make client work much more methodical.
Amplitude’s notable CRM integrations include Customer.io and Salesforce. Heap has more integrations; in addition to Salesforce, it also integrates seamlessly with Hubspot and Zendesk.
Third-party integrations
B2B companies use a variety of third-party tools for email marketing, e-commerce, and marketing. It’s essential that your web analytics tool integrates with all these tools in order to pull data from them as required.
Amplitude’s third-party integrations include:
- Extole
- Facebook Ads
- Apptimize
- Slack
- Segment
- Optimizely
Heap’s integration offerings are sizable, and comprise:
- Zapier
- Braze
- Cordial
- Shopify
- Mailchimp
- Marketo
Pricing
Amplitude’s pricing model isn’t transparent, but it does have a basic free version with which your company can enjoy many of its features. In the free plan, you can access data planning tools core analytic charts. However, if you want much more specific information–such as behavioral reports or analytics–then the shift from the free plan to the growth plan is quite steep, starting at $995/month. The Enterprise plan is for data-led businesses that require much more detailed insights and begins at $2000/month for companies that require it.

Heap has four pricing plans: Free, Growth, Pro and Premier. The free plan encompasses up to 10K monthly sessions. Similar to Amplitude’s basic plan, it also provides core analytic charts. Heap’s Growth plan is quite inexpensive compared to Amplitude’s. It starts at roughly about $3600/Year or $300/Month, making it much more accessible to small businesses wishing to scale. Heap does not offer transparent pricing for its Pro and Premier plans, and instead charge per session. Overall, Heap seems to have more cost flexibility in its pricing models simply because there are more models available.

Ease of installation
Both Amplitude and Heap don’t require you to install anything on your desktop. If you want to set up Amplitude or Heap, all you have to do is go to their respective websites and sign up for the plan you want.
In Amplitude, once you have signed up and chosen a plan, you can then login and access the dashboard. To use Amplitude effectively, you must add Amplitude’s tracking code and install the SDK to the codebase. You also have to set up tracking within the app so that it can gather the data as per your requirements. Heap also follows the same procedures; the two analytics tools are quite similar in this aspect.

Event tracking
Event tracking is among the most important features that most companies use web analytics tools for. Both Amplitude and Heap allow your company to track events. However, the advantages that they serve are different. Amplitude is more flexible and provides easily customizable event tracking. Your company has a lot to gain from custom event tracking as it captures unique customer actions that help detail more specific date insights.
Heap, on the other hand, records everything from the moment that you start using it for your website. This feature is termed Automatic Event Tracking, which records everything without coding or any manual code tagging. It can also collect historical data from the past, leading users to analyze data from the past without any extra tracking. However, users also claim that it’s difficult to set up an event correctly, and matching it to the coding can be complicated.

Data privacy
Data privacy and protection are of utmost importance for users and companies alike. Therefore, data collection has become an extremely complicated landmine that companies have to navigate around and Amplitude is no different. However, Amplitude has had quite a responsible stance on data privacy and protection since 2018 when the GDPR was passed.
The company has made updates so that it may fall in line with the General Data Protection Act, including product updates such as single and bulk user data deletion which allows users to delete all their data from the platform. The Email Monitoring update lets users track their request so deletion is successful. The company is also ISO 27001-certified for secured governance.
Heap has privacy built into its design. The company states that its focus remains on creating a tool that aligns with data privacy. Still, to comply with GDPR, Heap has taken the following steps:
- Third-Party Audits: These audits helped the company conduct any gap analysis regarding their GDPR readiness.
- Data Protection Act: The company has rewritten its Data Protection Act to comply with data subject rights.
How Can You Pick the Best Web Analytics Tool?
Web Analytics tools are instrumental in helping you understand user demographics and tracking customer activity. Hence, it’s necessary to pick a tool that’s reliable and trustworthy. You can judge how well your web analytics tool will perform by considering the following factors:
1. Business Objectives
Every business has its own objectives; knowing these can help you better manage your company’s expectations and outcomes.
2. Pricing
We have mentioned this before, but you should pick a web analytics tool that is sustainable as per your business model. Be aware of the hidden fees and growth fees that you will have to pay so you can budget accordingly.
3. Data Privacy Compliance
Data Protection Laws protect clients and companies alike. You should opt for tools that follow these laws. Using a tool that is GDPR-compliant informs your customers that your company is conscious regarding data collection and security.
4. User Interface and Visualization
There’s no point in web analytics tools that lend more complications to your company’s data. Pick a tool that is easy to use and has dashboards for immediate data visualization. Data visualization simplifies data so non-technical personnel can also understand it.

5. Run Trials
If the web analytics tools you’re opting for have the option for a free demo, opt for it and notice how your workflow changes. Make sure you have metrics in place for these trials so they are effective.
Deciding on a Web Analytics Tool
Choosing the right web analytics tool changes your workflow for the better and generates actionable insights that you can implement to grow your business exponentially. While no tool can be perfect, Factors is a comprehensive analytics and attribution tool that offers you:
- Marketing impact measurement
- Conversion rate optimization
- Granular visibility
- Funnel conversion optimization
- Customer journey analysis
- Points of inflection identification for B2B sales
- AI-automated Insights
- Account level timelines
- Tailor-made reports and data visualization
If you’re looking for ways to get more out of your company, then Factors provides some of the best marketing solutions for a B2B SaaS venture.
Customers using Factors testify to its reliability. It has a 4.7 out of 5 score on G2. Companies that have worked with Factors have seen an uncovering of 64% of the anonymous companies on their websites, which has helped them close more than 20,000 deals. All in all, client satisfaction for Factors’ services is high.

For more information or to set up a demo, contact the Factors’ team today and learn how to utilize the tool to fulfill your company’s objectives. Not sure about Factors? Sign up for a free trial and decide if Factors is the best option for your company.
Pixel vs Account-based LinkedIn Retargeting
B2B marketing teams invest significantly across campaigns and content to drive qualified website traffic. However, benchmarks find that only about 2% of this traffic actually converts, with the majority of visitors simply bouncing off or browsing anonymously on the website.
Retargeting the remaining 98% of visitors via LinkedIn has proved to be an effective strategy to recapture interest from anonymous website traffic. While we won’t cover the specific benefits of LinkedIn retargeting here, this case study summarizes how Sage successfully leveraged LI retargeting to:
- Generate 700,000 impressions in 6 weeks
- Improve lead generation by 4x
- And reduce cost-per-lead (CPL) by 80%
Simply put, LinkedIn retargeting works.
LinkedIn retargeting relies on the LinkedIn Insight tag (aka LinkedIn Pixel) to match website visitors with LinkedIn audiences.
The LinkedIn insight tag is a simple piece of code placed on a website to help optimize campaigns. While the LinkedIn Pixel serves many functions, including conversion tracking and demographic insights, it’s challenged by shortcomings around website retargeting.
While LinkedIn Pixel works to some extent, we have found an alternate approach that can take your retargeting campaigns to the next level, also known as account-based retargeting. Account-based retargeting works by identifying, qualifying, and targeting anonymous accounts, as opposed to individual users visiting a website. Using a combination of identifiers, account-based retargeting has been shown to deliver:
- Larger, account-level audiences
- Improved match rate accuracy
- Better segmentation and targeting
And the results? Well, they speak for themselves:
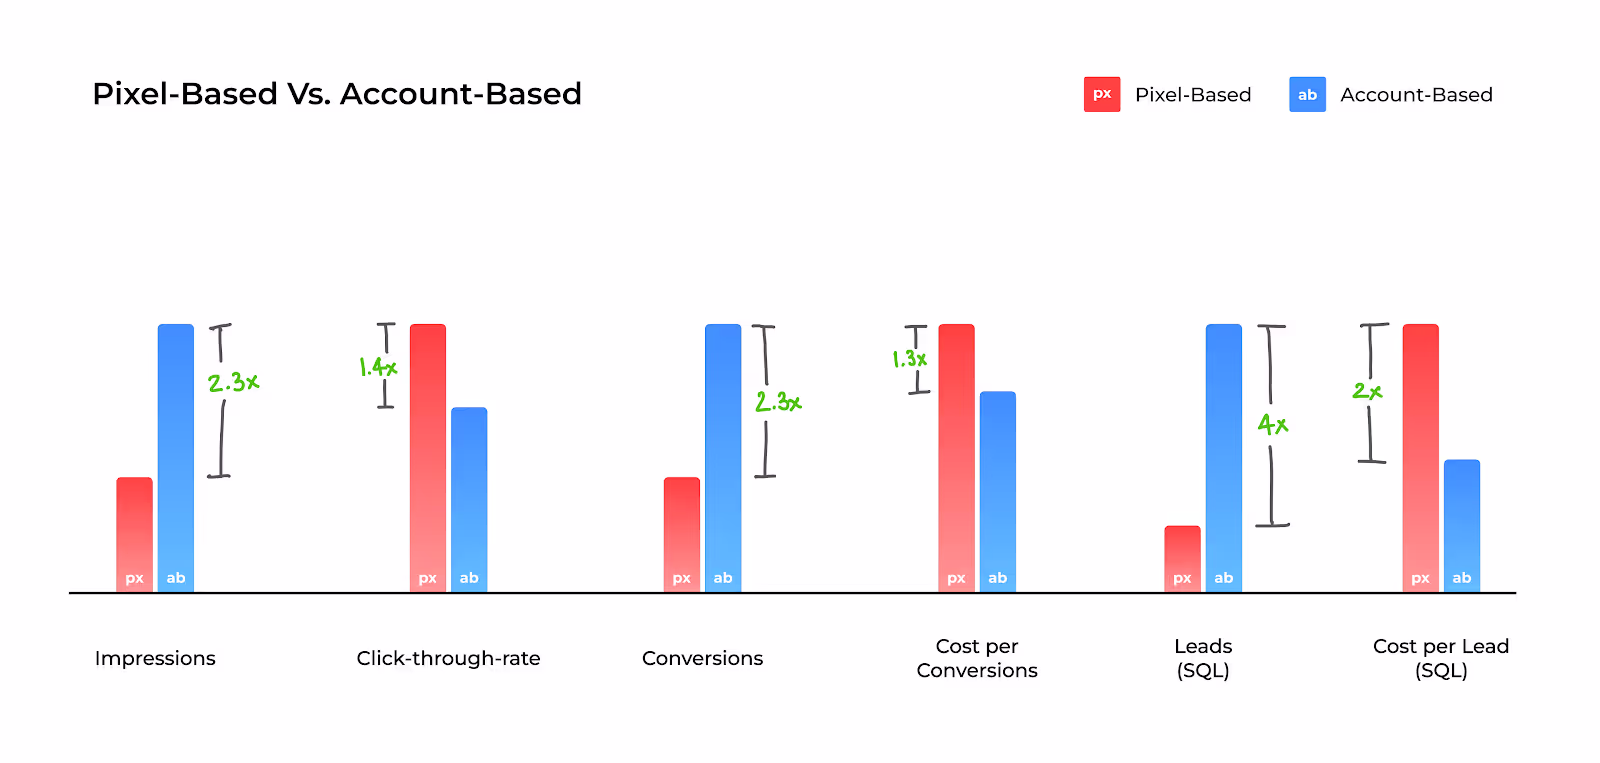
While the LinkedIn Pixel is a must-have solution given its wider functionality, we explore the limitations of Pixel-based retargeting and why Account-based retargeting is an effective alternative ⬇️
Limitation #1 - Match rates
The LinkedIn Pixel works by placing a cookie in visitors’ browsers, so when a LinkedIn user lands on your website, they may be identified and retargeted on LinkedIn. Note that this cookie-based identification takes place at a device and browser level for individual users. This means that, for the Pixel to match a website visitor to a LinkedIn user, the visitor must meet all 4 of the following criteria:
- Be an active member of LinkedIn
- Explicitly accept cookies on the website
- Use the same device (phone/laptop/tablet) to visit the website and LinkedIn
- Use the same browser (chrome/firefox/safari) to visit the website and LinkedIn
While a few visitors will probably fit this criteria, audience match rates via the Pixel are limited by the fact that the majority of traffic either doesn’t use LinkedIn, rejects cookies, or, most commonly, uses different devices/browsers for product research and LinkedIn browsing.
In fact, only about 42% of B2B product research involves mobile touch points — with the majority of B2B buyers choosing to conduct their research on desktops. On the other hand, a whopping 80% of LinkedIn engagement is via mobile. This is not surprising, given that LinkedIn is primarily a social networking app.
And so, despite the fact that LinkedIn Pixel works as designed, its match rates tend to be relatively poor, given the practical realities of B2B user behavior.
The limitation: Low match rates as a result of limited, cookie-based matching mechanisms by the LinkedIn Pixel.
How Account-based Retargeting helps
The LinkedIn Pixel relies exclusively on cookie-based tracking to create its matched audiences. Factors, on the other hand, leverages a combination of three identifiers — IP address, advertising ID, and cookies, to triangulate a data connection and match anonymous traffic to a company.
Factors connects with over 4.2B+ IP addresses and 65M+ company profiles (in addition to cookies and ad IDs) to accurately identify which accounts are visiting your website. Note that this is regardless of whether the visitor in question is a member of LinkedIn, uses different browsers, etc.
In fact, Factors can also identify remote companies by initially cookie-ing people using their corporate IP address to then re-identify them when they work remotely. To further explain how Factors achieves industry-leading match rates, here’s Viral from 6sense, one of our data partners:
“As a person moves around, their IP address changes. The platform adjusts for these changes by pulling in several additional markers to help match signals to an account. Now, with more variations in IP address data as remote working spreads across industries, our Graph deploys available secondary marker information, like cookies and mobile advertising IDs, to triangulate data connections. The Graph uses additional markers to sift through the noise so that confidence in the match rate remains consistent. Given the amount of signals we track, we don’t map every signal all the time, but we have observed accuracy over 85%.”
- CTO Viral Bajaria, 6sense, Data Partners
💡Build Better LinkedIn Retargeting Audiences with Factors
Limitation #2 - User-level targeting
B2B buying decisions are rarely made by a single person. The typical buying committee comprises almost a dozen people from multiple departments and time zones. Selling a SaaS product today might involve gaining buy-in from multiple C-suite executives, individual stakeholders from operations to sales to marketing, and a chief revenue officer – along with legal and implementation teams.
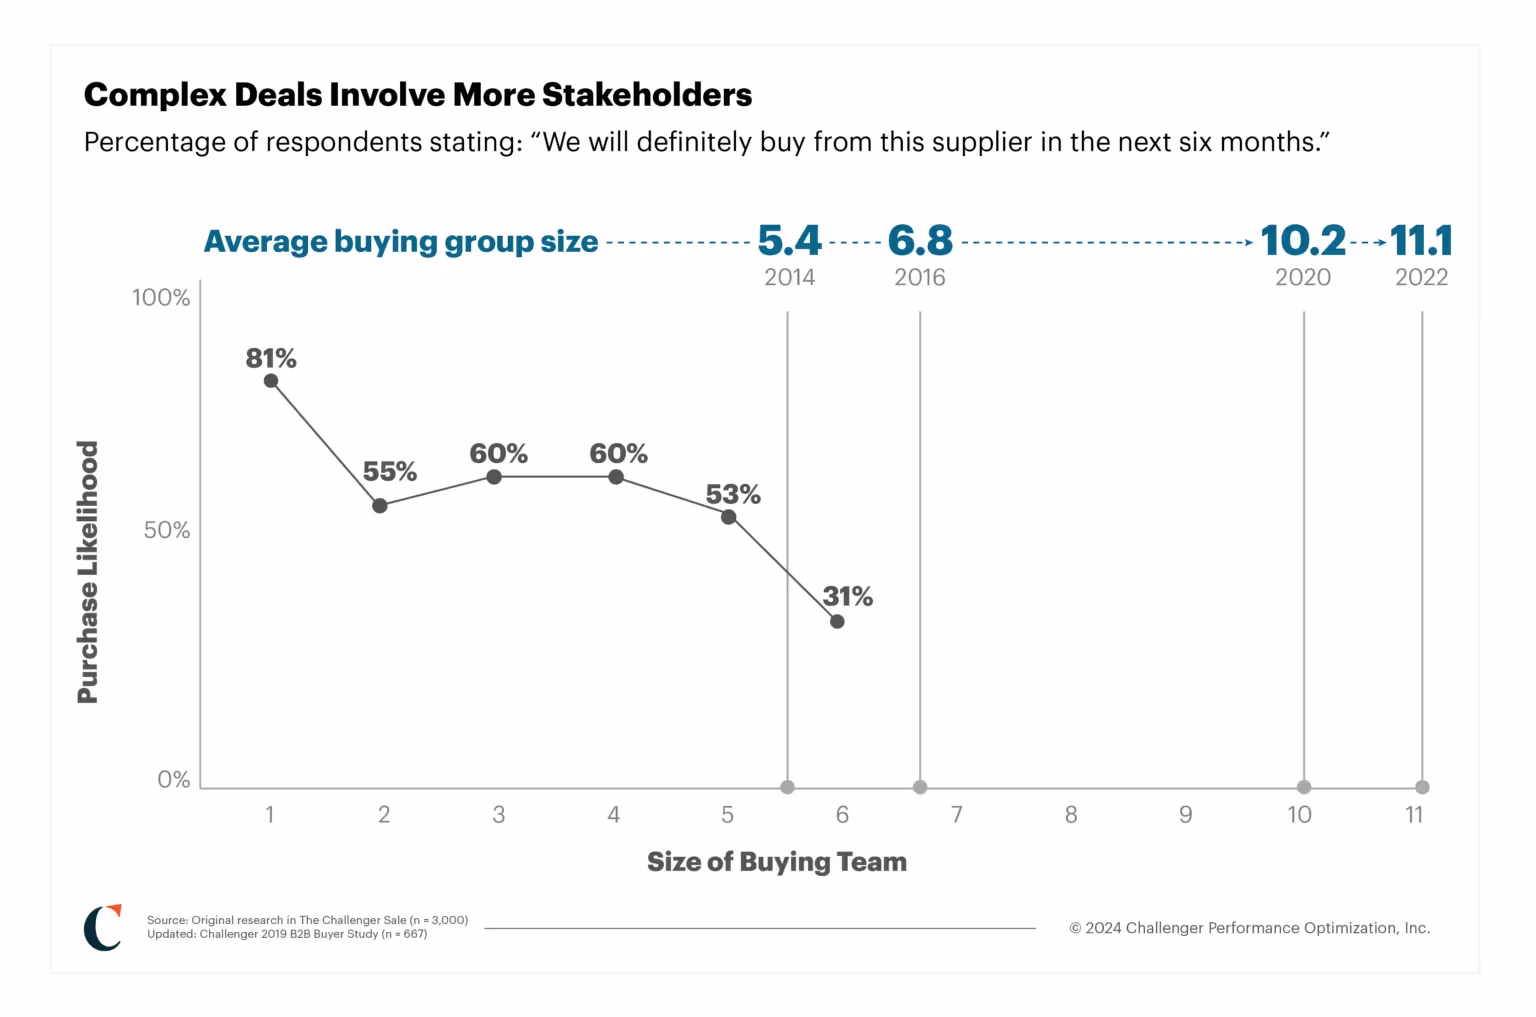
Source: Challenger
Given that the Pixel focuses on individual, single users visiting your website, it fails to capture the wider buying group from each account those users are from. This shrinks your total matched audience size considerably, but more importantly, it inhibits your marketing efforts from reaching key stakeholders and decision-makers who may not have been the ones visiting your site.
For example, if a junior marketer visits Factors.ai and is retargeted by the LinkedIn Pixel, the junior marketer alone will receive ads — with other stakeholders from the target account being ignored. As a result, this approach relies on the junior marketer being independently influential enough to convince the rest of the team to move forward with the deal. Definitely a tough sell.
The limitation: User-level targeting, as opposed to account-level targeting, results in fewer stakeholders targeted per account and smaller audience sizes.
How Account-based Retargeting Helps
While LinkedIn is best for targeting buying groups, it’s important to remember that there is no initial intent to buy on a social media platform. You need to layer in intent signals from multiple sources, such as your website and review sites like G2, to understand how you can best retarget relevant accounts.
Factors identifies intent signals and re-targets anonymous website traffic at an account level. This means that multiple decision-makers and stakeholders from the same company will be targeted on LinkedIn, regardless of which user actually visits the website. This bodes well for multiple reasons:
- Increases audience size without compromising on the quality of accounts
- Creates brand awareness at a company level rather than at an individual level
- Improves odds of targeting the right decision-makers within each account
Even assuming that account-based targeting finds the same 100 accounts as Pixel-based targeting, the former would generate an audience size of 300-500 users (3-5 people from each account), while Pixel-based targeting would only target 100 users (1 from each account). More importantly, a larger audience will improve the odds of targeting decision-makers, ultimately resulting in more leads and conversions. Accordingly, account-based retargeting solves for the practical limitation of LinkedIn campaigns struggling to scale due to poor audience size.
Limitation #3 - Audience segmentation
The previous two points discussed the LinkedIn Pixel’s limitations in terms of audience quantity. This third limitation highlights why the Pixel tends to fall short in terms of audience quality. In reality, a significant portion of your website traffic wouldn’t make a good fit for your business. Even within the subset of ICP accounts visiting your website, only a fraction would be “sales-ready” at any given moment (with the remaining accounts having to be nurtured until they’re prepared to buy).
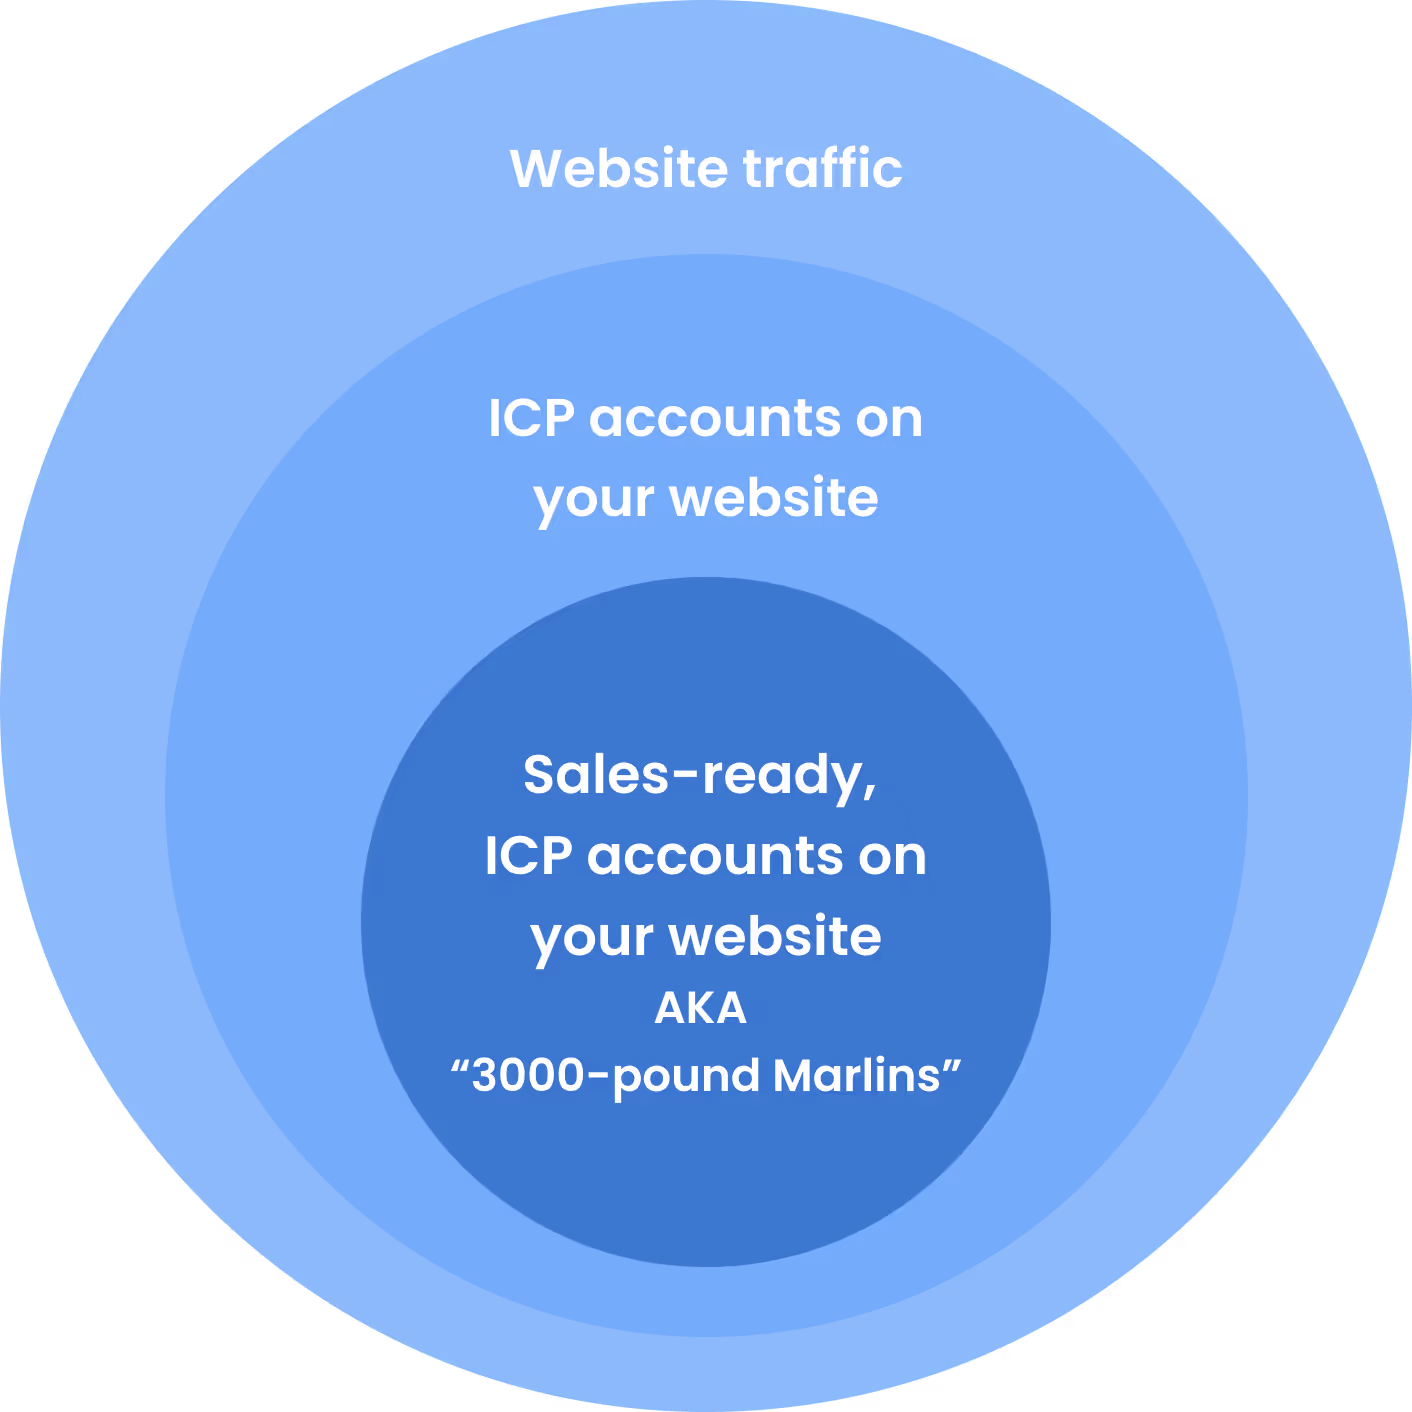
As important as having a large audience is, the quality of this audience plays a key role in determining conversions and RoAS as well. In an ideal scenario, marketing teams should only retarget this subset of sales-ready “3000-pound marlin” accounts.

The LinkedIn Pixel limits audience segmentation based on intent and engagement. With the Pixel, website traffic can only be segmented based on page views. While this is definitely a good starting point, it lacks granularity.
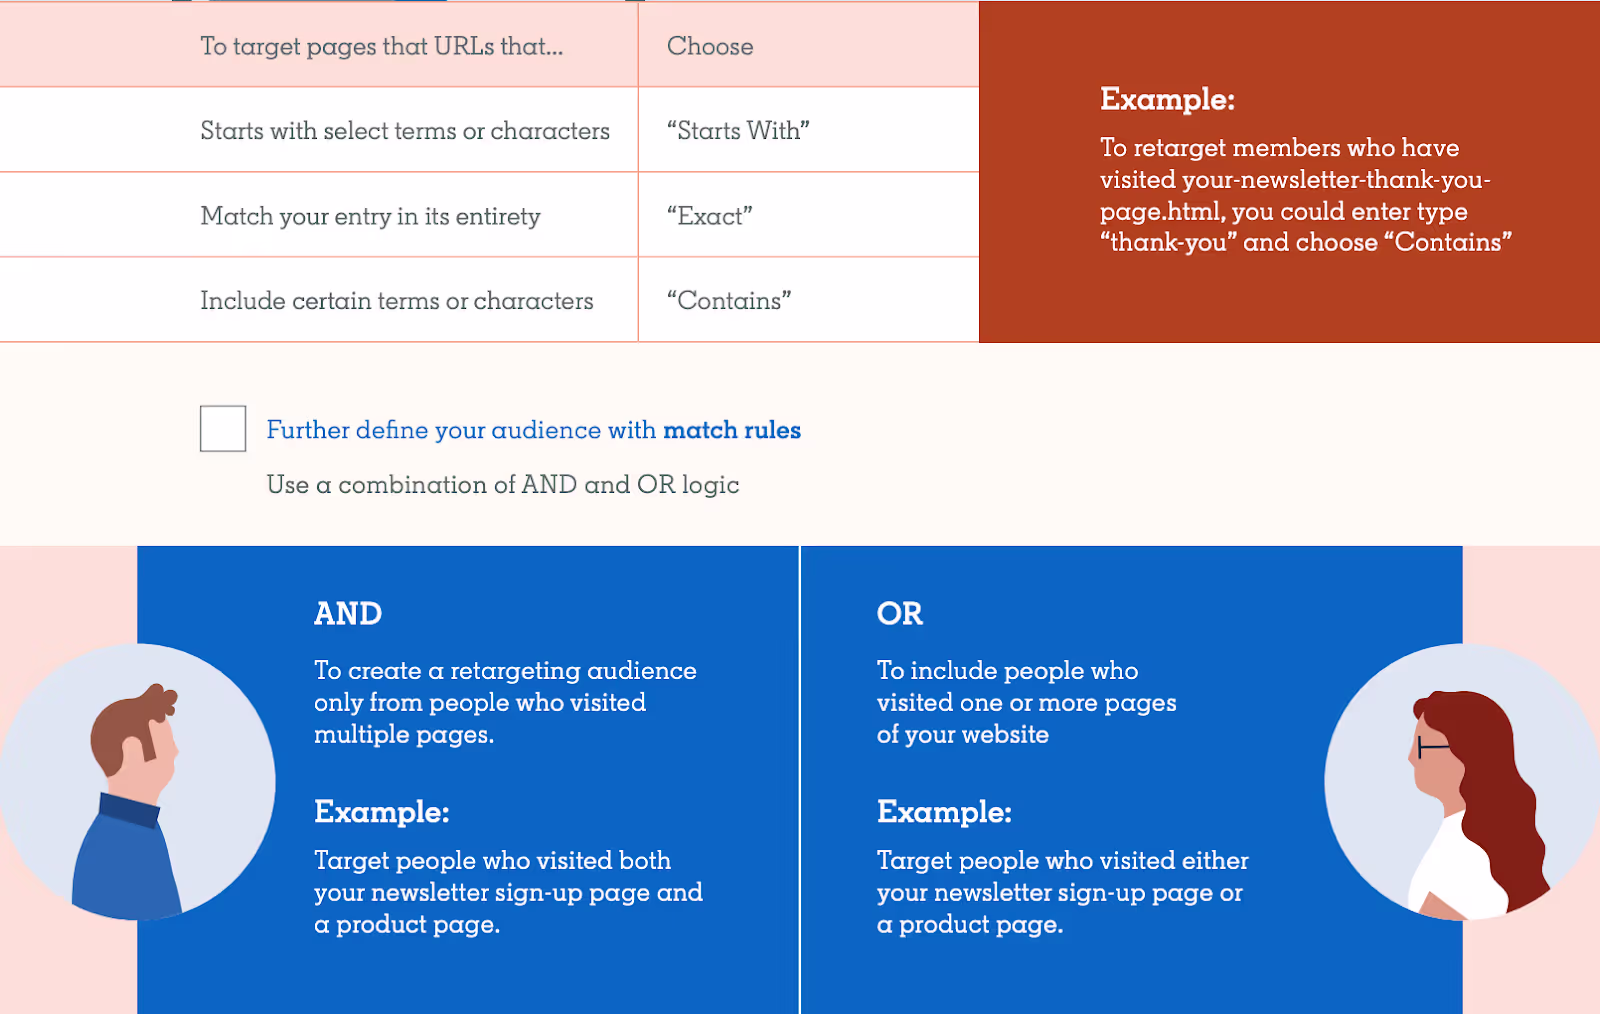
With Pixel, filtering out accounts that don’t match your target geographies, industries, sizes, or engagement levels can be challenging. This also translates to limited personalization options, as you can only segment campaigns by page views rather than by account and engagement properties.
The limitation: Limited segmenting & filtering options resulting in subpar audience quality and limited scope for personalization.
How Account-based Retargeting helps
Account-based retargeting with Factors supports granular segmentation based on a wide range of firmographics and engagement criteria. For example, with Factors, you can identify and retarget a list of accounts that meet the following rules:
“US-based Software companies with 100-500 employees visiting our pricing page & G2 profile for at least 10 seconds with a scroll-depth of 20% or more”
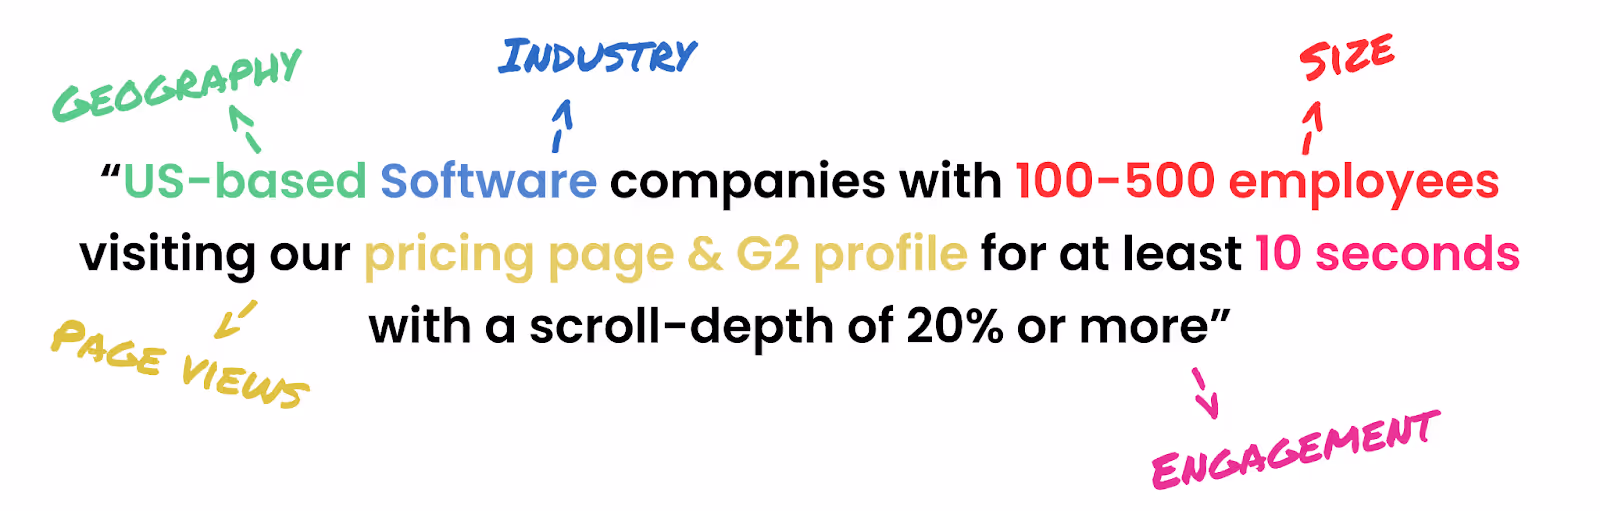
Here are a few ways in which Factors helps segment traffic data (in addition to regular old page views):
- Country
- City
- Industry
- Size
- Revenue range
- Time spent on page
- Scroll-depth
- Button clicks
- And a combination of all of the above
This level of filtering results in a list of precisely targeted ICP accounts that would make a great fit for your business. Additionally, by integrating your CRM, you may also include/exclude specific accounts, such as existing customers and competitors.
And guess what? We found the solution to fix your list-building problems once and for all!
Factors has launched Audience Builder, which allows marketers to automatically segment based on their preferred criteria, push these segmented audience lists to LinkedIn, and activate personalized, targeted advertising.
For example, you may choose to show accounts that visit high-intent pages such as factors.ai/pricing an ad creative offering a free trial. On the other hand, you can show accounts reading your competitor comparison blogs a “comparative” ad creative. The possibilities are endless.

Real-life comparison: Pixel vs Account-based retargeting
We’ve talked the talk - now we’ve got the numbers to back it up. Here’s how two campaigns, one that’s Pixel-based and another that’s Account-based, compare to each other. Note that all else (duration, budgets, creatives, copies) has remained the same through the course of this experiment.
Over the same period, we find that CTR is higher under Pixel-based retargeting, likely because this approach targets exact users visiting the website. That being said, Account-based remarketing significantly outperforms Pixel-based retargeting in every other key metric, including leads generated.
And there you have it.
Solve your ad targeting woes with AdPilot
If you want to maximise ROI for your LinkedIn ads, look no further than our latest offering: LinkedIn AdPilot! We offer a wide range of features that allow you to segment audiences based on intent data, implement exposure control for your campaigns and determine the true ROI for your ads.
Speak to our team today to understand how you can use AdPilot to improve your LinkedIn retargeting efforts.

