Factors Blog
Insights Across All Things B2B Account Intelligence & Analytics
.webp)
Amplitude vs. Heap: How to Pick the Best Web Analytics Tool?
Amplitude has been around since 2012 and has thus been a pioneer in the product analytics market. Its biggest selling point is that it allows companies to track user flows and journeys. It is also easy to use, so any employee can easily note the behavioral patterns of a company’s website users.
Heap is also a similar tool to Amplitude. However, the major advantage of Heap is that it can readily capture user actions through automatic event tracking. It allows for a better understanding of user behavior without a dedicated understanding of background coding for companies. This article helps you decide which tool is better in aiding your company to achieve its goals for growth.
tl;dr
- Amplitude is allowing data leaders to experiment with their data through a product called Amplitude Experiment.
- Amplitude provides granular user segmentation and greater event tracking flexibility compared to Heap.
- ContentSquare, a leading digital market analytics company, signed a contract to acquire Heap in September 2023.
- Heap has notable attributes such as a user-friendly interface and automatic event tracking that allow for easy and quick implementations, making it attractive to many B2B companies.
In this article, you’ll find out whether Amplitude–with its personalization capabilities–is the better option for your company compared to Heap, which is much more user-friendly.
CRM integrations
All B2B companies use CRM tools, so it’s necessary that your company’s operating web analytics tools also integrate with the CRM tools you’re used to. These integrations allow you to have all the necessary data in one platform so that you can work seamlessly. CRM integrations offer cross-collaborations that increase the scalability of your processes and make client work much more methodical.
Amplitude’s notable CRM integrations include Customer.io and Salesforce. Heap has more integrations; in addition to Salesforce, it also integrates seamlessly with Hubspot and Zendesk.
Third-party integrations
B2B companies use a variety of third-party tools for email marketing, e-commerce, and marketing. It’s essential that your web analytics tool integrates with all these tools in order to pull data from them as required.
Amplitude’s third-party integrations include:
- Extole
- Facebook Ads
- Apptimize
- Slack
- Segment
- Optimizely
Heap’s integration offerings are sizable, and comprise:
- Zapier
- Braze
- Cordial
- Shopify
- Mailchimp
- Marketo
Pricing
Amplitude’s pricing model isn’t transparent, but it does have a basic free version with which your company can enjoy many of its features. In the free plan, you can access data planning tools core analytic charts. However, if you want much more specific information–such as behavioral reports or analytics–then the shift from the free plan to the growth plan is quite steep, starting at $995/month. The Enterprise plan is for data-led businesses that require much more detailed insights and begins at $2000/month for companies that require it.

Heap has four pricing plans: Free, Growth, Pro and Premier. The free plan encompasses up to 10K monthly sessions. Similar to Amplitude’s basic plan, it also provides core analytic charts. Heap’s Growth plan is quite inexpensive compared to Amplitude’s. It starts at roughly about $3600/Year or $300/Month, making it much more accessible to small businesses wishing to scale. Heap does not offer transparent pricing for its Pro and Premier plans, and instead charge per session. Overall, Heap seems to have more cost flexibility in its pricing models simply because there are more models available.

Ease of installation
Both Amplitude and Heap don’t require you to install anything on your desktop. If you want to set up Amplitude or Heap, all you have to do is go to their respective websites and sign up for the plan you want.
In Amplitude, once you have signed up and chosen a plan, you can then login and access the dashboard. To use Amplitude effectively, you must add Amplitude’s tracking code and install the SDK to the codebase. You also have to set up tracking within the app so that it can gather the data as per your requirements. Heap also follows the same procedures; the two analytics tools are quite similar in this aspect.

Event tracking
Event tracking is among the most important features that most companies use web analytics tools for. Both Amplitude and Heap allow your company to track events. However, the advantages that they serve are different. Amplitude is more flexible and provides easily customizable event tracking. Your company has a lot to gain from custom event tracking as it captures unique customer actions that help detail more specific date insights.
Heap, on the other hand, records everything from the moment that you start using it for your website. This feature is termed Automatic Event Tracking, which records everything without coding or any manual code tagging. It can also collect historical data from the past, leading users to analyze data from the past without any extra tracking. However, users also claim that it’s difficult to set up an event correctly, and matching it to the coding can be complicated.

Data privacy
Data privacy and protection are of utmost importance for users and companies alike. Therefore, data collection has become an extremely complicated landmine that companies have to navigate around and Amplitude is no different. However, Amplitude has had quite a responsible stance on data privacy and protection since 2018 when the GDPR was passed.
The company has made updates so that it may fall in line with the General Data Protection Act, including product updates such as single and bulk user data deletion which allows users to delete all their data from the platform. The Email Monitoring update lets users track their request so deletion is successful. The company is also ISO 27001-certified for secured governance.
Heap has privacy built into its design. The company states that its focus remains on creating a tool that aligns with data privacy. Still, to comply with GDPR, Heap has taken the following steps:
- Third-Party Audits: These audits helped the company conduct any gap analysis regarding their GDPR readiness.
- Data Protection Act: The company has rewritten its Data Protection Act to comply with data subject rights.
How Can You Pick the Best Web Analytics Tool?
Web Analytics tools are instrumental in helping you understand user demographics and tracking customer activity. Hence, it’s necessary to pick a tool that’s reliable and trustworthy. You can judge how well your web analytics tool will perform by considering the following factors:
1. Business Objectives
Every business has its own objectives; knowing these can help you better manage your company’s expectations and outcomes.
2. Pricing
We have mentioned this before, but you should pick a web analytics tool that is sustainable as per your business model. Be aware of the hidden fees and growth fees that you will have to pay so you can budget accordingly.
3. Data Privacy Compliance
Data Protection Laws protect clients and companies alike. You should opt for tools that follow these laws. Using a tool that is GDPR-compliant informs your customers that your company is conscious regarding data collection and security.
4. User Interface and Visualization
There’s no point in web analytics tools that lend more complications to your company’s data. Pick a tool that is easy to use and has dashboards for immediate data visualization. Data visualization simplifies data so non-technical personnel can also understand it.

5. Run Trials
If the web analytics tools you’re opting for have the option for a free demo, opt for it and notice how your workflow changes. Make sure you have metrics in place for these trials so they are effective.
Deciding on a Web Analytics Tool
Choosing the right web analytics tool changes your workflow for the better and generates actionable insights that you can implement to grow your business exponentially. While no tool can be perfect, Factors is a comprehensive analytics and attribution tool that offers you:
- Marketing impact measurement
- Conversion rate optimization
- Granular visibility
- Funnel conversion optimization
- Customer journey analysis
- Points of inflection identification for B2B sales
- AI-automated Insights
- Account level timelines
- Tailor-made reports and data visualization
If you’re looking for ways to get more out of your company, then Factors provides some of the best marketing solutions for a B2B SaaS venture.
Customers using Factors testify to its reliability. It has a 4.7 out of 5 score on G2. Companies that have worked with Factors have seen an uncovering of 64% of the anonymous companies on their websites, which has helped them close more than 20,000 deals. All in all, client satisfaction for Factors’ services is high.

For more information or to set up a demo, contact the Factors’ team today and learn how to utilize the tool to fulfill your company’s objectives. Not sure about Factors? Sign up for a free trial and decide if Factors is the best option for your company.
Pixel vs Account-based LinkedIn Retargeting
B2B marketing teams invest significantly across campaigns and content to drive qualified website traffic. However, benchmarks find that only about 2% of this traffic actually converts, with the majority of visitors simply bouncing off or browsing anonymously on the website.
Retargeting the remaining 98% of visitors via LinkedIn has proved to be an effective strategy to recapture interest from anonymous website traffic. While we won’t cover the specific benefits of LinkedIn retargeting here, this case study summarizes how Sage successfully leveraged LI retargeting to:
- Generate 700,000 impressions in 6 weeks
- Improve lead generation by 4x
- And reduce cost-per-lead (CPL) by 80%
Simply put, LinkedIn retargeting works.
LinkedIn retargeting relies on the LinkedIn Insight tag (aka LinkedIn Pixel) to match website visitors with LinkedIn audiences.
The LinkedIn insight tag is a simple piece of code placed on a website to help optimize campaigns. While the LinkedIn Pixel serves many functions, including conversion tracking and demographic insights, it’s challenged by shortcomings around website retargeting.
While LinkedIn Pixel works to some extent, we have found an alternate approach that can take your retargeting campaigns to the next level, also known as account-based retargeting. Account-based retargeting works by identifying, qualifying, and targeting anonymous accounts, as opposed to individual users visiting a website. Using a combination of identifiers, account-based retargeting has been shown to deliver:
- Larger, account-level audiences
- Improved match rate accuracy
- Better segmentation and targeting
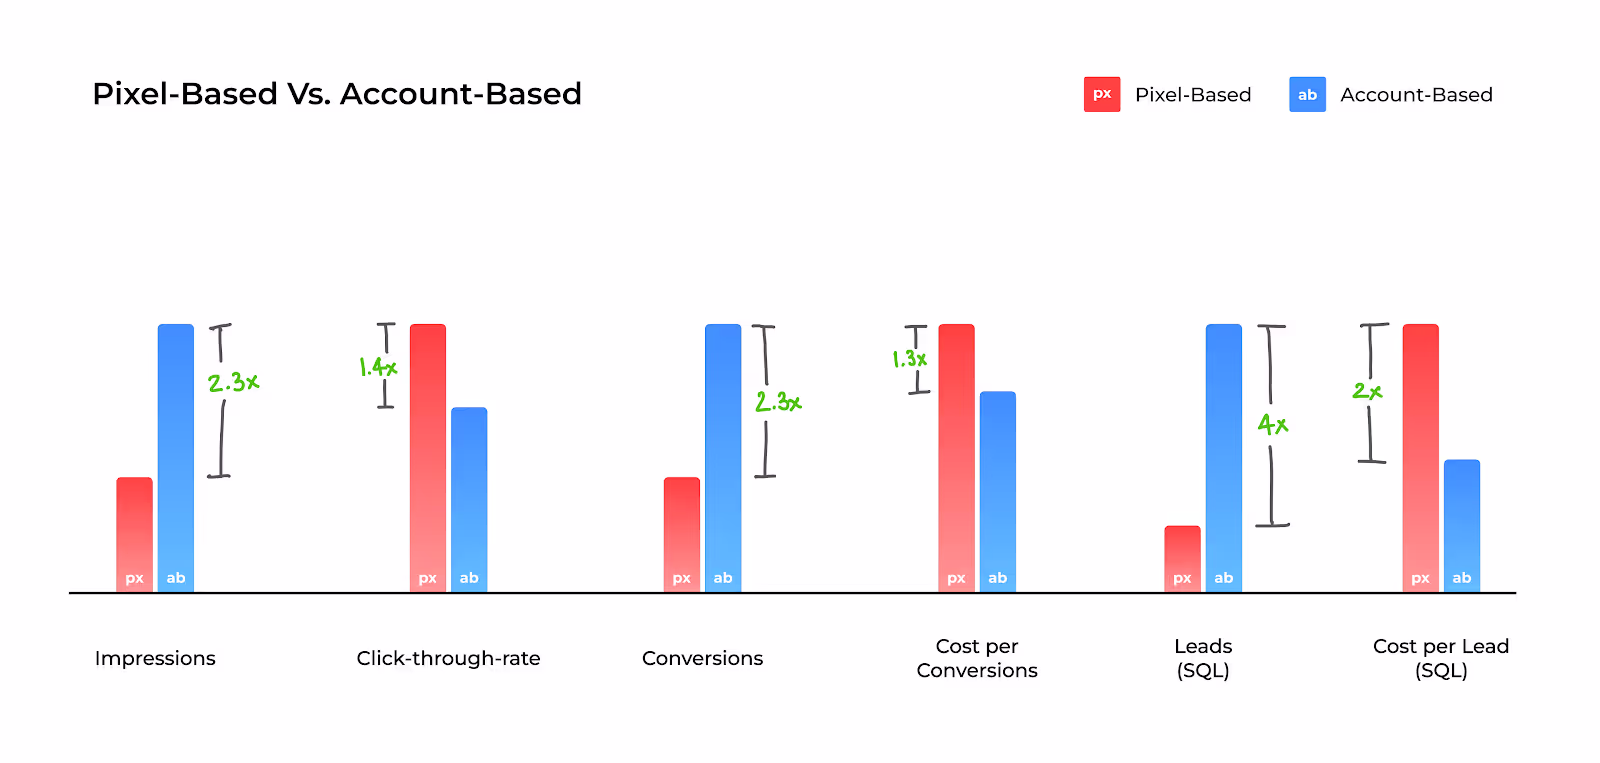
And the results? Well, they speak for themselves:
While the LinkedIn Pixel is a must-have solution given its wider functionality, we explore the limitations of Pixel-based retargeting and why Account-based retargeting is an effective alternative ⬇️
Limitation #1 - Match rates
The LinkedIn Pixel works by placing a cookie in visitors’ browsers, so when a LinkedIn user lands on your website, they may be identified and retargeted on LinkedIn. Note that this cookie-based identification takes place at a device and browser level for individual users. This means that, for the Pixel to match a website visitor to a LinkedIn user, the visitor must meet all 4 of the following criteria:
- Be an active member of LinkedIn
- Explicitly accept cookies on the website
- Use the same device (phone/laptop/tablet) to visit the website and LinkedIn
- Use the same browser (chrome/firefox/safari) to visit the website and LinkedIn
While a few visitors will probably fit this criteria, audience match rates via the Pixel are limited by the fact that the majority of traffic either doesn’t use LinkedIn, rejects cookies, or, most commonly, uses different devices/browsers for product research and LinkedIn browsing.
In fact, only about 42% of B2B product research involves mobile touch points — with the majority of B2B buyers choosing to conduct their research on desktops. On the other hand, a whopping 80% of LinkedIn engagement is via mobile. This is not surprising, given that LinkedIn is primarily a social networking app.
And so, despite the fact that LinkedIn Pixel works as designed, its match rates tend to be relatively poor, given the practical realities of B2B user behavior.
The limitation: Low match rates as a result of limited, cookie-based matching mechanisms by the LinkedIn Pixel.
How Account-based Retargeting helps
The LinkedIn Pixel relies exclusively on cookie-based tracking to create its matched audiences. Factors, on the other hand, leverages a combination of three identifiers — IP address, advertising ID, and cookies, to triangulate a data connection and match anonymous traffic to a company.
Factors connects with over 4.2B+ IP addresses and 65M+ company profiles (in addition to cookies and ad IDs) to accurately identify which accounts are visiting your website. Note that this is regardless of whether the visitor in question is a member of LinkedIn, uses different browsers, etc.
In fact, Factors can also identify remote companies by initially cookie-ing people using their corporate IP address to then re-identify them when they work remotely. To further explain how Factors achieves industry-leading match rates, here’s Viral from 6sense, one of our data partners:
“As a person moves around, their IP address changes. The platform adjusts for these changes by pulling in several additional markers to help match signals to an account. Now, with more variations in IP address data as remote working spreads across industries, our Graph deploys available secondary marker information, like cookies and mobile advertising IDs, to triangulate data connections. The Graph uses additional markers to sift through the noise so that confidence in the match rate remains consistent. Given the amount of signals we track, we don’t map every signal all the time, but we have observed accuracy over 85%.”
- CTO Viral Bajaria, 6sense, Data Partners
💡Build Better LinkedIn Retargeting Audiences with Factors
Limitation #2 - User-level targeting
B2B buying decisions are rarely made by a single person. The typical buying committee comprises almost a dozen people from multiple departments and time zones. Selling a SaaS product today might involve gaining buy-in from multiple C-suite executives, individual stakeholders from operations to sales to marketing, and a chief revenue officer – along with legal and implementation teams.
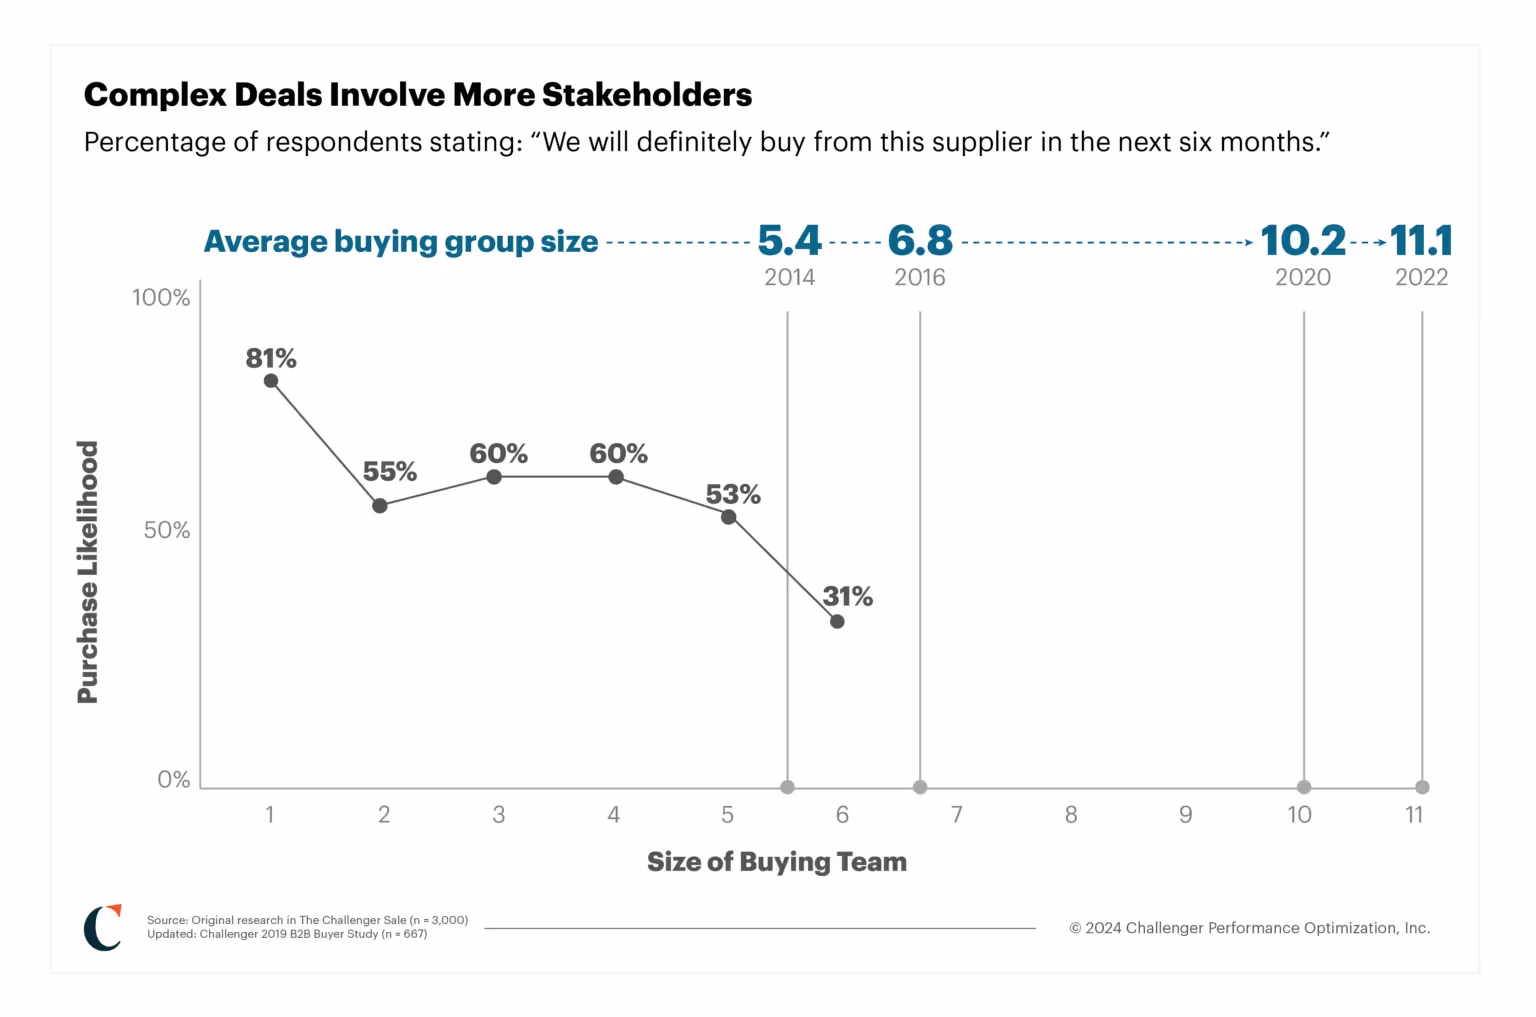
Source: Challenger
Given that the Pixel focuses on individual, single users visiting your website, it fails to capture the wider buying group from each account those users are from. This shrinks your total matched audience size considerably, but more importantly, it inhibits your marketing efforts from reaching key stakeholders and decision-makers who may not have been the ones visiting your site.
For example, if a junior marketer visits Factors.ai and is retargeted by the LinkedIn Pixel, the junior marketer alone will receive ads — with other stakeholders from the target account being ignored. As a result, this approach relies on the junior marketer being independently influential enough to convince the rest of the team to move forward with the deal. Definitely a tough sell.
The limitation: User-level targeting, as opposed to account-level targeting, results in fewer stakeholders targeted per account and smaller audience sizes.
How Account-based Retargeting Helps
While LinkedIn is best for targeting buying groups, it’s important to remember that there is no initial intent to buy on a social media platform. You need to layer in intent signals from multiple sources, such as your website and review sites like G2, to understand how you can best retarget relevant accounts.
Factors identifies intent signals and re-targets anonymous website traffic at an account level. This means that multiple decision-makers and stakeholders from the same company will be targeted on LinkedIn, regardless of which user actually visits the website. This bodes well for multiple reasons:
- Increases audience size without compromising on the quality of accounts
- Creates brand awareness at a company level rather than at an individual level
- Improves odds of targeting the right decision-makers within each account
Even assuming that account-based targeting finds the same 100 accounts as Pixel-based targeting, the former would generate an audience size of 300-500 users (3-5 people from each account), while Pixel-based targeting would only target 100 users (1 from each account). More importantly, a larger audience will improve the odds of targeting decision-makers, ultimately resulting in more leads and conversions. Accordingly, account-based retargeting solves for the practical limitation of LinkedIn campaigns struggling to scale due to poor audience size.
Limitation #3 - Audience segmentation
The previous two points discussed the LinkedIn Pixel’s limitations in terms of audience quantity. This third limitation highlights why the Pixel tends to fall short in terms of audience quality. In reality, a significant portion of your website traffic wouldn’t make a good fit for your business. Even within the subset of ICP accounts visiting your website, only a fraction would be “sales-ready” at any given moment (with the remaining accounts having to be nurtured until they’re prepared to buy).
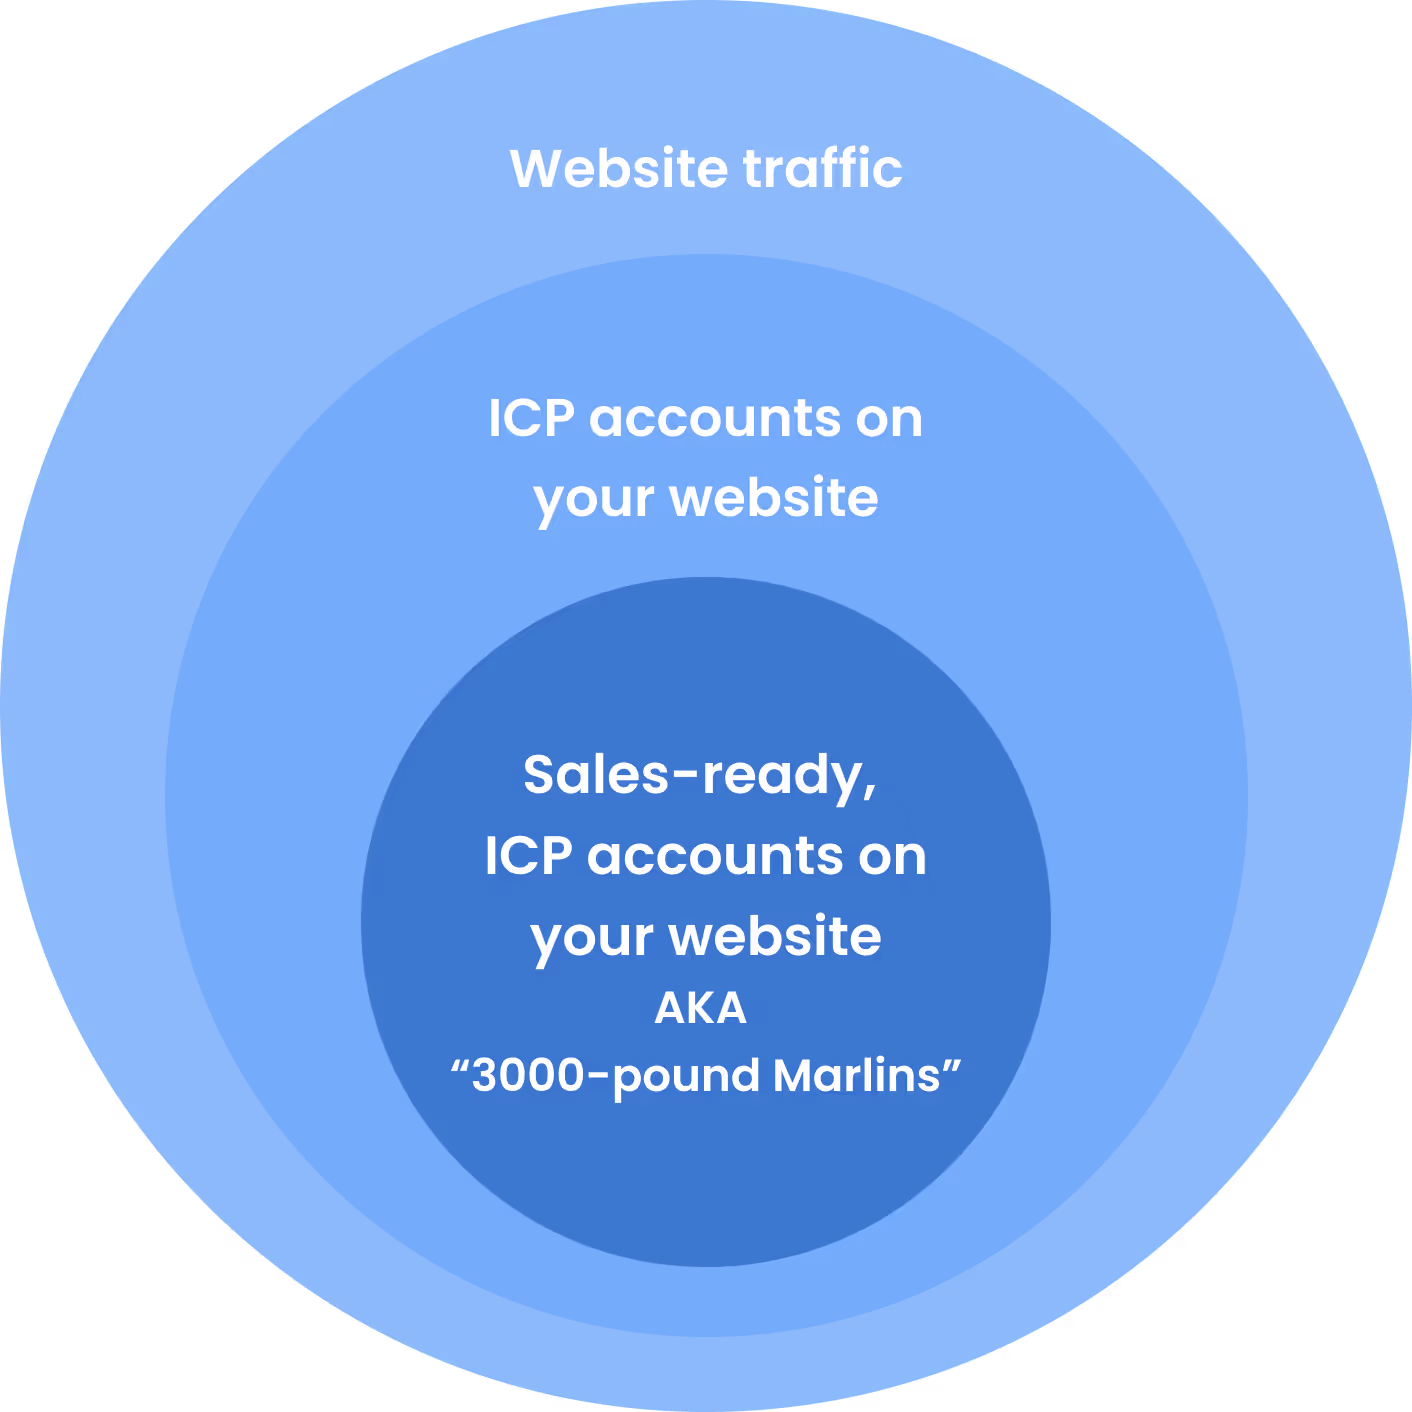
As important as having a large audience is, the quality of this audience plays a key role in determining conversions and RoAS as well. In an ideal scenario, marketing teams should only retarget this subset of sales-ready “3000-pound marlin” accounts.

The LinkedIn Pixel limits audience segmentation based on intent and engagement. With the Pixel, website traffic can only be segmented based on page views. While this is definitely a good starting point, it lacks granularity.
With Pixel, filtering out accounts that don’t match your target geographies, industries, sizes, or engagement levels can be challenging. This also translates to limited personalization options, as you can only segment campaigns by page views rather than by account and engagement properties.
The limitation: Limited segmenting & filtering options resulting in subpar audience quality and limited scope for personalization.
How Account-based Retargeting helps
Account-based retargeting with Factors supports granular segmentation based on a wide range of firmographics and engagement criteria. For example, with Factors, you can identify and retarget a list of accounts that meet the following rules:
“US-based Software companies with 100-500 employees visiting our pricing page & G2 profile for at least 10 seconds with a scroll-depth of 20% or more”
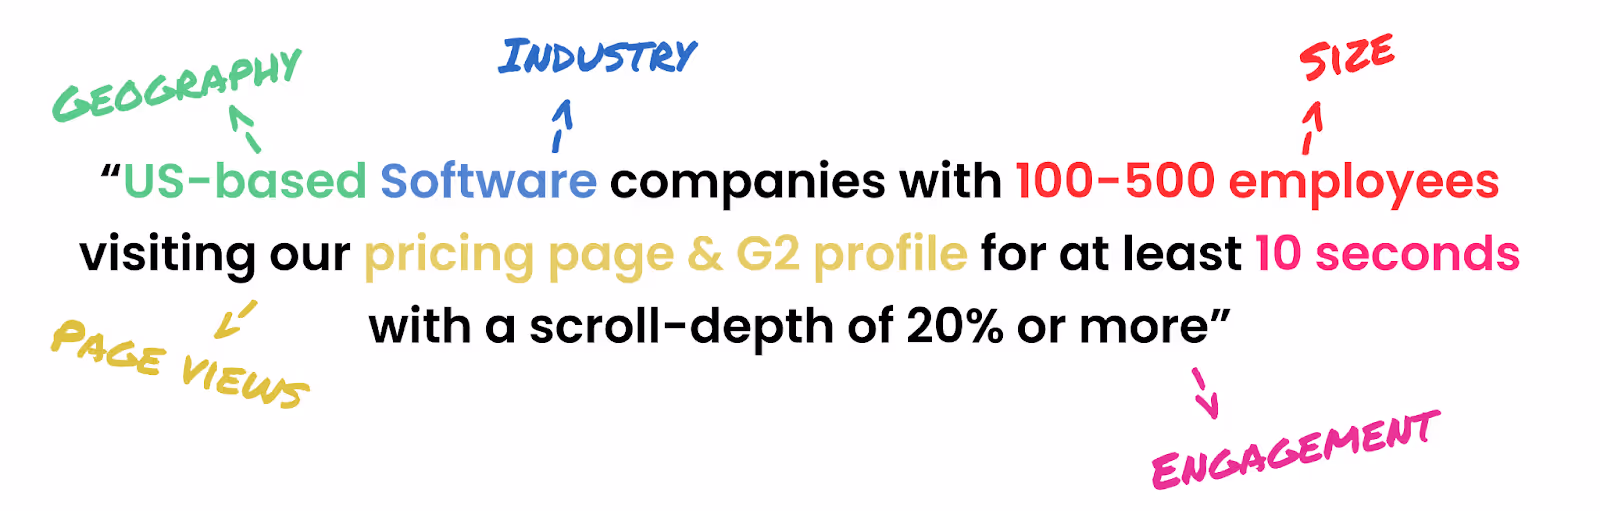
Here are a few ways in which Factors helps segment traffic data (in addition to regular old page views):
- Country
- City
- Industry
- Size
- Revenue range
- Time spent on page
- Scroll-depth
- Button clicks
- And a combination of all of the above
This level of filtering results in a list of precisely targeted ICP accounts that would make a great fit for your business. Additionally, by integrating your CRM, you may also include/exclude specific accounts, such as existing customers and competitors.
And guess what? We found the solution to fix your list-building problems once and for all!
Factors has launched Audience Builder, which allows marketers to automatically segment based on their preferred criteria, push these segmented audience lists to LinkedIn, and activate personalized, targeted advertising.
For example, you may choose to show accounts that visit high-intent pages such as factors.ai/pricing an ad creative offering a free trial. On the other hand, you can show accounts reading your competitor comparison blogs a “comparative” ad creative. The possibilities are endless.

Real-life comparison: Pixel vs Account-based retargeting
We’ve talked the talk - now we’ve got the numbers to back it up. Here’s how two campaigns, one that’s Pixel-based and another that’s Account-based, compare to each other. Note that all else (duration, budgets, creatives, copies) has remained the same through the course of this experiment.
Over the same period, we find that CTR is higher under Pixel-based retargeting, likely because this approach targets exact users visiting the website. That being said, Account-based remarketing significantly outperforms Pixel-based retargeting in every other key metric, including leads generated.
And there you have it.
Solve your ad targeting woes with AdPilot
If you want to maximise ROI for your LinkedIn ads, look no further than our latest offering: LinkedIn AdPilot! We offer a wide range of features that allow you to segment audiences based on intent data, implement exposure control for your campaigns and determine the true ROI for your ads.
Speak to our team today to understand how you can use AdPilot to improve your LinkedIn retargeting efforts.
.webp)
Amplitude vs. Google Analytics: Which One Should Your Business Use?
The end of GA’s Universal Analytics 360 model has prompted many GA users to find other analytics tools that better suit their needs. Universal Analytics ceased to process new data as of July 2023, and had to begin the transition to GA4 or find an alternative analytics services provider.
Amplitude is among these alternative analytics solutions. Google Analytics was popular due to its basic version being free and its former setup’s ease of use; these aspects are set to change with GA4. Many users are opting to switch to Amplitude since it offers migration of historical data, while GA4 does not. Here’s what you need to know about GA4 and Amplitude to understand which is better for your company.
tl;dr
- Google announced that Universal Analytics would stop processing new data beginning July 1st, 2023, and encouraged current users to switch to GA4.
- Universal Analytics 360 users can only extend their usage until July 2024.
- GA4 does not support historical data migration, while Amplitude allows seamless data transfer.
- GA4 offers extensive integrations but has a steep learning curve; Amplitude retains traditional metrics and prioritizes privacy.
- Pricing for both platforms follows a usage-based model, with Amplitude providing a free starter plan.
Read on to understand what you can expect from Google Analytics’ and Amplitude’s services.
Data migration from Universal Analytics
If you’re a Universal Analytics user, GA4’s big disadvantage is the loss of historical data. Since Universal Analytics 360’s tracking code is so different from GA4’s, there’s no path to migrate historical data from the former to the latter. While you will not, of course, lose the ability to access your Universal Analytics data, you cannot compare it with data that you gather through GA4. You can only begin collecting data through a new GA4 property once you add its tracking code to your company’s website.
If you want to keep using your Universal Analytics property, you can keep doing so until July 2024. In order to obtain as much historical data as possible on GA4, you can switch to a dual tagging configuration. This will enable you to collect data into both properties. You can use Universal Analytics’ data points and reports while also building up a few months’ worth of historical data in GA4.
On the other hand, Amplitude offers users a unified platform wherein they can migrate their data from Universal Analytics. It utilizes the same data elements and a similar tracking model to Universal Analytics. Current Universal Analytics users can immediately switch to Amplitude and compare historical data with present data.
Integrations
Companies require analytics tools that integrate seamlessly with their CRMs and third-party tools. Your analytics tool should be compatible with any online workspaces, e-commerce tools, and advertising platforms that your company and employees utilize frequently.
GA4’s list of integrations is extensive for CRMs, email marketing tools, artificial intelligence, e-commerce platforms, and sales and marketing/advertising platforms. Its integrations include Facebook Ads, ChatGPT, Microsoft Excel, Calendly, Hubspot, and Dubsado via Zapier.
Integrations are not currently Amplitude’s strong suit. While it does offer some strong CRM and online workspace integrations–including Salesforce, Adobe Analytics, Notion, and Slack–it does not integrate with many of the tools that GA4 does. It also does not offer integrations with lesser-known CRMs.
Data models
GA4’s data model is very different from Universal Analytics. That’s not an understatement; not only is it impossible to migrate data, it’s also impossible to measure certain data points that you’ve gotten used to with Universal Analytics. You might be able to collect these data points in different ways, but they may not be labeled in ways you’re familiar with. For example, GA4 does not measure the bounce rate of webpages.
Amplitude allows you to use data points that GA4 has rendered redundant on its platform. It will measure data points such as bounce rates and compare it with historically available information imported from your Universal Analytics account.
Pricing
GA4’s new pricing marks a significant shift from UA’s fixed price model. As a Universal Analytics user, you would be charged a set price of US $150,000 every year. The rate of data collection wouldn’t usually affect this price. Data collection limits were extensive, so businesses only incurred extra costs when the data collection would increase significantly.
GA 4’s usage-based model means that users will be charged according to the amount of data they collect. GA4 also offers a free version, known as GA4 Standard.
Amplitude also utilizes a usage-based model. It offers three pricing tiers: Starter (which is free), Growth, and Enterprise. The Growth and Enterprise plans’ prices are available on request. In addition, Amplitude also offers certain startups one year of their Growth plan for free if the startups are early stage or have Black co-founders.
Although Amplitude does not disclose its price publicly, TrustRadius states that the Growth plan begins at US $995 per month. Verified users also state that Amplitude’s basic plan offers a good variety of features and allows first-time users to check whether the tool is compatible with their business for free.

Data protection and privacy
Data protection experts have complained about Google Analytics’ non-compliance of privacy laws numerous times in many different countries. The adoption of the EU-U.S. Data Privacy Framework by the European Commission lifted the ban on GA in the middle of this year. Before that, GA was banned in Austria and France, with various other European countries raising concerns about the ways Google stores and utilizes consumer data. Sweden’s privacy protection authority, the IMY, has raised questions about GA’s compliance with the GDPR.
Companies using GA have to be extra careful about data storage and usage. The Data Privacy Framework requires companies to follow a multitude of policies that protect user data. GA4’s efforts to comply wholly with privacy laws such as the GDPR allow users to opt out of cookies. Machine learning fills the gaps created through these opt-outs. If enough users opt out, this data could therefore become unreliable.
Amplitude’s privacy disclosure on how it uses consumer data is extensive and easy to understand for users. Clients can change or retract their data at any time. They can also opt out of cookies. Your clients can ask for a copy of their personal data at any time to verify which personal information Amplitude has access to. Amplitude is fully compliant with the CCPA, and takes privacy petitions seriously.
Features
Amplitude’s intuitive dashboards enable you to understand how prospective clients interact with the content on your website. You’ll be able to access crucial insights into client behavior and drive conversions through a better understanding of prospects’ pain points. Amplitude also offers users the option to design surveys for their clients. These feedback surveys are customizable and can be used to target certain segments of users. Real-time feedback allows you to increase client satisfaction and trust in your company.

There is a significant learning curve involved in switching from Universal Analytics to GA4. While a variety of learning material is available for GA4, the importance of dedicated, immediate customer support cannot be understated.
However, GA4’s extensive integrations allow it to be a widely implementable tool. While it is true that GA4 is notoriously difficult to set up, it offers robust analytics and tracking information.
Choosing the Right Analytics Tool for Your Business
Finding the right analytics tool can be a long, tricky endeavor. We’ll help you find an indispensable tool on the first try, instead of letting you go down the trial-and-error route.
With the phase-out of Universal Analytics 360 in July 2023, businesses must carefully evaluate their analytics needs before selecting a new platform. The right analytics tool depends on several key factors.
First, consider data continuity. Some platforms may not allow you to migrate historical data, which can disrupt long-term analysis. Privacy and data protection should also be a priority, especially for companies operating in regions with strict regulations like GDPR and CCPA.
Next, assess ease of use. Tools with steep learning curves or complex setups can slow down adoption across teams. Seamless integration with your existing CRM, marketing platforms, and other third-party tools is crucial for maintaining workflow efficiency. Pricing structures also vary; some platforms charge based on usage, which can lead to unexpected costs as your data volume grows.
Finally, reliable customer support ensures quick resolution of issues, minimizing disruptions.
Selecting an analytics solution involves balancing privacy, scalability, ease of use, data flexibility, integrations, and support to align with your company’s growth and data strategy.
In a nutshell, the most important features are:
- Privacy. The tool you use should be in full compliance with the GDPR and CCPA or other local privacy laws.
- Scalability. Will your analytics tool accommodate greater influxes of information as you grow, and indeed, help you grow?
- Ease of installation and use. You don’t want a tool that requires a dedicated team of experts to decipher. An analytics tool should be easy to use across all the teams that require access to it, and ideally come with a no-code setup.
- Extensive analytics and reporting options
- Seamless integration with other tools, and
- Dedicated, quick customer support.
If we had to pick…
We would pick Factors. While no analytics tool has the full package, Factors comes close with its:
- Customizable reports and dashboards
- Compliance with privacy laws,
- Attribution across multiple channels
- De-anonymization
- Quick, codeless setup
- Ease of implementation
- CRM integrations
Factors was created to help your B2B company reach its goals by allowing you to make the most of your web content. Its competitive pricing options also set it ahead of other tools with similar capabilities. The paid tiers are priced between US $99 to US $1499.

You can also check out Factors’ features for free using their trial option, or contact them for a plan custom-built for your business.
.webp)
10 Key Customer Engagement Metrics Explained
Customer engagement is crucial for business growth and profitability. Highly engaged customers buy more, promote your brand to others, and stick with you for the long haul.
But how do you know if your customers are engaged?
This is where customer engagement metrics come in. When tracked consistently over time, these metrics reveal objective insights into how customers interact with your brand.
In this article, we'll cover the top 10 customer engagement metrics every business should track in 2023 and beyond. We'll define each metric, explain how to calculate it, and discuss its importance.
Let's dive in!
TL;DR
- Customer engagement metrics reveal how customers interact with your brand and drive loyalty and revenue.
- Key metrics include NPS, CSAT, churn rate, CLTV, session duration, and bounce rate.
- Tracking these data points helps businesses improve customer experiences and reduce churn.
- Unified platforms simplify data analysis and uncover actionable insights for growth.
What is Customer Engagement?
Customer engagement is the process of building a long-term relationship with your customers. It measures how often customers connect with your brand, the different channels they use to connect, and how many of them return to make a purchase.
Simply put, customer engagement refers to how customers think, feel, and act toward your business and brand over time.
It goes far beyond a simple transactional exchange. Rather, engagement measures the depth of a customer's relationship and emotional connection with your brand.
Some examples of highly engaged customers:
- Visit your website frequently and spend time reading content
- Get social with your brand by liking and commenting on posts
- Open and click on emails and marketing campaigns
- Provide feedback and reviews on their experience
- Participate in surveys, contests, or online communities
- Respond to special offers or actively refer friends
- Increase their purchase frequency and order sizes over time
On the flip side, disengaged customers only interact on a superficial level. They don't open your emails, ignore social media, rarely visit your site, and overall have negligible connection to the brand, increasing the risk of customer churn.
These customers are at high risk of churning and switching to a competitor.
For example, an early-stage startup using a SaaS platform may be highly engaged—frequently using product features, staying updated through newsletters, engaging on social media, participating in user research, and even recommending the platform to peers.
An enterprise client may be relatively unengaged—using only basic features, providing limited feedback, and feeling indifferent towards the SaaS provider brand.
When you monitor customer engagement through various metrics, you can identify disengaged accounts proactively so you can reactivate them before it's too late.
What are customer engagement metrics?
Customer engagement metrics are data points that help companies understand how customers interact with their brand and product. Tracking customer engagement metrics serves several important purposes:
- Achieve a better understanding of target audience: For our startup example, metrics may show the product resonates well with early-stage teams looking for agile collaboration tools.
- Pinpoint strengths and weaknesses in sales funnel: Customer engagement metrics may reveal messaging is not working to convert enterprise prospects at the top of the funnel.
- Know what to prioritize & refine the customer journey: Since enterprise clients have larger deal sizes, it may make sense to refine messaging and sales collateral to better appeal to their needs.
- Improve customer experience and retention: Analyzing usage metrics can reveal where customers struggle or lose interest, highlighting areas to improve CX and retention.
Continuing our engaged vs unengaged customers example, for the early-stage startup, vital engagement metrics may validate their current targeting and product-market fit.
For the enterprise prospect, weak metrics signal a need to adjust strategy to better appeal to and support those customers.
Tracking these metrics gives your sales and marketing teams visibility into customer behavior that can then be used to tailor messaging, visuals, and even product features over the long run.
10 Customer Engagement Metrics You Should Track
So, what metrics should you track? Let’s look at the ten key customer engagement metrics that you should consider.
1. Bounce Rate

The bounce rate measures the percentage of visitors who enter your site and then leave ("bounce") after viewing only one page.
High bounce rates indicate your content may not be resonating with users or properly targeted.
Bounce Rate = (Bounces / Total Site Visits) x 100
For example, if you had 5,000 bounces out of 25,000 visits, your bounce rate would be:
5,000 / 25,000 x 100 = 20%
Across 150 million page views taken as a survey by Animalz, the median bounce rate for SaaS blogs in 202 was 80.33%.
But the general rule of thumb is—lower is better.
A high bounce rate means visitors aren't finding what they need on your site quickly enough. As a result, engagement is superficial.
For example, an ecommerce site had 25,000 entrances last month and 15,000 bounces. The bounce rate would be (15,000 / 25,000) x 100 = 60%. You could try to get this below the 50-65% ecommerce average benchmark by trying one of the following:
- simplify navigation so the user can find what they came looking for
- improve page load speed
- highlight your phone number prominently on the contact page
- add pricing breakdown
- Add visual elements like images or videos.
This article by SEJournal can be a great starting point to reduce bounce rates and increase the time a user stays on your page—a.k.a. Average session duration.
2. Average Session Duration
Average Session Duration measures how long users are actively engaged on your website during a visit. It's calculated by totaling all session durations across your site and dividing by the number of sessions.
Longer average session durations signal you provide valuable, relevant content that engages visitors. Short durations may indicate the content isn't resonating with users or site navigation needs improvement.
The average session duration across SaaS websites participating in the survey is 77.61 or 1 minute 17 seconds.
Formula:
Total Session Duration / Number of Sessions
For example, an ecommerce site has 5,000 sessions in a month for 15,000 minutes. The average session duration would be 15,000 / 5,000 = 3 minutes.
An analytics tool like Google Analytics or Factors will automatically calculate and display this data on your website tracking screen.
This aligns with general benchmarks. If the duration was lower, the site owner could look to improve content quality or navigation to drive up engagement.
3. Scroll Depth

Scroll depth measures how far down a page visitors scroll before leaving. Higher scroll depth indicates engaging content.
Typically, a scroll depth of 50% or more means that your content is resonating with visitors. And anything lower should be a cue that you need to spend time optimizing that piece of content.
For example, your latest blog post sees an average scroll depth of 25%, meaning most visitors bail out after reading just the first 1/4 of the content.
In response, you shorten the intro paragraph, add subheads, break content into shorter paragraphs, and include visuals after every few sentences—these changes drive scroll depth to 65%, helping your users engage further.
4. Social Media Engagement
Social media engagement rate measures the amount of engagement (likes, shares, comments) a post gets compared to reach. Higher rates indicate content resonates.

Powerful analytics tools like Factors can help you bring together data from across different social media platforms into a single place—giving you a single source of truth (SSOT) dashboard.
How to calculate social media engagement:
(Likes + Shares + Comments) / Followers x 100 = Engagement Rate
For example, if you had 30 total likes, shares, and comments over 1,000 Facebook page followers last month, your engagement rate would be:
30 / 1,000 x 100 = 3%
Average engagement rates vary widely by platform. Here are the average social media engagement rates for Technology businesses.
- Instagram: 1.48%
- Facebook: 0.96%
- X (Twitter): 1.26%
- LinkedIn: 1.53%
- TikTok: 1.20%
The key is not to compare your engagement rate to others in your niche. Rather, track it over time to see if your rate increases or decreases month-to-month.
5. Customer Satisfaction (CSAT) Score
The CSAT score measures customer satisfaction with service interactions, often via surveys. Higher CSAT correlates with better engagement and loyalty.
Typical survey questions ask customers to rate their experience on a 1-5 or 1-10 scale, from very unsatisfied to very satisfied. The percentage of positive responses becomes the CSAT score.
The numbers below can range from 0% to 100%. For example, a score of 75% means that 75% of the users who answered the survey are satisfied with the product/service.
According to Fullview, CSAT benchmarks by industry are:
- Software - 78%
- Retail - 80%
- Internet providers - 64%
For example, an ecommerce company surveys customers and finds:
- Fifty customers responded 9 or 10 for "very satisfied."
- Twenty responded 7 or 8 for "satisfied."
- Ten responded six or below for "unsatisfied."
The CSAT score is 50 very satisfied / (50 very + 20 satisfied) = 71%
6. Net Promoter Score
The NPS survey measures customer loyalty and likelihood to recommend on a 0-10 scale. Higher NPS indicates growth potential through referrals.

NPS is calculated by finding the percentage of customers who are:
- Promoters (9-10 score): loyal enthusiasts who will promote your brand
- Passives (7-8): satisfied but unenthusiastic
- Detractors (0-6): unhappy customers who can damage your brand image
Subtracting the percentage of Detractors from Promoters yields the NPS.
Retently ran NPS benchmarks for different industries. Here are two industries relevant to us:
- Software - 64+
- Consulting - 67+
For example, a SaaS business surveys customers and finds:
- Promoters: 70%
- Passives: 10%
- Detractors: 20%
Their NPS is 70% - 20% = 50%. This is on the lower end for software businesses, revealing opportunities to improve loyalty and satisfaction.
Track your NPS over time to see if it's improving or declining. If it is declining, try to talk to your detractors and understand if there’s a fixable problem that’s causing customers to rate you lower.
When you find something, start by fixing it and announcing that you’re taking steps in the right direction. This will help your customers know that you aren’t simply collecting surveys but also working on them.
7. Net Dollar Retention (NDR)
The NDR compares recurring revenue from existing customers period-over-period. Rising NDR indicates expanded purchases from engaged customers.
Formula:

A report by Benchmarkit (formerly RevOps Squared) reveals that the median net dollar retention is 105%, where a 100% NDR falls in the 75th percentile.
For example, a SaaS had $1M in revenue from existing customers last quarter. This quarter's revenue was $1.1M, with $100K from upsells but $50K lost from churn. Their NDR is:
(($1.1M + $100K - $50K) / $1M) x 100 = 115%
This exceeds the 105% median, demonstrating solid expansion and engagement from the existing customer base. That brings us to customer churn, a measure of how many customers leave after signing up.
8. Customer Churn Rate
The churn rate measures the percentage of customers lost in a period. Lower churn signifies higher satisfaction and engagement.
Here’s the formula to calculate churn:
(Customers Lost / Starting Total Customers) x 100
CustomerGauge released an NPS and retention report in the B2B industry. The median churn rate for IT services is 12%, and that for the software industry is 14%.

To benchmark your churn rates, check this example out. As a SaaS, suppose you had 1,000 customers last quarter and lost 75 of them. The churn rate will be calculated as below:
(75 / 1,000) x 100 = 7.5%
This is well below the 14% median churn for software businesses. However, that does not mean you should ignore it and move on. Reducing churn helps boost revenue growth so you can improve the onboarding process, account management, customer experience, and even retention promotions.
The lower your churn, the better. High churn signals poor customer engagement and satisfaction. Dig into why customers leave and address weak points across marketing, product, service, and other areas driving attrition.
9. Customer Lifetime Value (CLTV)

CLTV estimates future revenue a customer generates over their lifetime relationship with the company. Higher CLTV indicates greater engagement and business value.
Formula:
Average Order Value x Purchase Frequency x Average Customer Lifetime
According to CustomerGauge’s reports, the software industry has a CLTV of US$ 240,000, while a business consultancy has an average CLTV of $385,000.
However, this may not represent the indie startups or smaller SaaS businesses with 1-10 employees.
How can you determine your CLTV? Let’s look at it through an example.
A SaaS customer subscribes to a monthly plan costing $500. They remain active for four years. Their CLTV is:
$500 x 12 x 4 = $24,000
As you can see through this formula, boosting retention length, increasing the subscription prices, asking users to upgrade to better plans, and improving CX can help boost your customer lifetime value.
10. Daily/Monthly Active Users (DAU/MAU)

DAU/MAU measures daily and monthly active usage of apps and software. Higher ratios signify strong engagement and retention.
Sequoia tweeted that the average number of DAU/MAU for most businesses is lower than 20%. Very rarely does a business cross the 50% threshold. Whereas, with WhatsApp, the DAU/MAU hits 73% on average and is one of the highest recorded numbers.
To determine the DAU/MAU for your business, check your analytics for the total monthly active users. Then, check the daily active users.
For instance, if your daily active users are 1000 and your monthly active users are 5000, your DAU/MAU will be—1000/5000 * 100 = 20%
A lower percentage signals an opportunity to improve retention and engagement through changes to the user experience, onboarding, notifications, and loyalty programs.
Mistakes to Avoid When Measuring Engagement
While it's critical to track customer engagement KPIs, it's just as important to avoid these analysis and reporting mistakes:
- Using arbitrary targets without research—Don't randomly choose target metrics without researching realistic industry benchmarks and averages. Basing goals on competitive data provides an objective comparison point for whether your engagement levels are truly high, low, or average.
- Over-reliance on quantitative data—Hard metrics only reveal part of the engagement story. Supplement with qualitative data through post-transaction surveys, customer interviews, focus groups, and monitoring reviews. This provides context into the "why" behind metrics.
- Data silos across teams—Break down silos between marketing, sales, support, and product groups. Share insights cross-department to improve engagement holistically across the customer journey.
- Obsessing over vanity metrics—Don't fixate on vanity metrics like website visitors, email subscribers, or social followers. These don't measure true engagement or business impact. Focus on metrics tied to outcomes.
- Forgetting ongoing analysis—Don't just report metrics—actually act on what they tell you! Research why engagement levels change over time and continue optimizing based on insights.
How a Platform Like Factors Can Help
Trying to measure customer engagement across your business can get messy fast. You've got data in all these different places—your website, email stats, support tickets, social media, etc.
And those sources almost never talk to each other. So you're stuck manually pulling reports from individual tools and then trying to make sense of fragmented data to see the big picture. Not fun.
That's where Factors comes in.
It's an analytics platform that brings all your customer data together in one place. Finally—a single source of truth!
1. Unified Data and Reporting
Factors connects your data from sources like your website, CRM, marketing campaigns, customer support channels, and more. This provides a complete view of engagement across touchpoints on one centralized dashboard.

You can instantly analyze metrics by various segments like channel, campaign, cookie ID, account, geo, device, and more without tedious exports or merges between tools. Trend reporting over time is also streamlined.
2. Flexible Goal Tracking
Factors gives you the flexibility to define and track engagement KPIs tailored to your specific business needs. For example, you may track CES for support and email campaign CTR. Determine the metrics most aligned with your goals, then track performance over time.
3. Account Identification and Scoring

A challenge with engagement data is connecting metrics across anonymous and known users. Factors uses proprietary IP resolution to identify anonymous traffic at an account level.
From there, you can easily segment and filter accounts based on attributes like industry, tech stack, and more. Apply scoring models to tag accounts from highly engaged to at-risk based on your criteria.
The major benefit of Factors is its unified approach. Since it connects data from ad campaigns, websites, G2 pages, and more together, it can help you score leads considering customer engagements across all these platforms instead of basing decisions on single-platform engagements.
4. Customizable Dashboards and Reporting

Factors enables customizable reporting segmented by channel, campaign, account, and other attributes. Easily create leaderboards and reports for key metrics and trends visible to stakeholders company-wide.
You can also build customized dashboards with charts and breakdowns for different teams like marketing, support, and sales. And along with that, it’s enhanced automated reporting ensures insights are readily accessible whenever you need them.
5. AI-Driven Recommendations

Factors takes insights further by providing AI-powered recommendations to improve engagement. The system analyzes changes in metrics and suggests actions to boost performance.
For example, if you type in something like “how do I improve my demo submissions”, Factors will run AI-fuelled algorithms in real-time and offer a list of touchpoints that are already working and can be optimized to achieve the desired result.
This centralization of engagement data helps you uncover insights instantly with Factors—helping you make smarter decisions and optimize experiences faster.
Start Using Customer Engagement Metrics And Build Customer-Focused Strategies
Tracking engagement gives you priceless insights into the customer experience. With the right data, you can spot friction points, find your best segments, and unlock growth opportunities.
But collecting all this data sounds easier than it is. Website stats live in your analytics platform. Email reports need downloading. Support tickets sit in a separate system. Stitching it together feels like a puzzle.
That's why Factors comes in handy.
It automatically brings data together from your website, ads, email, support, and more. Now you have a single view of engagement across touchpoints.
Factors also lets you define the metrics most important to your goals.
Want to track demo requests and trial signups? No problem—you can monitor the KPIs for your unique business needs.
The platform identifies known accounts from anonymous traffic so you can filter and segment at the account level. With Factors, you can build custom dashboards to share key metric trends and insights across your teams.
Its AI-powered recommendations analyze changes in your data and suggest ways to optimize engagement.
Measuring Customer Engagement
Customer engagement drives business growth, loyalty, and long-term profitability. Engaged customers buy more, advocate for your brand, and are less likely to churn. However, measuring engagement requires more than surface-level metrics like social media likes or email open rates. Businesses need data-driven insights into how customers interact across various touchpoints.
Customer engagement metrics reveal how customers connect with your brand over time. These include bounce rate, session duration, scroll depth, social engagement, Net Promoter Score (NPS), customer satisfaction (CSAT), churn rate, and customer lifetime value (CLTV). Tracking these metrics helps businesses optimize the customer experience, reduce churn, and uncover opportunities for growth.
For startups and B2B teams, connecting engagement data across platforms can be challenging. Tools that unify data from websites, CRM systems, support platforms, and ad campaigns simplify tracking and analysis. Real-time dashboards, account-level insights, and AI-powered recommendations enable teams to proactively identify disengaged customers and refine their marketing and sales strategies.
Focusing on meaningful engagement metrics allows businesses to shift from vanity performance indicators to data-backed strategies that drive revenue and customer retention.
Want to learn how Factors can help enhance your customer engagement and experience? Book a demo today!
.webp)
B2B Marketing Personalization: Building Tailor-Made Journeys
Now more than ever, B2B deals involve shrewd, inquisitive buyers. Generic marketing strategies are no longer sufficient to capture customer attention or loyalty. Instead, marketing personalization plays a crucial role in building trust and intent amongst buyers.
B2B marketing personalization is about creating tailor-made user experiences that convey a feeling of empathy and validation. It's about replacing broad, generic messages with personalized marketing efforts based on your target audience. The following article explores several ways to personalize your B2B marketing efforts.
B2B Marketing Personalization
Personalization is quickly becoming a buzzword in the industry but with good reason. It's a powerful marketing approach that drives better results and builds stronger connections with your audience.
Imagine you walk into a cafe, and the barista greets you by name, asks about your day, and already knows your usual order. You’d feel special, wouldn't you? You’d probably be encouraged to become a regular customer. This is, in essence, the objective of personalization; it makes customers feel valued and understood.
To personalize your marketing efforts, the first step is to gather relevant information about your customers' demographics, pain points, use cases, concerns, engagement behavior, and more. Once all this data is in place, it can be leveraged to customized experiences on your website, emails, social media, and ads.
To make the data collection easier, you can build a custom software tool that collects data of users who visit your website and integrate it into the website. Of course, there are software outsourcing companies you could task with this. The tool should be such that when users visit your website or interact with your ads, it will collect their behavior and preferences, like what they click on and what they aren’t interested in. You can then use this data to target the ads you show to them. This leads us to...
Personalized Targeted Advertising
One of the most common use cases of personalization is targeted advertising. Have you ever searched for a product online, and suddenly, ads for that exact product started following you around the internet? That's not a coincidence; it's targeting.
A lot of advertisers are now using tracking technologies to gather engagement data and leverage this information to display ads that are more relevant to users.
But personalization goes beyond just ads. It extends to the entire user experience. This level of personalization makes the shopping experience more convenient and enjoyable. And most importantly, they can sell more because of those strategies.
Personalized Mail and Content marketing
Email marketing is another opportunity to leverage personalization and enhance user experience. Do so by segmenting your audience and sending them tailored messages based on their engagement. This is far better than simply sending generic mass emails to all subscribers, regardless of their differences.
You can also leverage personalization in your content: think blog posts, videos, and social media posts. When you’ve gained insights into your audience's preferences, challenges, and goals, you can create content that resonates with them on a deeper level. This will help establish your brand as a trusted resource and help build a loyal community of followers. Even in the case of eCommerce, users delivering personalized content is the key to generate more sales. You can do this by leveraging merchandising feature of the best digital experience platforms out there.
Personalized Website Experiences
With the advent of GenAI, chatbots and virtual assistants work better than ever to provide personalized assistance based on user inquiries and previous interactions. By understanding the context and history of a customer's interaction with the brand, these AI-powered tools can offer tailored solutions and recommendations, thereby enhancing the overall customer experience.
Personalized Social Media Experience
Social media platforms also offer opportunities for personalization. Start by delivering targeted content and advertisements to the right users. Not every social media user cares about that paint ad you recently published. When you target the right ads to the right audience segment, you increase the content's relevance and maximize the impact of your marketing efforts.
Prioritize Privacy While Acquiring Data
It's essential to strike a balance with personalization. While customization can enhance the user experience, it’s of utmost importance that you respect user privacy.
Let your customers know how their data will be used and give them control over their preferences. Respecting boundaries builds trust and ensures that personalization remains a positive experience for both parties. Implementing personalization strategies requires combining technology, data analysis, and creative thinking.
Wrapping up
Leverage data and technology, and you’ll be able to deliver targeted advertisements, personalized website experiences, tailored content, and customized customer support.
However, never forget to strike a balance between personalization and privacy. Respect user boundaries and ensure transparency in data usage.

Marketing Performance Measurement - Challenges & Solutions
Increasingly, marketing performance measurement has become the heartbeat of every SaaS go-to-market function. Marketing performance measurement serves a dual purpose: first, it determines if marketing is indeed working towards business objectives, and two, it supports efficient resource allocation to ensure every marketing dollar counts towards revenue
Marketing Performance Marketing - A Tale of Two Meetings
Let’s begin our journey by exploring the duality of marketing performance measurement:
Meeting 1: In the C-Suite
Imagine a high-stakes C-level executive meeting in a sleek boardroom, where the CMO stands front and center, under the spotlight.
Their mission? To prove that Marketing isn't just a department spending dollars; it's the strategic lever pushing the business towards its objectives. The CMO seeks to demonstrate marketing's contribution to the bottom line. This is where the first challenge unfolds.
The CMO's Dilemma
The CMO shoulders the responsibility of showcasing how marketing aligns with the overarching business goals. Their primary goal is to guarantee that every marketing initiative enhances the efforts of other departments, including Sales, Customer Success, and Product. The ultimate aim is evident:
- Achieve Alignment - The CMO must navigate the labyrinth of business objectives and show how marketing's compass is set in the same direction.
- Get Budgets Approved - To secure the necessary resources, the CMO must articulate how marketing initiatives are essential to drive the business forward.
- Show the Impact of Marketing -In the eyes of the C-suite, the CMO must demonstrate that Marketing is more than a cost center — it's a revenue generator and a strategic asset.
This objective revolves around three key goals:
- Achieving alignment
- Securing budgets
- Demonstrating the impact of marketing
The CMO's journey is riddled with challenges. They must define and measure marketing success in a way that resonates with the broader business goals. It's a complex task that goes beyond mere clicks, traffic, or conversions.
Meeting 2: Within the Marketing Team
Shift gears to an intense Marketing Team meeting. Here, the scene is all about competing priorities. Each marketing leader is striving to secure their share of the budget pie, aiming to maximize their team's performance. It's a complex puzzle, one that requires a judicious allocation of resources to different marketing functions.
In both meetings, one factor is evident: Marketing's performance holds the key to success, but measuring that performance is easier said than done. Let's delve into the intricacies of these measurement challenges.
Challenge With Marketing Performance Measurement
The challenges with defining and measuring marketing performance is a tale of two perspectives:
- 1. High-level business objectives in the C-suite
- 2. Granular resource allocation within the marketing team
Challenges for C-level Executives in Assessing Marketing Performance
C-level executives are tasked with the critical role of assessing marketing performance. From the perspective of a CMO in the CXO meeting, the objective remains clear: to establish how marketing significantly impacts business goals and aligns with other teams, amplifying their work.
1. Proving Marketing ROI and Influence on the Pipeline
One of the critical challenges that C-level executives face is proving marketing return on investment (ROI) and measuring marketing's influence on the pipeline. The pressure to demonstrate that every dollar allocated to marketing translates into tangible results weighs heavily on the CMO's shoulders. Here, it's no longer enough to highlight vanity metrics; the focus is on metrics that directly tie marketing initiatives to revenue. It's about showcasing the journey from a marketing touchpoint to a closed deal.
2. Justifying Marketing Investments
Another challenge they often grapple with is the need to justify marketing investments. In an environment where every expenditure needs to be justified, marketing budgets come under tight scrutiny. The CMO must make a compelling case for why marketing deserves a significant share of the financial pie. This involves presenting not just the historical performance data but a strategic roadmap that lays out how marketing investments will contribute to the company's growth trajectory.
3. Improving Budgeting and Resource Allocation
Striking the right balance in budgeting and resource allocation is an intricate puzzle. C-level executives understand that underinvesting in marketing could stifle business growth while overinvesting could lead to budgetary constraints. The task is to allocate resources effectively, ensuring that marketing has the necessary tools to propel the business forward. The balance between short-term gains and long-term brand building must be maintained, a challenge that requires a strategic perspective.
4. Aligning Marketing Efforts with Overall Business Goals
To meet the objective of achieving alignment, executives must ensure that marketing efforts are in complete harmony with the broader business goals. The days of isolated marketing campaigns, driven solely by creative innovation, are long gone. The CMO's mission is to bridge the gap between marketing and other teams like Sales, Customer Success, and Product, ensuring that each department's work complements and amplifies the other.
5. Interpreting Marketing Data and Its Impact on Customer Experience
As you may agree, the world of marketing data is a labyrinth of numbers, charts, and graphs. The challenge lies in interpreting this data and understanding its real impact on customer experience. C-level executives can find themselves lost in this sea of information, struggling to discern actionable insights from vanity metrics. The CMO's role is to present data that tells a story, a narrative that highlights how marketing initiatives shape the customer experience and ultimately drive business growth.
These challenges aren't isolated; they are interconnected facets of the CMO's quest to prove marketing's worth in the CXO meeting. The following sections will delve into the specific strategies and solutions that can help C-level executives overcome these challenges and showcase the true impact of marketing on the bottom line. Through real-world examples, case studies, and analogies, we'll shed light on how business alignment is not just an aspiration but a tangible achievement in the realm of modern marketing.

Example: Adidas' Data-Driven Attribution Success Story
To illustrate how organizations have effectively addressed the challenge of substantiating marketing ROI and measuring marketing's influence on their business outcomes, we can examine the data-driven attribution success achieved by the global footwear giant, Adidas.
Adidas, a prominent player in the athletic and sportswear industry, identified a significant gap in its ability to measure the return on investment effectively. In a fiercely competitive market, understanding the impact of marketing became pivotal, and Adidas recognized that its existing strategies fell short of delivering precise results.
Adidas confronted the challenge of precisely measuring the return on its marketing investments. Despite its stature, the company found itself falling short in accurately gauging the impact of marketing endeavors, especially in the highly competitive landscape of sports and lifestyle apparel.
So, how did Adidas address this challenge?
1. Data-Driven Marketing Strategy
Adidas embarked on a comprehensive data-driven marketing strategy, leveraging state-of-the-art data analytics tools, machine learning, and artificial intelligence. Through these technologies, they meticulously traced every dollar invested in marketing, discerning its direct influence on their sales pipeline.
- Attribution Modeling:
Adidas implemented advanced attribution modeling, transcending the limitations of the last-click attribution model. This allowed them to attribute due credit to all marketing touch points, even those that contributed earlier in the customer journey. The shift in perspective unveiled the holistic impact of marketing interactions.
- Customer Journey Mapping:
Adidas undertook a detailed mapping of the customer journey, encompassing the various marketing touchpoints across different stages. This comprehensive view empowered Adidas to understand precisely how each marketing interaction influenced prospective customers at different points in their journey, transcending mere lead generation.
- Holistic Performance Reporting:
The company amalgamated data from diverse marketing channels and tools into a unified performance report. This consolidated view provided C-level executives with a crystal-clear, end-to-end depiction of how marketing endeavours directly contributed to the sales pipeline and, ultimately, revenue.
The Results:
Adidas's strategic adoption of data-driven attribution bore remarkable fruit. They achieved a substantial 15% increase in marketing-sourced leads and a remarkable 30% improvement in return on ad spends, as evidenced by Forbes.
In a nutshell, the Adidas case serves as a compelling example of how a data-driven approach can effectively address the challenge of proving marketing ROI and showcasing marketing's direct impact on the sales pipeline. By investing in advanced analytics, advanced attribution modeling, and a customer-centric methodology, Adidas not only demonstrated the ROI of its marketing initiatives but also uncovered opportunities for further optimization. It stands as a testament to how the alignment between marketing and overarching business objectives can be not only a goal but an attainable reality, delivering tangible results and substantiated ROI.
Challenges for Marketing Teams in Evaluating Performance
Marketing teams, from the perspective of a CMO in a marketing team meeting, face a different set of challenges in evaluating performance. They have the overall budget approved by the C-levels, and the pressure is on them to allocate it wisely across various initiatives. Here, the challenge is not just proving the value of marketing but also ensuring that every marketing dollar is spent with precision and purpose.
1. Measuring and Analyzing Efforts
One of the foremost challenges marketing teams face is measuring and analyzing their efforts effectively. This involves collecting data from various channels and campaigns, a process that can quickly become convoluted. Ensuring that the data collected is accurate, relevant, and up-to-date can be a Herculean task. Marketing teams must grapple with tools and technologies that promise comprehensive data but often fall short in delivering insights that really matter and help them build a case.
2. Attribution Modeling and Performance Reporting
Attribution modeling is often perceived as a daunting task. Determining which marketing touchpoints contributed to conversions and how much credit each should receive is a complex web to untangle. Marketing teams can feel overwhelmed as they attempt to assign values to different marketing channels and efforts accurately. The challenge is to construct an attribution model that aligns with business objectives, a puzzle that often remains unsolved.
3. Demonstrating ROI and Proving Campaign Effectiveness
Marketing teams also face the pressure of demonstrating return on investment (ROI) and proving the effectiveness of campaigns. This involves looking beyond the surface-level metrics such as clicks and impressions and diving into metrics that directly correlate with business outcomes. It's not merely about reporting numbers but about telling a compelling story of how each campaign contributes to the bigger picture.
4. Allocating the Approved Budget Across Initiatives
From the standpoint of marketing teams, the CMO must wrestle with the challenge of allocating the overall budget approved by the CXOs across various initiatives. This isn't just about dividing the pie; it's about distributing it in a way that maximizes the ROI for each initiative. The task is to determine which channels, campaigns, and strategies deserve the lion's share of the budget and which should make do with less.
5. Picking the Right Channels
Choosing the right channels to invest in is often another challenge for marketing teams. The digital world is rife with options, and not all are equally effective for every business. Making the right channel choices can mean the difference between a successful campaign and a wasted budget. That said, marketing teams need to carefully consider their target audience, message, and objectives when deciding where to allocate resources.
6. Unifying Reporting
Another challenge lies in unifying reporting across various channels and campaigns. Often, marketing teams are inundated with isolated reports from different tools and platforms, making it difficult to see the big picture. The objective is to streamline reporting, making it comprehensive and coherent, so that insights can be drawn from a holistic view of marketing performance.
Measuring the Influence of Touchpoints in Unison
Long gone are the days of attributing success to individual touchpoints. Marketing teams must now focus on measuring the influence of touchpoints in unison with each other. Understanding how different channels work together to lead a prospect down the conversion path is a multifaceted challenge. The CMO must guide the team in constructing a performance measurement framework that considers the synergy between touchpoints.
This section will explore solutions to these challenges, drawing from real-world B2B examples, case studies, and analogies that help demystify the intricacies of marketing performance measurement at the ground level. The aim is not just to uncover the problems but to provide actionable insights for CMOs and marketing teams to overcome these hurdles effectively.

Example: OneSpot's Attribution Modeling Revolution
We’ve already seen how C-levels can resolve marketing measurement-related concerns. Now, to exemplify how marketing teams can address the challenge of attribution modeling and performance reporting, let's take a peek into OneSpot's transformative journey.
OneSpot, a renowned inbound marketing and sales software company, realized the need for a more sophisticated approach to attribution. Like many other marketing teams, they were grappling with assigning proper credit to various touchpoints in the buyer's journey.
So, what did they do?
Holistic Attribution Model
OneSpot transitioned from a simplistic first-touch or last-touch attribution model to a holistic attribution approach. They introduced a custom attribution model that factored in multiple touchpoints throughout the customer's journey. This shift allowed them to accurately assess the role each touchpoint played in conversions.
Unified Reporting
OneSpot integrated various marketing channels and tools into a unified reporting dashboard. This dashboard provided marketing teams with a comprehensive view of their efforts' performance. It allowed them to see how different channels and campaigns interacted and influenced one another in the conversion process.
Machine-Learning for Attribution
OneSpot leveraged machine learning algorithms to automatically assign credit to different touchpoints. This data-driven approach ensured that attribution was based on actual data patterns rather than subjective judgments. It eliminated the bias that often crept into manual attribution methods.
Data-Backed Decisions
By implementing these changes, OneSpot not only enhanced its attribution modeling but also made data-backed decisions regarding budget allocation. The marketing team could clearly see which channels and campaigns were most effective at different stages of the customer journey. This allowed them to optimize resource allocation for maximum impact.
OneSpot's journey is a prime example of how marketing teams can navigate the challenges of attribution modeling and performance reporting. By embracing advanced attribution models, unifying reporting, and leveraging technology like machine learning, they transformed the way they assessed marketing performance. The above example we just saw, illustrates the practical steps that CMOs and marketing teams can take to address these challenges effectively and ensure that every marketing dollar is spent with purpose and precision.
Bridging the Gap: Strategies for Improved Measurement
Understanding the challenges faced by both C-level executives and marketing teams, it's clear that a bridge must be constructed to close the gap between expectations and operational realities. Here, we offer actionable strategies to enhance marketing performance measurement and foster collaboration between CXOs and marketing teams.
For C-Level Executives
1. Educate and Equip
C-level executives need to invest in understanding the complexities of modern marketing. This means not only asking for data but also having the knowledge to interpret it. Education in digital marketing trends, analytics, and performance measurement can be invaluable.
2. Set Clear Objectives
Establish unambiguous objectives for marketing efforts that align with broader business goals. Make it a collaborative exercise, involving marketing teams in the goal-setting process to ensure realistic and feasible targets.
3. Regular Reviews and Alignment
Implement regular review sessions where marketing teams present their findings, challenges, and plans to the C-suite. This keeps everyone on the same page and helps to identify and address bottlenecks promptly.
4. Innovation Budget
Allocate a portion of the marketing budget to innovation and experimentation. Encourage marketing teams to explore new tactics and technologies that might yield long-term benefits, even if they are harder to measure in the short run.
For Marketing Teams
5. Enhance Data Collection
Invest in data collection tools and methodologies that provide a holistic view of marketing performance. This includes incorporating cross-channel tracking and ensuring data accuracy.
6. Focus on Customer Journey Mapping
Instead of isolated touchpoint measurements, concentrate on mapping the customer journey. Understand how different channels influence prospects at various stages, allowing for a more comprehensive performance evaluation.
7. Collaborative Reporting
Develop a standardized reporting format that incorporates both high-level metrics for the C-suite and detailed analytics for internal use. This ensures that every team member, from CMOs to data analysts, can interpret and act on the data effectively.
8. Continual Learning
The marketing landscape evolves rapidly. Encourage and enable your team members to upskill by staying updated with the latest developments within the industry, emerging trends and technologies. Investing in employee training and development can significantly impact performance.
Joining Hands: Collaboration and Alignment
A significant component of bridging the gap between C-level executives and marketing teams is fostering collaboration and alignment. At the cost of sounding cliche, this means both parties need to work together, understanding each other's challenges and priorities. Establish cross-functional teams where marketing, sales, product, and customer success work together on joint initiatives. This approach helps break down silos, promotes data sharing, and accelerates the achievement of common goals.
The benefits of this collaboration are substantial. C-levels gain a deeper understanding of the intricacies of marketing performance, while marketing teams feel more empowered and supported in their endeavors. The two groups can collectively evaluate the effectiveness of different marketing strategies and tactics, making informed decisions on how to allocate budgets more effectively.

Bridging the Gap for Optimal Performance
In B2B marketing, addressing the challenges surrounding performance measurement is essential. Understanding the nuances of these challenges from both the C-level executive perspective and the marketing team's viewpoint is the first step towards bridging the gap. By implementing actionable strategies and fostering collaboration, businesses can achieve optimal marketing performance measurement, align marketing efforts with broader business goals, and showcase marketing's true impact. In this quest for better measurement, both C-level executives and marketing teams must work hand in hand, guided by a shared commitment to success.
.webp)
Time Decay Attribution Model Explained
You’ve tested your product to market fit and you’re seeing an amazing response to your solution across the board.
But you're not growing at the pace you’d like. Maybe you’re unable to reach your target audience, maybe your ad campaigns aren’t working as expected, maybe your website isn’t up to par, or maybe sales reps are dropping the ball.
It’s overwhelming. To sort through multiple marketing and sales channels, to pinpoint where the problem is and allocate spends efficiently.
Out of all the marketing attribution models, time-decay attribution proves to be one of the most effective models when facing the challenges of business growth.
What is Time Decay Attribution?
The time decay attribution model assigns credit to customer touchpoints across the marketing and sales funnel based on their temporal proximity to a conversion goal. It recognizes that interactions closer to the conversion point have the most significant impact. Accordingly, it gradually diminishes the credit assigned to earlier touchpoints.

Picture a company trying to understand how customers decide to sign up for their product. Along the customer's journey, buyers first see an ad on a tech blog a few months ago. Then, they attend a webinar, and finally, they receive a targeted mail, prompting them to convert.
Using a time decay attribution model, the email they received just before the conversion gets the most credit (50%) because it had the most immediate impact. The webinar would recieve some credit (30%), and the initial ad (20%) would receive the least credit.
This model recognizes that while all interactions play a role, their influence varies over the customer journey from the first touch to conversion. It helps companies see which touch points were most influential, allowing them to fine-tune their marketing strategy accordingly.
Why The Time Decay Attribution Model Matters
A variety of attribution models exist, including First Interaction, Last Interaction, Linear, Position-based, and Time Decay. Each has their own benefits and limitations based on the nature of your business.
Generally, the last click model has been the most popular but it can be heavily limiting as it’s a single-touch model that attributes conversions solely to the last touchpoint. As you might expect, this doesn't account for the contribution of previous touchpoints that led to the conversion. While this might be suitable for most B2C brands looking to see what channels drive the most conversions, it fails to capture the complexity of a lengthy, non-linear B2B sales cycle.
Let’s take a multi-touch model: linear attribution. This model assigns equal credit to all traffic sources, treating them uniformly, but it might not fully reflect reality. Each channel impacts decision-making differently, and giving them equal credit might be a limiting view for companies looking to optimize their marketing efforts and shorten their sales cycle.
Here’s where time decay attribution models fit in. Time decay attribution strikes a balance between giving credit to all relevant traffic sources in reverse order, and how each channel contributed to the decision-making process.
Benefits of Time Decay Attribution
Much like other attribution models, the time decay model has its unique benefits and limitations. Here are a few things to consider before you implement a time decay attribution model.
1. True-to-Life B2B Attribution
In reality, each GTM channel has a unique life cycle, leading to natural performance fluctuations over time. Identifying these changes promptly represents a significant chance for enhancing results, and Time Decay offers a means to seize this opportunity.
This is because Time Decay assigns greater weight to the most recent touchpoints, it amplifies the influence of significant performance fluctuations within those sources on the overall outcomes. Consequently, the utilization of Time Decay empowers a more reliable method for determining the priority of pipeline sources that require immediate attention and improvement compared to other attribution models.
2. Best for Conversion Optimization
The Time decay attribution model's benefit lies in its capacity to enable you to focus on actions that yield the most immediate results. Additionally, it helps identify critical late-stage touchpoints, often overlooked by alternative models, including strategies pertaining to bottom-funnel marketing and sales.
3. Enhanced Customer Journey Representation
Conventional attribution models tend to oversimplify the customer journey by uniformly distributing credit among all touchpoints or solely attributing it to the first or last interaction. In contrast, the time decay model meticulously considers the timing of each interaction, resulting in a more precise depiction of the customer journey.
Moreover, it facilitates the comparative assessment of campaign or channel performance over time, introducing a layer of predictability as marketers can anticipate consistent attribution patterns across various campaigns.
4. Adaptable for Tailored Applications
The Time Decay Attribution Model boasts remarkable adaptability, permitting customization to align with specific requirements. For example, it allows for the adjustment of weightage on recent interactions or the prioritization of specific channels to suit particular needs.
Take the example of a travel company, where placing greater emphasis on the last interaction or channel before booking a trip can offer deeper insights into the decision-making process, as travel decisions often manifest close to the departure date, making recent interactions more influential.
In cases like these, the time decay rate can be reduced to account for external influence.
5. Easy to integrate with other models
Integrating the insights gained from the time decay model with other data sources provides a comprehensive perspective of your marketing strategies.
For instance, many B2B companies observe that direct searches are the last event before a user subscribes to their solution. In these instances a time decay model can be combined with a position-based model, helping give higher credit to touchpoints that contributed to opportunity creation before the final sale took place.
Limitations of Time Decay Attribution
1. Weighted Focus on Recent Interactions
This model places a heightened emphasis on touchpoints that are in close proximity to the conversion event. Although this approach yields valuable insights into the effectiveness of strategies for driving conversions, it may unintentionally downplay the significance of initial touchpoints.
In cases involving deliberate and well-considered purchases, such as enterprise sales, customers engage in extensive research and comparison, late-stage interactions may receive an overemphasized credit. This could potentially result in an excessive allocation of resources to strategies aimed at closing sales, while inadvertently neglecting those designed to attract and nurture leads.
2. Greater Complexity
Due to the complexity of the model, it may not be beneficial for companies at different stages in their growth journey. The companies that are just starting out and looking for a product-to-market fit, may benefit more from first-touch attribution, rather than the time decay model, which will require a lot of resources.
Challenges With Implementing Time Decay Attribution Model
As mentioned above, the time decay model can be complex and difficult to implement.
Since attribution relies heavily on data, one of the biggest challenges when implementing any attribution model is the accuracy of data.
But oftentimes, social media attribution tools such as Facebook ads, and analytic tools such as Google Analytics show discrepancies in data when compared to one another.
Account-based marketing solutions can sieve out these interactions, creating a more concise data set to derive insights.
This also helps address another of the challenges faced by marketers and entrepreneurs, when working with time decay attribution. It is to use a refined data set that excludes sessions that lack meaningful engagement, such as quick bounces. You can also filter out sessions with little or no activity, and guarantee that the data you analyze represents genuine user interactions.
Time Decay Attribution for Smarter Marketing Decisions
If your product has a strong market fit but isn’t growing as expected, ineffective marketing attribution could be the issue. Time decay attribution helps businesses identify the most influential touchpoints by assigning higher credit to interactions closer to conversion. Unlike single-touch models, it acknowledges the cumulative impact of multiple engagements throughout the customer journey.
This model is particularly beneficial for B2B sales cycles, where decision-making is complex. It enables conversion optimization, provides a realistic representation of customer interactions, and integrates with other attribution models.
Looking to get started with time-decay multi-touch attribution modeling? See why Factors might be a great fit for you.
.webp)
11 Lead Scoring Software Tools For B2B SaaS
The race to find the most effective lead-scoring software in 2023 is on.
The competition to convert prospects into customers pushes marketers to use advanced lead-scoring tools to gain an edge.
Lead scoring software platforms analyze behavioral data and activity to identify hot leads, route them faster, and boost sales. But the important part is to pick the most effective one.
In this guide, we look at the top 11 platforms heating the lead-scoring arena. We'll uncover the unique features of each and help you identify the one lead-scoring tool that can take your lead gen to the next level.
Let’s get started.
TL;DR
- Lead scoring helps identify and prioritize high-value prospects based on engagement, attributes, and behaviors.
- When evaluating solutions, look for predictive lead scoring, account intelligence, journey analytics, and integrations.
- Factors provides the most comprehensive account intelligence to optimize targeting and engagement. It goes beyond essential scoring to analyze account health, revenue potential, and more with AI.
- ZohoCRM offers various capabilities like lead management, workflow automation, and predictive lead scoring to streamline the sales process. However, its UI can be difficult for new users.
- Salesforce Einstein leverages AI and machine learning to deliver real-time insights, next-best-action recommendations, and content within workflows. However, it lacks flexibility with integrations.
- HubSpot combines powerful CRM, marketing automation, email marketing, and analytics in one platform. It offers robust features but needs more AI capabilities.
- Freshsales maximizes sales pipelines with lead scoring, deal insights, automation, and other capabilities. Its UI could use some improvements for ease of use.
- ActiveCampaign provides end-to-end marketing automation with advanced lead scoring and Salesforce integration. However, support responsiveness needs improvement.
- EngageBay combines CRM and marketing automation tailored for SMBs with lead scoring and segmentation. But key analytics features require add-ons.
- Adobe Marketo enables personalized cross-channel experiences with marketing automation, analytics, and AI. However, its UI for campaigns needs refinement.
- Monday.com brings key sales capabilities into one intuitive, customizable platform. But it requires time for proper setup and customization.
- Platformly centralizes and automates marketing operations, including basic CRM and email. Its interface and documentation need improvement.
- Pardot focuses on lead nurturing, marketing automation, and CRM integration. However, it has limited social media integration and reporting capabilities.
- Aligning sales and marketing with shared CRM and automation tools improves conversions.
- Solutions range from standalone scoring to full suites like CRM and marketing automation.
- Pricing varies based on features like contacts, AI capabilities, and number of users. Most offer multiple tiers.
What Should You Look for in a Lead Scoring Tool?
When it comes to driving sales, not all lead-scoring tools are created equal. But what should you look for when evaluating options? Let’s go through the must-have features of an excellent lead-scoring tool.
- Predictive Lead Scoring: Rule-based lead scoring is old school. And while it may work, predictive lead scoring is where we’re now. These tools use artificial intelligence and machine learning to analyze data points to predict which leads will most likely convert. Unlike the rule-based approach, predictive lead scoring helps you “set-it-and-forget-it”. .
- Comprehensive Account Intelligence: You need more than just names and emails to understand your leads. Comprehensive account intelligence gives you a 360-degree view of their behavior, needs, and potential value. This allows you to create hyper-targeted campaigns that convert like crazy.
- Insight Into Customer Journeys: Understanding the journey leads take through your sales funnel provides a roadmap to conversion. It helps you see exactly how and when to engage each lead to boost conversions. This is especially useful for account-based marketing teams who need to track touchpoints.
- Integrations With Other Tools: Your scoring tool can't live in a silo. It must play nicely with your other martech tools like CRM, email, and analytics. Look for a range of integrations to connect the dots seamlessly.
- Intuitive UI: An intuitive user interface helps your team focus on what matters most—converting and leads. Complicated UIs slow everyone down and lead to errors. Make sure it's human-friendly!
- Customizable Reporting Options: Granular data and customizable reporting help uncover the insights you need to optimize your strategy. Track specific KPIs, monitor campaign performance, and more with the flexibility to slice and dice.
Top 11 Lead Scoring Software of 2023
Let’s start with the top lead-scoring software tools in 2023.
1. Factors

Factors is an AI-powered account intelligence platform tailored to the needs of B2B sales and marketing teams. It goes beyond essential lead scoring to provide comprehensive account insights that drive revenue growth.
{{CTA_BANNER}}
With Factors, you get a 360-degree view of your target accounts by analyzing behavioral, firmographic, and technographic data signals. The platform uses predictive analytics and machine learning to model account health, engagement, and revenue potential.
This actionable intelligence lets you identify high-value accounts, uncover growth opportunities, and personalize engagement across channels. If you're looking to boost ABM impact and align sales and marketing on what matters most, Factors is a go-to solution.
“Factors lead generation and nurturing capabilities have been instrumental in helping us identify and engage with high-value prospects. By providing us with real-time insights into website visitor behavior, we can quickly identify and nurture leads and move them along the funnel.” — Soumya M.
Key Features
- Predictive Lead & Account Scoring: Factors analyzes multiple attributes with AI to model account potential and prioritize your outreach accurately.
- Account Intelligence Engine: Get a comprehensive view of your target accounts, including firmographic and technographic profiles, churn predictions, win probability, and more.
- Advanced Behavioral Analytics: Track channel engagement to inform your account-based strategies and campaigns. Identify areas of momentum and weakness.
- Journey Analytics: Analyze accounts' steps to optimize conversion touchpoints through your funnel. Factors' "Explain" feature highlights trends driving account progression.
What Users Say About Factors
“Factors has successfully optimized our marketing and sales procedures by centralizing our data, encompassing both marketing and sales data, into a single, convenient platform. This consolidation has not only saved us valuable time but also valuable resources. Consequently, we have witnessed a notable increase in our return on investment (ROI), owing to the significantly reduced time required to engage with potential clients and the ability to create more precisely targeted campaigns.” — Ashok D.
Factors.ai Integrations
Factors.ai integrates with a wide range of platforms to streamline your data collection and analytics:
- Segment
- Leadsquared
- Rudderstack
- G2
- Google Ads
- Facebook Ads
- Bing Ads
- Google Search Console
- Slack
- Microsoft Teams
- Hubspot
- Salesforce
- Webhooks
- Webhooks with Zapier
- Webhooks with Make.com (formerly, Integromat)
Pricing
Factors offers four pricing tiers:
- Free Plan: Ideal for small businesses or individuals just starting out. This plan allows you to track up to 100 monthly accounts at no cost.
- Basic Plan: Priced at $99/month when billed annually, the Basic Plan is designed for growing businesses. It offers additional features like custom events, KPIs, and onboarding support.
- Growth Plan: For established businesses looking to scale, the Growth Plan costs $499/month when billed annually. This plan introduces account lead scoring and provides a Priority Customer Success Manager (CSM).
- Professional Plan: Aimed at large enterprises, the Professional Plan is priced at $999/month when billed annually. It includes advanced features like multi-touch attribution, AI-fueled explanations, and a dedicated CSM.
Higher tiers provide more identified accounts, tracked users, advanced features, and additional integrations. Custom enterprise pricing is also available.
2. ZohoCRM

Zoho CRM is a comprehensive customer relationship management platform engineered to streamline various business processes, including sales, marketing, customer support, and engagement. It offers a centralized system where businesses can store customer data, track sales activities, manage marketing campaigns, and provide timely customer support.
Key Features:
Zoho CRM features robust features to optimize lead management, including:
- Lead scoring - Automatically score and prioritize leads based on profile attributes, behavior, and engagement. Helps sales teams identify and focus on hot leads.
- Predictive lead scoring - Leverages AI and machine learning to analyze data patterns and behaviors to predict lead outcomes and suggest optimal next steps.
- Workflow automation - Set up triggers and actions to nurture leads through customized journeys. Automates repetitive tasks to boost efficiency.
- Sales insights - Real-time analytics provide visibility into deal performance, sales activities, and more to inform data-driven strategy.
What Users Say About Zoho CRM
"Zoho CRM helps us bring our organization together–pieces fragmented across emails, notebooks, and different applications are now centralized. Zoho CRM is a game changer for us and Indian businesses of the digital era." - Suresh Iyer, CIO, Blue Star Limited
“Zoho CRM can be overwhelming for new users. The user interface is not very intuitive, and it takes some time to understand how to navigate and use all of the features. The reporting functionality could be improved, as it is not as robust as some of its competitors.” — Juan E.
Integrations
- Gmail
- Outlook
- Slack
- Hubspot
- Mailchimp
- Zapier
- Quickbooks
- Google Analytics
Pricing
Zoho CRM offers four main pricing tiers, each designed to cater to different business needs:
- Standard Plan: Priced at $14/user/month when billed annually. This plan focuses on automating and optimizing your sales cycle.
- Professional Plan: Costs $23/user/month when billed annually. Aimed at improving customer acquisition and accelerating growth.
- Enterprise Plan: Priced at $40/user/month when billed annually. Designed for managing global customer experience operations.
- Ultimate Plan: Costs $52/user/month when billed annually. This plan allows businesses to scale exponentially with dedicated Business Intelligence capabilities.
3. Salesforce Einstein

Salesforce Einstein provides an end-to-end AI solution to help companies adopt AI. It offers predictions and generates content to assist with marketing emails or content. Deeply integrated with Salesforce, Einstein uses data from CRM and other apps to deliver real-time insights, predictions, and content within your workflows.
Key features
- Einstein Prediction Builder allows you to create custom AI models to predict outcomes like churn or lifetime value. This is useful for scoring leads based on different criteria.
- Einstein Next Best Action delivers recommendations to employees and customers within Salesforce apps. You can define strategies and build models to suggest the next steps for nurturing leads.
- Einstein Discovery uncovers patterns in your data and provides AI insights for solving problems. This can help identify high-value leads or understand lead behavior.
- Einstein Language uses natural language processing to understand customer sentiment and intent. It can route inquiries and optimize workflows to prioritize leads based on interactions.
What users say about Salesforce Einstein
“Salesforce.com is our source of truth database for customer relationship management activities. With the Salesforce.com enablement features we have bought and the third-party vendors we work with sitting on top of our Salesforce.com, we can do all client interactions within Salesforce.com. Because of this, we have robust data on our sales and customer activities.” — Anonymous user
“I dislike that if you want a channel that isn't covered out of the box it's so difficult to use your own connectors. Also, it's extremely hard to bring your own bot to the party.” — Marilyn M., Senior Director
Integrations
Salesforce supports an extensive list of integrations as they have a complete marketplace to help you seamlessly integrate your stack. And because Einstein is part of the Salesforce ecosystem, you get the same integrations with Einstein.
Some popular integrations include:
- Google Data Studio
- GraphSQL
- Zapier
- And much more
Pricing
- Salesforce Cloud Einstein is priced at $50/user/month and charged annually. This includes unlimited requests for its lead-scoring-focused features.
4. HubSpot

HubSpot is an all-in-one sales and marketing software that helps businesses attract, engage, qualify, and convert leads at every sales funnel stage. It combines a full suite of tools to streamline and automate the sales process. HubSpot also offers powerful lead scoring features that can be a great way to prioritize your marketing campaigns, especially ABM.
Key features
- Lead Management & Prospecting: Manage leads and upcoming sales activities in one workspace.
- Email Tracking: Get real-time notifications when a lead opens an email.
- Sales Automation: Automate follow-up tasks and emails to keep leads engaged.
- Sales Analytics & Reporting: Full visibility into the sales process for effective forecasting.
- Predictive Lead Scoring: Available in the Enterprise plan, this feature helps prioritize leads.
What Users Say About Hubspot
“Hubspot Marketing Hub is our go-to tool for all our Marketing Initiatives. The best about Hubspot Marketing Hub is its User Experience. It is pretty much simple and their to-the-point approach (not showing too many options) is very beneficial.
The main red flag in Hubspot is its lack of Artificial Intelligence capabilities. Hubspot do have generative AI for Content creation but it lacks AI functionalities in Analytics and Database cleansing. We are tedious process especially if you have a huge database.” — Karthick M.
Integrations
HubSpot, like Salesforce, has a marketplace of integrations that allows you to integrate with hundreds of different tools. Some popular ones include:
- Google Suite
- WordPress
- Microsoft Suite
- Eventbrite
- And more
Pricing
- Free CRM plan with basic features
- Starter plan at $45/month for 1-10 users
- Professional plan at $800/month for advanced features
- Enterprise plan starting at $1,600/month with predictive lead scoring, A/B testing, and more
5. Freshsales

Freshsales is a powerful CRM platform designed to maximize business sales pipelines and revenue. It equips teams with robust features, including multiple sales pipelines, revenue analytics, CPQ capabilities, and AI-powered automation. This enables in-depth visibility into the sales process and intelligent prioritization of high-value deals.
Key Features
- Contact Scoring: Freddy AI assigns scores to prospects based on positive and negative signals to identify sales-ready leads.
- Deal Insights: Predictions on deal closure based on historical data, engagement, and activities to focus on high-value opportunities.
- Sales Sequences: Set up personalized outreach campaigns with triggers to effectively nurture prospects.
- Workflows: Automate repetitive sales tasks to reduce manual work and focus on qualified leads.
- Territory Management: Segment and prioritize prospects with rules to pursue leads likely to convert.
What Users Say About Freshsales
“Freshsales is a userfriendly CRM that is constantly looking for ways to improve. I like that they not only take feedback, but actually implement it. It syncs up easily to your email and allows for seamless work across different platforms like Google calendar/Gmal and Acuity.
I wish it would not ask to duplicate leads when they have different locations. Sometimes there will be a lot of leads with the same name (i.e. Jennifer Smith) and FS will automatically assume it is a duplicate. If it was somehow able to identify a difference in, say, location or company name, it would make the AI work in our favor with more ease.” — a reviewer on G2.
Integrations
Freshsales has a marketplace of integrations and these are some of the most popular ones.
- Mailchimp
- Trello
- Magento 2
- QuickBooks
- HubSpot
- PandaDoc
- Xero
- Stripe
- DocuSign
Pricing Plans
- Free Plan: $0 for up to 3 users with basic features.
- Growth Plan: $15/user/month billed annually or $18/user/month billed monthly. Includes contact scoring and sales sequences.
- Pro Plan: $39/user/month billed annually or $47/user/month billed monthly. Includes multiple pipelines and deal insights.
- Enterprise Plan: $69/user/month billed annually or $83/user/month billed monthly. Advanced customization and governance.
6. ActiveCampaign

ActiveCampaign is an end-to-end marketing automation platform designed to help businesses grow by streamlining the entire customer experience. It offers powerful capabilities, from email marketing to advanced lead scoring and sales automation.
Key Features
- Lead Scoring: Scores leads based on behaviors and attributes to identify and prioritize hot prospects for outreach.
- Win Probability: Uses machine learning to analyze past interactions and estimate the likelihood of closing a deal.
- Salesforce Integration: Enables robust scoring models by incorporating CRM data.
- Attribution Reporting: Provides insights into effective marketing channels for conversions.
What Users Say About ActiveCampaign
What I love about AC is they don't try to be the "only tool" you use. They get that we all use dozens of tools and instead work with that. We integrated in our Calendly, our Segment, our Bonjoro and many other integrations and they worked seamlessly. Not even Zapier required. — Casey H.
“Main downside we have experienced to date has been around Active Campaign support and responsiveness to issues. We have had our developer design and build the flows we are seeking but our main automation that has been set up is not working properly and a ticket has been logged with support for a number of days and no response or contact has been received.” — James C., Director
Top Integrations
- Salesforce
- WordPress
- Facebook Ads
- Slack
- Shopify
- WooCommerce
- Calendly
- Google Analytics
- Zapier
Pricing
- Plus Plan: $49/month annually for 3 users. Includes basics like WooCommerce integration.
- Professional Plan: $149/month annually for 5 users. Adds AI, Salesforce integration, and more.
- Enterprise Plan: Custom pricing for 10 users. Advanced features like custom reporting.
7. EngageBay

EngageBay is an intuitive all-in-one CRM and marketing automation platform tailored for small and midsize businesses. It combines a robust feature set on one seamless platform to maximize sales and revenue growth by aligning marketing and sales.
However, it contains multiple add-ons that you may require for proper analytics tracking which are not part of the complete package.
Key Features
- Marketing Automation: Create targeted campaigns and workflows to nurture prospects with relevant content and offers for better lead qualification.
- Lead Scoring: Automatically score leads based on demographics, behaviors like email opens/clicks, and other criteria to identify sales-ready prospects.
- Segmentation: Divide contacts into groups based on attributes like location, firmographics, interests, and behaviors for highly targeted marketing.
- Email Broadcast: Send customized emails to contacts and subscriber lists to drive engagement, which can be tracked for lead scoring.
- Deal Management: A centralized pipeline provides visibility into deal stages to score leads accordingly and focus efforts on closing deals.
What Users Say About Engagebay
“I love how you can manage your deals (sales pipeline) with email automations associated with those deals from the same platform. This is essential as it saves my sales and account management team a ton of time and effort with regards to admin work” — Rahul C.
“One thing I dislike about EngageBay is that the All-in-one suite does not actually include everything. There is a new really cool feature which allows you to track website activity, but it is an add-on. EngageBay charges extra for this feature.” — Marcin R.
Integrations
- Zapier
- SendGrid
- Mailgun
- Mandrill
- Xero
Pricing
- Free Plan: $0 per user/month, includes 250 contacts, basic CRM, and email marketing.
- Basic Plan: Starts at $12.74 per user/month, includes 500 contacts and lead scoring.
- Growth Plan: Starts at $42.49 per user/month, includes 5000 contacts and advanced features like custom domain.
- Pro Plan: Starts at $84.99 per user/month, and offers unlimited contacts and advanced analytics.
8. Adobe Marketo

Adobe Marketo Engage is a comprehensive marketing automation platform for B2B and B2C companies looking to optimize customer engagement and accelerate revenue. It combines robust email marketing, advanced lead management, and data-driven analytics in one powerful solution.
Marketo helps marketing and sales teams work cohesively to attract prospects, identify hot leads, and guide customers through personalized journeys from discovery to conversion. AI-powered capabilities provide actionable insights to engage people at the right time.
Key Features
- Lead Management: Nurture and qualify prospects through tailored content and the sales funnel.
- Account-Based Marketing: Coordinate marketing and sales to target high-value accounts.
- Scoring, Routing & Alerts: Prioritize and route leads based on engagement metrics and behaviors.
- Advanced Journey Analytics: Uncover customer insights across touchpoints to improve lead scoring.
- Predictive Audiences: Use AI to build customized audiences based on predicted behaviors.
What Users Say About Adobe Marketo
“It is a fairly complete tool, focused on marketing automation composed of webinars, form editor, landing templates, which significatly help you to elaborate reports though the management and analysis of programs that contains Adobe Marketo Engage, being this has a quite striking workflow management, taking into account that this engine is what makes this software quite attractive.” — Marco P.
“The user experience of building emails and campaigns can be very frustrating. For example, spacing surrounding email components appears much differently in the Marketo email preview than it does in your inbox. About 50% of the time, when you add an image, link, or token to your email, it disappears upon saving and you need to add it a second time. Almost every time you add a line break in your email, you have to save the component, open it again, and save it again before Marketo will reflect the space you added in the email preview.” — Jordan M.
Integrations
Like Salesforce and HubSpot, Adobe Marketo has a marketplace for all the tools that can be integrated with it. Here are some of the popular ones.
- Adobe Experience Cloud
- Salesforce
- Microsoft
- SAP
- Google and Facebook
- Event tools
- And more
Pricing
- Growth: Core email, segmentation, automation. Custom pricing.
- Select: Essential automation and measurement. Custom pricing.
- Prime: Advanced lead management, journey analytics, AI. Custom pricing.
- Ultimate: Robust marketing automation capabilities. Custom pricing.
With powerful automation, intelligence, and analytics, Marketo enables personalized cross-channel experiences to convert more prospects and drive revenue.
9. Monday.com

Monday.com is a flexible and customizable sales platform designed for sales teams looking to streamline processes, boost productivity, and centralize customer data. It brings key sales capabilities like pipeline visibility, forecasting, email integration, and activity tracking into one intuitive platform.
Key Features
- Email Sync & Tracking: Sync Gmail/Outlook to log emails and get notifications when prospects open or reply.
- Sales Forecasting: Set deal values and probabilities to track forecast vs. actual sales.
- Activity Management: Log activities like calls, meetings, and notes with leads and contacts.
- Team Goals: Manage and track team quota attainment over time.
- Lead Capturing: Integrate with other tools or add website forms to capture leads.
What Users Say About Monday
“I like how monday.com helps us create almost instanly more efficient team no matter the approach you take: be it Kanban, Scrum, Scrumban or any other predictive or agile enviroment, Monday.com is full of templates and views to show the data in all those approaches. Automations make the job of a project lead much easier and allows you track performance, SLAs, etc. You can assign owners, up to two, limit the work in progress, link with Gmail, etc” — Milton Adalberto A.
It takes a long time to set up exactly how you want it, truly you need a dedicated person to be able to get it going perfectly. Otherwise, you will be tweaking constantly to get it fully operational and customized. — Megan M., Director of Operations
Integrations
- DocuSign
- Aircall
- PandaDoc
- MailChimp
- Hubspot
- Facebook Ads
- Salesforce
Pricing
- Basic CRM: $10/user/month billed annually, unlimited contacts, custom pipelines.
- Standard CRM: $14/user/month billed annually, 2-way email, CRM automation.
- Pro CRM: $24/user/month billed annually, sales analytics, mass emails.
- Enterprise CRM: Contact for pricing, lead scoring, analytics, and security.
10. Platformly

Platformly is an intuitive marketing automation platform designed to help online businesses centralize, automate and scale their operations for growth. It combines email marketing, basic CRM, behavioral tracking, analytics, and more to streamline processes and convert leads.
Key Features
- CRM: Automatically record and update customer information like contact details, interactions, and recent social media activity.
- Segmentation: Divide your contacts into groups with shared attributes to send targeted campaigns.
- Sales Pipelines: Visualize deal stages to understand where leads are in the funnel and focus efforts on pushing them through.
What Users Say About Platformly
“Platformly is perfect because it always allows you to save time. It offers many features in one tool: marketing automation, emails, forms... and more. On top of that, it has many integrations with other tools! The other great thing is support. This is important to me. I don't like waiting too long for support.” — Thomas K.
“The well-defined interface is rather complicated and confusing. Their documentation is primarily technical documentation and less about use case scenarios to help train and guide in optimal usage.” — Peter K., CEO and Co-Founder
Top Integrations:
- ClickBank, PayPal, Paddle, Stripe
- WooCommerce, Shopify
- Twilio & Nexmo
Pricing
- Starter Plan: $69/month for up to 10K contacts, 10K emails/month, 1 dashboard, 5 integrations.
- Growth Plan: $49/month extra for 100K emails/month, 5 dashboards, unlimited integrations.
- Unlimited Plan: $99/month extra for unlimited emails, dashboards, integrations.
11. Pardot

Pardot combines a suite of capabilities, including email marketing, lead nurturing, lead scoring, and seamless CRM integration with Salesforce. Automated and personalized campaigns allow you to engage prospects with the right message based on their interests and behaviors at the right time.
Robust analytics provide insights to refine campaigns and strategies for optimal ROI continuously. The platform is optimized to find, nurture, and convert more prospects into customers.
Key Features
- Marketing Automation: Automate tasks to identify and engage with hot leads.
- Marketing Analytics: Focus efforts on high-value prospects based on conversion data.
- Sales & Marketing Alignment: Salesforce Engage connects sales with qualified leads from marketing.
What Users Say About Pardot
Complexity, Cost, Learning Curve, Limited Social Media Integration. Despite these potential downsides, many organizations find the benefits of Pardot when it comes to enhancing their marketing efforts and customer engagement — Deepak R.
Pardot requires knowledge of HTML, which is a nice way of saying that your time working on email campaigns is going to be complex, frustrating, and time-consuming. Formatting and styling are Pardot's pain points. Source reporting, and reporting in general, are famously awful. Don't take my word for me - check around, and you'll find out that Pardot is dead last in the market regarding providing useful data and insights. — Ian B., Growth Marketing Manager
Integrations
Similar to Salesforce, Pardot integrates and works with all the tools that Salesforce integrates with.
Pricing
- Account Engagement: $1,250/month for up to 10K contacts annually.
- Plus: $2,750/month for up to 10K contacts annually.
- Marketing Analytics: $3,000/user/month annually.
- Sales & Marketing Alignment: $50/user/month annually.
Key Takeaways
- Implementing lead scoring is critical to identify and prioritize hot prospects most likely to convert. The right software solution can analyze engagement, attributes, and behaviors to accurately predict lead potential.
- Look for AI-powered predictive scoring, actionable account intelligence, and intuitive journey analytics when evaluating lead scoring platforms. These capabilities optimize targeting, conversions, and revenue growth.
- Platforms like Factors utilize advanced AI and machine learning to provide unparalleled accuracy in predicting outcomes. Comprehensive account profiles and Explain features uncover trends driving progression.
- Seamless CRM and marketing automation integrations align sales and marketing around high-value targets. Shared tools and data foster engagement, coordination, and conversions.
- Solutions range from specialized scoring to end-to-end suites. Assess your needs and stack compatibility when selecting. All-in-one platforms can maximize efficiency.
- Carefully evaluate capabilities, ease of use, customer support, and pricing models. Many offer multiple tiers based on features, users, and contacts.
For enterprises seeking a powerful yet intuitive lead scoring and account management platform, Factors is a clear choice. Book a demo with Factors to learn how cutting-edge AI can uncover revenue opportunities.
.webp)
10 Proven Strategies For B2B Pipeline Acceleration
Since you're here, you're likely familiar with the tedious, time-consuming nature of B2B sales pipelines. New leads come in, some progress is made, but closing the deal seems to take FOREVER.
In fact, Salesforce finds that in B2B deals, conversion time frames can span from more than 100+ days. That’s several weeks, if not months before realizing revenue from pipeline.
But what if you could speed up your sales pipeline and convert leads into paying customers faster?
That would let you grow revenue quicker, make your sales team more efficient, and provide a better experience for prospects.
In this post, let’s look at ten proven strategies to accelerate your B2B sales pipeline. These tactics have helped companies reduce delays, shorten cycle times, and get deals across the finish line sooner.
Let's dive in!
TL;DR;
Here’s a list of strategies to accelerate your sales pipeline:
- Mapping your complete customer journey to expose delays
- Qualifying accounts upfront to avoid time-wasting leads
- Automating more of your outreach to engage faster
- Providing value before pitching prospects
- Building a frictionless website experience
- Connecting with multiple stakeholders
- Structuring the follow-up process
- Analyzing pipeline metrics to improvise further
Pick a few areas that resonate with your business and run with them.
First, What is a Sales Pipeline?
A sales pipeline provides a view of all your potential deals mapped out as they move through your sales process—from initial contact to closed sales.

It's usually displayed as a funnel, with leads at the top of the funnel and closed customers at the bottom. In between are the middle stages that deals must move through, like qualification, calls, proposals, etc.
Each open deal sits in one of these stages, depending on its position in the sales process. This helps you analyze how quickly deals are moving through your sales process.
Here’s a formula to calculate your organization’s sales pipeline velocity:
Pipeline velocity = (Opportunities x average deal size x average win rate) ÷ length of average sales cycle (in days)

To put this formula into perspective, let’s take an example.
- Opportunities: You have 100 qualified prospects across your pipeline stages.
- Average deal size: The average monetary value of each deal is $10,000.
- Average win rate: Given an average conversion rate between 6-13%, we'll take 10% for simplicity. This means that out of every 100 prospects, you can expect to close approximately 10.
- Length of average sales cycle: It takes on average 50 days to close a deal.
The formula would be:
Pipeline velocity = (100 opportunities x $10,000 average deal size x 10% average win rate) ÷ 50 days
That makes the sales pipeline velocity $2000 per day.
This means that for every day, you can expect $2000 worth of deals to move through your sales pipeline, given the current conditions of your sales process.
Why Is Pipeline Acceleration Important?

Now, why does pipeline velocity even matter? What's the big deal if deals take a while to close?
Well, here are some of the critical benefits of having a high-velocity pipeline:
1. Fast Revenue Growth
If deals move through your pipeline quicker, you'll close more of them per month.
Using our example above, if you start closing deals in 30 days instead of 50, your sales pipeline velocity would be $3,000+ per day instead of $2000.
2. Increased Sales Productivity
Shorter sales cycles mean each rep can handle more deals at once.
So, even without expanding headcount, you can get more done and ramp up productivity.
3. Lower Total Cost Per Deal
Slow sales cycles drag out the amount of time spent per deal.
As you begin accelerating your pipeline, it reduces the average cost to close each deal.
That helps boost overall margins and profitability.
4. More Predictable Forecasting
When pipeline velocity is all over the place, revenue forecasting gets tough.
But fast, predictable cycles make it easier to forecast sales for upcoming quarters accurately.
5. Better Customer Experience
Customers want fast sales cycles, too. Quicker time-to-value and onboarding leads to greater satisfaction.
As you can see, there are some significant benefits to accelerating your pipeline beyond just closing deals faster.
It enables sustainable growth, predictability, productivity gains, and happier customers.
That's why making sales pipeline velocity a priority is vital for any scaling company.
10 Tactics to Accelerate Your Sales Pipeline
Now that you know why sales pipeline velocity matters, let's get into how to improve it. Here are ten proven strategies and tactics to accelerate your B2B sales pipeline:
1. Map Out Your Customer's Journey
If you want to speed up your pipeline, the first step is understanding your typical customer's journey.
Analyze every touchpoint and interaction as they move from prospect to customer. Look at elements like:
- First contact channel - ads, referrals, outbound etc
- Content consumption - downloads, blogs read, videos watched
- Website engagement - pages visited ranked by relevance
- Sales conversations - demos, meetings, calls
- Time spent and progression through each pipeline stage
This end-to-end view will highlight areas for improvement in your sales process.
You'll see where prospects fall out of the journey, what causes delays, and stages with longer cycle times.
Apart from the journey, you also want to understand the customer acquisition costs (CAC) and the current pipeline velocity before you can begin optimizing.
From there, you can simplify touchpoints, improve conversion rates, and take friction out of the journey.
This holistic perspective alone will reveal many opportunities to accelerate deals you'd never catch otherwise.
2. Focus More Time on Qualified Leads
It's tempting to consider every new lead a hot potential deal and jump on it immediately.
But let's be honest—not every lead is created equal. Many end up wasting sales time.
Instead, begin to qualify leads more likely to convert before spending valuable sales time on them.
Some ways to focus on qualified leads:
- Look at accounts already engaging with your brand across sites, ads, events, etc. Those visits indicate intent.
- Score leads algorithmically based on their behaviors—content downloads, pages visited ranked by relevance, repeat visits, etc. Prioritize ones demonstrating engagement.
- While expanding to new accounts is still essential, going after previous or existing customers is often faster. Identify additional pain points that your product/service can solve for your customers that they aren’t already aware of and encourage them to upgrade to higher plans.
Performing lead qualification regularly can help your business as well as your sales team to ensure your pipeline contains quality deals that are ready to move forward quickly.
3. Use Automation to Respond Faster
Marketing studies consistently show that average response time is 42 hours. But if you want things to move faster, contacting leads as quickly as possible after they engage will help boost conversion rates.

That's where marketing automation comes in. It lets you respond to new leads within minutes or hours before momentum dies.
Some ways to use automation for responding to leads:
- Send new contacts a personalized, sequenced email drip campaign over 7-15 days. Provide value without pitching too hard.
- Get notified in real-time when a target lead visits a pricing or contact sales page on your site, indicating interest. Follow up ASAP.
- Automatically update lead info from your website into your CRM when someone converts, keeping data in sync.
- Trigger personalized campaigns based on behaviors—if Lead A downloads Report 1, instantly send them Email Sequence A.
- Connect to multiple stakeholders from the same account so you are not overly reliant on that one promising lead you identified and are instead looking at the entire account.
- Use true AI chatbots that answer questions using your existing knowledge-base.
The idea isn’t to replace your sales people. We want to use automation to engage leads until your sales team can get back to them.
Combine automation with that human touch at precisely the right time to get the win.
4. Provide Value First, Don't Sell Right Away
Here's a tactic that may seem counterintuitive...
During the early stages of their journey, leads aren't ready to talk to sales. They're focused on researching potential solutions.
You'll turn them off if you try to pitch them too soon.
Instead, provide value upfront through:

- Helpful educational content: Blog posts, guides, tools, etc., that speak to their pain points show you can provide real solutions.
- Free trial access: Letting leads experience your product for themselves is incredibly powerful. Even if it's time-limited.
- Peer perspectives: User reviews, case studies, and client testimonials help build trust and social proof.
- Community forums: Let leads engage with existing happy users to ask questions and get unbiased insight.
Nurture first, sell second. Prospects will automatically develop more interest when you lead with value instead of a sales pitches.
And once they know you understand their needs, they'll be way more open to a conversation.
5. Design Your Site For Self-Service

For most prospects, your website will be one of the first touchpoints when evaluating solutions.
So, making sure it accelerates deals is critical.
- Make it stupidly easy for visitors to find anything they need—product features, pricing, competitive comparison, demo sign-up, etc.
- Include sales enablement content like ROI calculators, proposal templates, third-party reports, and compliance docs. Arm your team.
- Add short videos explaining your product's value prop are way more engaging than dense blocks of copy.
- Minimize back-and-forth by letting visitors self-serve answers to common questions and access gated content.
The more questions prospects can answer on their own through your site, the less time you'll spend answering them 1:1 down the line—and the more confident prospects will be about your business.
6. Consider a Freemium Offering
Letting users sign up and experience your product for themselves at no cost is incredibly powerful for pipeline acceleration.
It helps remove that friction point entirely rather than make prospects request demos and jump through hoops.
Offer a limited but valuable free version with your core features available.

Then, make it easy to upgrade to paid plans within the product.
A freemium approach reduces the heavy sales lifting required to get prospects onboard and use your solution.
However, if your product requires 1:1 onboarding due to technical complexities, have an interactive product demo or product tour for prospects to try out.
You want them to get a feel for your product as effortlessly as possible—the less friction there is, the faster your sales pipeline.
7. Use Special Offers and Incentives (Judiciously)
Pricing promotions, limited-time discounts, gift boxes, swag...these special offers work to nudge prospects when they’re unable to make a decision.
A free 30-day trial pitched right before the prospect chooses to close the checkout page can help push an otherwise lost opportunity.
But don't just blast everyone with the same deals. Such tactics lower your product’s value.
Instead, reserve them for accounts where your sales team has identified mutual intent and the deal is trending positively.
Get strategic about it.
When timed right in the customer journey, incentives can be the extra push that accelerates a deal from evaluation to close. Just use them selectively and thoughtfully.
8. Sell to the Full Buying Committee
Complex B2B deals often involve multiple decision-makers—end users, finance team, CXOs, etc.
But too often, sales teams focus on just one main champion prospect and ignore everyone else.
This risk deals with stalling at the last mile when someone at the company isn't aligned.
To accelerate pipeline movement:
- Identify all players involved in the purchase process early on.
- Tailor messaging and content to each persona's specific interests and concerns.
- Ensure sales engage the entire group proactively, not just your primary contact.
Getting everyone on the same page early (even if indirectly) smooths the approval process and avoids last-minute hang-ups.
9. Follow a Structured Follow-Up Process
Lack of prompt, consistent follow-up after initial outreach kills more deals than anything as we learned before.
So don't drop the ball after those first few emails or that big demo call. Nurture the relationship until you either close the deal or the client goes completely cold.
Reminds me of this scene from the Wolf of Wallstreet!
Some key pointers:
- Set concrete timelines for following up after key activities - a demo, proposal presentation, stadium event invite, etc.
- Log all subsequent steps and promises in your CRM immediately so nothing gets lost.
- Develop templates for common follow-up scenarios—pricing proposals, contracts, reference requests, etc.
- Mix up email, phone, LinkedIn, direct mail, and more follow-up channels. We’re not spamming them across channels, simply nudging once or twice before considering a prospect/lead cold
Just having that structured process for managing follow-ups removes a major pipeline bottleneck. No more waiting around for prospects to come to you!
10. Analyze Pipeline Metrics Rigorously
Finally, you can't accelerate your pipeline if you're flying blind. You need to start crunching the numbers.
Look at key metrics like:
- Average sales cycle length per stage
- Conversion rates from one step to the next
- Overall pipeline velocity and trends
- Win/loss rates by product, rep, campaign, etc.
- Time to close deals by lead source, geo, etc.
Here are some other key metrics to track while running ABM and demand gen campaigns.
Going through this data will help you understand what messaging, products, and channels work best to progress sales.
You can also survey lost accounts to learn why—was it price, competition, or missing features?
How Factors Helps Accelerate Pipeline Velocity?
Now, you may be wondering—how can I map journeys, score leads, and analyze pipeline metrics?
Doing that manually with spreadsheets is painful and inaccurate!

That’s when you need a customer journey analytics software like Factors.
Factors automatically captures prospect and customer data across all your touchpoints.

Then, they connect the dots to map entire journey visualizations.
Factors can also help you score leads based on engagement metrics and surface actionable insights.

It's like having an all-seeing eye across your tech stack. No more dragging exports from sales, marketing, and support systems separately.
For accelerating your sales pipeline velocity, Factors can help you:
- Map the entire journey from initial contact to close to find friction points
- Score accounts based on engagement signals like site activity, event attendance, etc.
- Trigger notifications when prospects show buying signals, like email sequences after a pricing page visit
- Track pipeline progress and analyze metrics to optimize continuously
So, if you need more visibility into your pipeline health, check out comprehensive solutions like Factors!
Accelerating Your B2B Sales Pipeline
B2B sales pipelines often move slowly, with deal cycles stretching over months. Long timelines can delay revenue and strain resources. Accelerating your pipeline shortens sales cycles, improves forecasting, and drives revenue growth. It also enhances sales productivity and delivers a better buying experience for prospects.
Pipeline velocity is the rate at which deals progress through your sales stages. It depends on four key factors:
- the number of qualified opportunities
- average deal size
- win rate
- length of your sales cycle.
Improving any of these elements can speed up your pipeline and increase daily revenue flow.
Successful pipeline acceleration begins with understanding your customer journey to uncover bottlenecks. Prioritizing high-intent, qualified leads ensures sales teams focus on prospects ready to buy. Leveraging automation tools speeds up outreach, while value-driven content nurtures leads without immediate hard selling. Engaging all stakeholders in the buying committee prevents last-minute delays, and a structured follow-up process keeps deals moving forward.
Tracking pipeline metrics and adjusting your sales approach based on data further refines performance. Implementing these strategies empowers B2B teams to close deals faster and achieve more predictable revenue growth.
Let’s Accelerate Your Sales Pipeline Today!
There you have it—10 strategies that help you speed up your sales pipeline velocity and close deals faster.
It may seem like a lot to take in. But even implementing a few of these tactics to begin with can go a long way.
{{CTA_BANNER}}
FAQs
1. What are funnel accelerating activities?
Funnel accelerating activities are tactics and initiatives that help speed up lead progression through the stages of your sales funnel. This includes:
- Lead nurturing campaigns with valuable content to move leads down the funnel
- Special offers, discounts, or gifts to incentivize faster deal progression
- Sales workflow automation to respond to leads quickly at each stage
- Aggressive follow-up sequences to keep pipeline deals moving
- Lead scoring to identify and prioritize high potential accounts
The goal of funnel acceleration is to reduce delays, bottlenecks, and friction points at each step so leads flow smoothly into closed customers.
2. How do you accelerate pipeline velocity?
Some key ways to improve overall pipeline velocity include:
- Mapping out the customer journey to identify and resolve sticking points
- Focusing sales efforts only on qualified, high-intent accounts rather than spraying everywhere
- Using marketing automation to engage hot leads faster with targeted follow-ups
- Providing free trials, content, and other value to leads to progress deals quicker
- Implementing disciplined follow-up protocols for sales team activities
- Analyzing pipeline metrics to continuously refine processes over time
Combining multiple acceleration tactics results in compounding effects on velocity. Small gains add up!
3. What is the formula for sales pipeline velocity?
The basic formula for calculating total sales pipeline velocity is:
Pipeline velocity = (Opportunities x average deal size x average win rate) ÷ length of average sales cycle (in days)
.avif)
Customer Acquisition Funnel - The Complete Guide For 2025
The average website conversion rate across B2B is just about 2%. This means businesses miss out on most (~98%) brand-aware accounts already visiting their website. A deep understanding of your customer journeys and the ability to identify hidden opportunities becomes essential to make the most of this potential pipeline.
This is where a customer acquisition funnel comes in.
The customer acquisition funnel helps track how prospective customers flow through defined stages of the buyer journey to become loyal buyers. The funnel starts broad, capturing initial awareness and interest before narrowing down to hot leads, evaluating solutions, and finally making the purchase.
This guide covers everything you need to know about building, analyzing, and optimizing the customer acquisition funnels, including:
- Mapping the stages of the modern customer journey
- Tracking key funnel performance metrics
- Diagnosing and addressing bottlenecks stunting conversion
- Leveraging tools to unlock data-driven funnel insights
- Applying proven best practices to optimize acquisition
By the end, you’ll understand how a well-oiled customer acquisition funnel can drive sustainable business growth with minimal effort. Let's dive in!
TL;DR
- The customer acquisition funnel includes five core stages: Awareness, Interest, Consideration, Decision, and Customer, each requiring tailored marketing strategies.
- Mapping your funnel helps identify roadblocks, improve conversion rates, allocate resources more effectively, and support accurate growth projections.
- Using tools like Factors helps track and analyze customer interactions, making it easier to optimize strategies and improve customer acquisition over time.
- A well-built funnel requires ongoing testing and optimization, ensuring that marketing efforts are always aligned with customer needs and market changes.
What is a customer acquisition funnel?
The customer acquisition funnel is a structured path a potential customer follows from initial awareness of a product to ultimately becoming a paying customer. It consists of clearly defined stages that segment the customer journey into measurable phases.
Here is a simple example depicting the critical stages in a typical customer acquisition funnel:

As you can see:
- The funnel is broad at the initial awareness stage, where many prospects learn about your offerings.
- It narrows as prospects display increased levels of engagement. This represents fewer prospects remaining actively engaged as the funnel progresses toward a purchase decision.
- At the end of the funnel, the smallest number of highly qualified prospects convert into paying customers.
The overarching goal of mapping the customer acquisition funnel is to establish a data-driven view of how prospective customers move through defined stages on their path to conversion.
It provides actionable insights to optimize marketing and sales processes across the entire customer lifecycle—maximize conversion rates, decrease acquisition costs, and improve retention over time.
Actively optimizing a customer acquisition funnel offers significant benefits, including:
- Identifying roadblocks within the customer journey to conversion.
- Determining the effectiveness of current acquisition strategies.
- Enabling more efficient allocation of marketing and sales resources.
- Supporting more accurate forecasting of future conversions and revenue.
- Fostering customer-centric thinking across the organization.
All of which helps you fix funnel leaks and continually improve your conversion ratio. With that clear, let's explore why the customer acquisition funnel is a high-return investment for any growth-oriented business.
Why is the customer acquisition funnel Important?
There are several compelling reasons why taking the time to thoughtfully map out and optimize your customer acquisition funnel is worthwhile:

1. It Aligns Teams and Strategies to Common Business Goals
The mapped customer journey gives every department—marketing, sales, product, customer service, etc.—a shared understanding of customers' complete experience. And a unified perspective enables better coordination of strategies across teams to optimize the journey.
For example, marketing can pass warm leads to sales quickly. Product can identify and fix usability issues that could lead to drop-offs, and the service can follow up with customers post-purchase to improve retention.
Without this alignment, teams can end up working in silos and creating a fragmented, inconsistent customer experience.
2. It Highlights Optimization Opportunities
Along with aligning teams, acquisition funnels help analyze conversion rates and drop-off points at each customer journey stage.
It also highlights areas where customers are struggling or abandoning the process. These issues represent tangible opportunities to optimize specific steps in the journey to make it easier and more seamless for customers.
For instance, a drop in conversions from free trial signup to paid signup may indicate friction in the onboarding flow or payments. If you have a system that identifies the issues, you can address them by reducing the steps for onboarding or changing your payment gateways.
3. It Informs More Impactful Resource Allocation
The mapped customer journey visually shows which parts of the process work well vs. underperforming. The data can make prioritizing budgets, staffing, technology solutions, and other resources easier. More funds can be allocated to the journey's branches needing improvement. Meanwhile, resources focused on high-performing portions may be redirected or minimized.
4. It Allows More Accurate Growth Projections
With historical data on customer volume and conversion rates mapped to each phase, you can better predict future acquisition and growth trends. Forecasting models can extrapolate forecasted customer volumes and associated revenue expansion over time.
This provides vital input for broader financial planning activities like budgeting, growth strategy, hiring plans, etc. Accurate projections set realistic goals versus arbitrary targets.
5. It Creates a Customer-First Mindset
Walking step-by-step through the customer experience encourages team members to view things from the customer's perspective. This naturally promotes greater empathy for and understanding of customer needs across the organization.
For example, seeing a high drop-off during an onboarding flow could prompt an engineer to simplify the process for faster time to value. This customer-centric mindset powered by the journey map establishes a critical foundation for customer-obsessed cultures.
Now that we've covered why mapping the customer journey is so valuable let's understand the critical stages of a typical acquisition funnel.
The Stages of the Customer Acquisition Funnel

The customer acquisition funnel is generally broken down into five core stages:
1. Awareness
This first stage is when potential customers become aware that a company and its products exist.
For example, someone may see an ad for a SaaS company offering project management software. The goal here is to build broad awareness and "get on the radar" of prospects.
Typical marketing activities within the awareness stage include:
- Digital advertising campaigns - search, display, social media, etc.
- Traditional advertising - television, radio, print, out-of-home
- Public relations and earned media outreach
- Content marketing - blogs, videos, guides, case studies
- Search engine optimization and website enhancements
2. Interest
At this stage, aware prospects start developing a genuine interest in the company. For example, someone who saw the project management software ad may now go to the website and download an ebook on productivity tips for managers. Marketing now provides targeted information and materials to nurture leads, convey relevance, and prompt engagement.
Common tactics used in the interest stage include:
- Promotional content - ebooks, whitepapers, email nurturing campaigns
- Targeted search and display advertisements
- Social media engagement - likes, shares, follows, clicks
- Customer testimonials and reviews
3. Consideration
In the consideration stage, interested prospects actively evaluate whether the solution fits their needs. For example, the lead may sign up for a free software trial to test it out. Marketing in this stage focuses on differentiation and incentives to drive trials and consultations.
Typical consideration stage activities include:
- Free trials of your product
- Live product demonstrations and consultations
- Multi-touch email campaigns
- Retargeting advertisements
- Sales representative calls and meetings
4. Decision
Here, prospects have narrowed options and are nearing a purchase decision. For example, the lead may be at a stage where they’re now comparing the project management tool against 1-2 competitors.
Marketing provides final convincing arguments to close the sale.
Some of the common tactics used in the decision stage involve:
- Special promotional pricing or discounts
- Highly targeted and personalized advertisements
- Aggressive sales follow-ups and closes
- Frictionless point-of-sale or checkout experiences
5. Customer
This is the final stage, where prospects complete a purchase to become customers. Marketing aims to drive loyalty, retention, referrals, and repeat sales. For example, the new customer is onboarded to the software and offered additional training and resources to improve the experience with your product.
Post-purchase activities include:
- New customer onboarding and implementation
- Satisfaction surveys and user feedback collection
- Loyalty or VIP programs
- Customer retention and win-back campaigns
- Referral programs
- Remarketing and cross-selling campaigns
Note this is only a framework to get you started. As companies implementing acquisition funnels mature, they develop custom funnels that work best for them. So, feel free to modify the stages as you see fit.
How to Build Your Customer Acquisition Funnel
With the understanding of what a good customer acquisition funnel can do and the stages involved, how can you implement one for your business? Here are a few simple steps you can follow:
Step 1: Conduct Customer Research to Map Buying Journeys
Start by truly understanding your target customers through qualitative and quantitative research. Learn what motivates them, their pain points, and the detailed buying process.
Analyze any existing sales and marketing funnels—conduct focus groups, surveys, interviews, and advisory boards to uncover the fundamental stages prospects go through to become buyers.
For example, after going through multiple transcripts, an enterprise software company may determine these high-level funnel stages:
- Awareness - Learn about the product from YouTube or communities
- Interest - Book a demo or register for a trial
- Consideration - Book demos and trials with other vendors for a detailed comparison
- Decision - Select finalist and negotiate contracts
- Customer - Onboard and train employees
This process is primarily manual. However, running your meeting transcripts through ChatGPT can help you gain insights quickly without reading transcripts or rewatching the meetings.
Step 2: Catalog Omnichannel Touchpoints and Interactions
Next, catalog every existing and potential marketing, sales, support, and product touchpoint you have with prospects. Do this across all marketing channels, from the first touchpoint to the sale.
Spend time brainstorming different ways your existing buyers interacted with your brand. For instance, an enterprise CRM company may identify these example touchpoints:
- Awareness - Tradeshow booth, 3rd party reviews
- Interest - Targeted social media ads, analyst content offers
- Consideration - Free trial signup, sales consultation
- Decision - Contract negotiations, training previews
- Customer - Onboarding calls, support portal, feedback surveys
List all possible touchpoints, including community mentions, YouTube videos, newsletters, and other channels, even if you don’t actively pursue them.
Step 3: Implement Analytics Tracking
Put in place tracking across your website, ads, email, and other digital channels. The list of touchpoints from Step 2 will guide where to add analytics tracking.
You also want a unified tracking platform that combines data for a holistic view. While most analytics are channel-specific, a platform like Factors compiles cross-channel data.
This gives a complete picture of how customers interact from initial contact to sale. You can see touch points across devices, channels, and time to understand the full path to conversion.
Step 4: Set Clear Conversion Rate and Revenue Benchmarks
With unified tracking implemented, closely analyze the performance of each marketing channel and touchpoint. Assess critical metrics like:
- Cost per lead for ads and campaigns
- Lead to customer conversion rates by channel
- Average sales cycle length after first contact
- Average deal size by lead source

This analysis identifies your highest and lowest-performing acquisition sources. See which parts of your funnel have the most friction or gaps.
For example, you may find newsletter leads convert at 2X the rate of cold calls. Or that leads coming from an event have larger deal sizes than web leads. This insight shows where optimization can make the most significant impact.
Step 5: Continuously Test and Optimize
While you can theoretically call an acquisition funnel “complete,” it never really is. You need to optimize it through A/B and multivariate testing continuously. This allows you to experiment with multiple versions to find the messaging systematically, offers, and flows that maximize conversion rates and prospect velocity.
For example, if your cold email outreach has a high volume but needs to improve on conversions, start testing.

Similarly, create a priority list for other channels based on opportunity areas revealed in the channel analysis.
You can run these tests to optimize content, calls-to-action, page layouts, forms, and more at each funnel stage. The goal is to move prospects seamlessly toward conversion.
Step 6: Keep Testing New Marketing Channels
You’ll often hear, “Stick to what works.” The advice is spot on. You must commit to your proven marketing strategies long enough to see accurate results. But clinging onto a dying marketing channel is a disaster waiting to happen.

For instance, when TikTok emerged, short videos became “the thing” that made many brands like NoGood exceptionally popular for their niche. But if you choose not to experiment with new channels when they’re still nascent, you will miss the benefits of being an early adopter. Stay ahead of the curve through ongoing assessments.
How Factors Helps Track & Improve the Customer Acquisition Funnel
For most businesses, tracking your acquisition funnel takes a lot of work. Customer data lives across many systems—your website, ads, email, CRM, etc.
And connecting all this data to analyze the customer journey manually is tedious and error-prone. It takes a lot of work to get a complete picture.
This is where Factors comes in.

Factors automatically brings together customer data from all your systems in one place. This provides a unified view of each customer's entire journey in your acquisition funnel.
With Factors, you quickly see how customers flow through your funnel by visualizing engagement across your ads, website, email campaigns, sales reps interactions, and more.

For example, you can see that a prospect first clicked on a Google ad, visited specific landing pages on your site, downloaded an ebook from your blog, was contacted by a sales rep, and ultimately converted by purchasing your product.
Factors stitches these events together into an interactive visual timeline for each customer account. You can instantly analyze the key steps and paths that drive conversions.

You can also break down funnel performance by critical segments like geography, product line, or customer type. If your funnel is working better for small businesses versus enterprises, Factors makes this clear.
Beyond just reporting, Factors provides powerful analytics to optimize your funnel:
- Identify which marketing channels drive awareness and interest most effectively.
- See where prospects fall out of your funnel and diagnose why.
- Calculate conversion rates and sales velocity at each funnel stage.
- Uncover friction points in the customer journey on your website.
- Determine which sales reps convert leads most efficiently.
- Predict which prospects will likely convert next using machine learning.
With Factors, you get the complete picture of your acquisition funnel in one place. This enables you to continuously optimize marketing, product, sales, and other processes to acquire more valuable customers cost-effectively.
Customer Acquisition Funnel Template
Customer Acquisition Funnel Template
Objective: Track and optimize the customer journey from awareness to conversion to enhance business growth and streamline marketing and sales efforts.
1. Funnel Stages
The customer acquisition funnel consists of five core stages that reflect the buyer's journey:
1.1 Awareness
Objective: Introduce your brand to potential customers.
Activities:
- Digital advertising (search, display, social media)
- Traditional advertising (TV, radio, print)
- Public relations, earned media
- Content marketing (blogs, videos, case studies)
- SEO and website optimization
Metrics to Track:
- Website traffic
- Ad impressions
- Content engagement (clicks, views, shares)
2. Interest
Objective: Nurture initial curiosity and convert awareness into engagement.
Activities:
- Downloadable resources (ebooks, whitepapers)
- Social media engagement
- Email nurturing campaigns
- Customer testimonials and reviews
Metrics to Track:
- Leads generated
- Content downloads
- Engagement (social media interactions, email open rates)
3. Consideration
Objective: Help prospects evaluate your solution and build trust.
Activities:
- Free trials or demos
- Sales consultations or webinars
- Retargeting ads
- Multi-touch email campaigns
Metrics to Track:
- Trial signups
- Consultation bookings
- Click-through rates (CTR) on retargeting ads
4. Decision
Objective: Close the sale by overcoming objections and offering final incentives.
Activities:
- Special discounts or promotions
- Personalized follow-ups and calls
- Frictionless checkout or point-of-sale experiences
Metrics to Track:
- Conversion rate
- Sales cycle length
- Revenue generated from promotions
5. Customer
Objective: Onboard and retain customers to foster loyalty and advocacy.
Activities:
- Onboarding calls and product training
- Customer satisfaction surveys
- Loyalty programs or referral incentives
- Retargeting and cross-selling
Metrics to Track:
- Customer retention rate
- Net Promoter Score (NPS)
- Referral program participation
2. Funnel Optimization Strategies
Identify Bottlenecks
Track drop-offs at each stage to identify where prospects are losing interest or getting stuck.
Resource Allocation
Direct more resources (budget, personnel, tools) toward areas with the highest conversion potential.
A/B Testing
Continuously experiment with different strategies at each stage, such as email subject lines, landing page designs, or ad copy.
Cross-Channel Analytics
Ensure data from all touchpoints (website, ads, email, social, sales reps) is tracked in one unified system.
3. Key Performance Indicators (KPIs)
Conversion Rate by Stage
Measure how effectively prospects move from one stage to the next.
Cost per Lead (CPL)
Track the cost of acquiring leads through various channels.
Lead to Customer Conversion Rate
Calculate how many leads convert to paying customers.
Sales Velocity
Measure how quickly prospects move through the funnel from initial contact to conversion.
4. Continuous Improvement
Monitor Funnel Performance
Use analytics platforms to track engagement and optimize the funnel in real time.
Test New Marketing Channels
Stay ahead of emerging channels and test their impact on your funnel.
Optimize for Customer Experience
Ensure that each touchpoint offers value and aligns with customer expectations to minimize friction.
5. Tools & Resources
Factors Analytics
Use analytics tools (e.g., Factors) to visualize your funnel performance, track interactions, and uncover insights for optimization.
CRM Systems
Keep detailed records of customer interactions to improve lead nurturing.
Marketing Automation
Automate emails, retargeting ads, and other communications to streamline funnel management.
Customer Acquisition Funnel Review
Review your customer acquisition funnel regularly to ensure that it’s aligned with your business goals, customer needs, and the evolving market landscape. Adjust your strategies as needed to increase efficiency and conversions.
Give Your Conversion Rates a Boost with Customer Acquisition Funnels
Constructing, tracking, and optimizing a customer acquisition funnel provides tremendous benefits for businesses striving for sustainable scalability and revenue growth. It offers an adjustable data-driven framework for:
- Holistically visualizing the customer journey within your company.
- Pinpointing problems impacting conversions and sales velocity.
- Continuously improving marketing and sales processes.
- Cost-effectively acquiring more high-value customers.
The bottom line—taking the time to build and leverage the customer acquisition funnel outlined in this guide is a vital, high-ROI activity for any growth-oriented business.
To recap, with a well-designed and optimized customer acquisition funnel, you can:
- Map the unique stages customers move through on their journey to purchase.
- Identify your most effective acquisition strategies and channels.
- Uncover conversion bottlenecks stunting growth.
- Optimize resource allocation and activities.
- Predict future customer acquisition and revenue performance.
{{CTA_BANNER}}
The customer acquisition funnel is indispensable for sustainably scaling up conversions and sales in highly competitive markets. So, use the available tools to make the most of your traffic effortlessly!
Want to know how Factors can help you on this journey? Book a demo with Factors and let our analytics and attribution experts guide you.
FAQs on Customer Acquisition Funnel
1. What is a customer acquisition funnel?
A customer acquisition funnel is a structured path potential customers follow from first becoming aware of a product to ultimately making a purchase. It consists of stages that segment the customer journey, helping businesses understand and optimize each step to drive higher conversions.
2. Why is optimizing a customer acquisition funnel important?
Optimizing a customer acquisition funnel helps businesses identify roadblocks, improve conversion rates, allocate resources efficiently, and make more accurate growth projections. It also fosters a customer-first mindset, enhancing the overall customer experience and increasing long-term retention.
3. What are the key stages of the customer acquisition funnel?
The key stages are:
- Awareness: Building broad awareness of the product.
- Interest: Engaging prospects with relevant content.
- Consideration: Encouraging leads to evaluate the solution.
- Decision: Finalizing the purchase decision.
- Customer: Onboarding, retention, and loyalty-building.
4. How can tools like Factors help optimize the acquisition funnel?
Factors aggregates customer data across multiple channels, providing a unified view of the entire customer journey. It helps businesses track funnel performance, diagnose issues, and identify the most effective marketing and sales strategies, enabling continuous funnel optimization and improved conversions.
.webp)
Leadfeeder vs Albacross | Compare Features, Pricing & More
Leadfeeder and Albacross are well established lead generation platforms that help B2B teams identify, enrich, and convert anonymous website traffic. There’s no doubt that both tools are great at what they do — but which one is the right choice for you? And might there be an even better alternative?
This blog highlights everything you need to know about Leadfeeder vs Albacross — and why you might want to consider Factors.ai as well.
Leadfeeder vs Albacross - Pricing
Before diving into features, benefits, and limitations, let’s get the most obvious consideration out of the way: pricing.
Leadfeeder Pricing
Leadfeeder [Now Dealfront]’s pricing plans start at €139/mo (or ≅$150/mo) and is scaled based on the number of accounts you wish to identify and enrich. Here’s how pricing plans are scaled at Leadfeeder:
Note that Leadfeeder also offers a free plan with barebones features that’s limited to up to 100 companies identified with only 7 days of data storage. While this plan will almost certainly be insufficient, it’s a great way to get started for free.

Albacross Pricing
Albacross does not openly reveal as much about its pricing plans, but it’s fair to say that they are at least comparable to Leadfeeder. Here’s what we do know about its pricing:
Albacross paid plans start at €79/mo (or $83/mo). Like Leadfeeder, it is scaled up based on the number of accounts you choose to identify and enrich.

Both Leadfeeder and Albacross offer 14-day free trials. While it seems that Albacross has a marginal advantage in terms of pricing, it’s only fair to determine which product is the better fit based on features, benefits and limitations as well.
Leadfeeder vs Albacross - Features
Let’s explore how Leadfeeder and Albacross compare in terms of features
Shared Features
Given that Leadfeeder and Albacross are direct competitors to each other, it’s only natural that they share product features and use-cases. Here’s a breakdown of a few core, common features between the two tools:
1. Company identification
Company identification is at the core of what both products do. Rest assured, Leadfeeder and Albacross are more than capable of accurately identifying and enriching anonymous accounts visiting your website. More context, around this:
Leadfeeder/Dealfront likely wins the spot for the best Europe-specific company data. The now Germany-based company claims coverage of over 66M+ companies across the world, with nearly half of that being from Europe alone. Within its European coverage, it provides deep data (sourced from national trade registers and chambers of commerce) in certain geographies:

Albacross does not openly share as much about its database but is likely comparable to Leadfeeder. In fact, Albacross claims to have built out the largest proprietary IP-to-company mapping database globally with over 100+ B2B attributes. This, however, is challenging to verify without the numbers.

2. Filtering, segmentation & scoring
Of course, not every account visiting your website would be sales-ready ICP companies. To help break through the noise, Leadfeeder and Albacross offer comprehensive filtering, segmentation, and lead scoring functionalities.

This helps automatically filter total identifies traffic down to a few in-market, high-fit accounts based on their firmographic properties (industry, revenue, headcount, etc) and engagement levels (page views, clicks, etc)

3. Integrations
Leadfeeder and Albacross provide a wide range of integrations with CRMs (HubSpot, Salesforce), MAPs, Slack/MS Teams, and other everyday go-to-market tools. In addition, integrations with Zapier helps both tools push data back into any other solution that they don’t natively integrate with.

Integrations are an important consideration when choosing a lead generation tool as it helps eliminate tedious, manual workflow management and empowers automated trigger based actions such as real-time Slack alerts, LinkedIn ads retargeting, CRM updation, and more.

Of course, there’s more to it than just this. But the previous three points cover the crux of what both platforms help with: account intelligence and activation features. Now, let’s look at why you might want to choose one over the other.
Why Leadfeeder over Albacross?
1. Contact database
Although Albacross also provides contact data (mail IDs, phone numbers, etc) based on the accounts visiting your website, it’s only included as part of its premium tier plans. Leadfeeder, on the other hand, provides access to over 200M+ contact-level data points across the board. Note that neither tool can tell exactly who is visiting your website at a user-level. Instead, they provide best-bet recommendations from independent contact databases.

2. User interface
Based on our secondary research, Leadfeeder has a considerable edge over Albacross in terms of user interface. While customers rave about Leadfeeder’s UI, Albacross faces some criticism over its useability:


3. Website analytics
Leadfeeder takes another point over Albacross when it comes to website analytics. While neither tool is especially great at tracking website behavior, Leadfeeder has the advantages of form tracking, video tracking, download tracking, time-spent on page, and other, more granular metrics to gauge accounts engagement.
Why Albacross over Leadfeeder?
1. Pricing
The most obvious advantage Albacross has over Leadfeeder is its pricing. While Leadfeeder technically does offer a few more features, Albacross is unequivocally the budget-friendly option for teams that are early in their ABM journey. If you already use a contact database such as Apollo or Zoominfo, Albacross should be a good starting point for your company identification needs.
2. Lead history
Lead history includes activity data, source of visit, time-spent on page etc. If you’re a company with especially long sales cycles, you probably want to track lead history over several weeks, if not the entire quarter. At the moment, Leadfeeder falters in this regard while offering only up to 30 days of lead history. Albacross, on the other hand, extends history to up to 90 days.
3. Website personalization
Albacross offers nifty website personalization features via integration with VWO and Google Optimize to empower A/B testing based on the nature of accounts visiting your website. This is a valuable tool for product marketers to experiment with different positionings for different buyer personas.
Why Factors over the rest?
And there you have it. A run down of how Leadfeeder and Albacross compare against each other. Before dropping off however, we would be remiss without sharing a little about why Factors might make an even better fit for your lead generation and account intelligence requirement than the latter two.
{{CTA_BANNER}}
In short, Factors does everything Leadfeeder and Albacross do — along with so much more. Here are a few clear advantages Factors has:
1. Data accuracy
Data accuracy is probably the most important consideration when picking an intelligence tool. Without accurate data, you have nothing to work with. Factors partners with industry-leading marketing and sales intelligence solutions 6sense and Clearbit to provide unmatched identification rates of up to 64% — including highly enriched firmographics and technographics data.

2. Lead history (again)
Maintaining lead history and account timelines for longer periods of time can be crucial to B2B teams with longer sales cycles. Leadfeeder maintains lead history for up to 30 days. Albacross maintains lead history for up to 90 days. And Factors maintain lead history — including touch points across ad campaigns, website, CRM, sales interactions, and more — for as long as 1 full year (365 days!) That's more than 4 times as long as the closest alternative.

3. Analytics & attribution
Factors is built upon strong analytics and attribution foundations — which means it provides far more functionality, customization and granularity when it comes to account-level reporting. Among several other features, this includes account scoring, path analysis, funnels, timelines, attribution, KPI reporting and more across campaigns, website, CRM etc.
Comparison Table
To summarize, here’s a quick comparison table of all three platforms for your consideration:

9 Best Sales Intelligence Tools - Benefits, Limitations & Pricing
Sales intelligence tools provide marketing and sales teams with relevant data to refine outreach and targeting workflows and performance. Leveraging sales intelligence tools help drive pipeline by discovering high-intent target accounts (with reverse IP-lookup account identification), surfacing relevant contact data (phone numbers, mail IDs, etc), enriching account profiles (firmographics and technographics), and/or reporting GTM metrics and KPIs. In short, sales intelligence tools provide insights to support better marketing and sales efforts.
Needless to say, sales intelligence relies crucially on accurate, up-to-date data to be of any value. Workflow automations, integrations, UI, customer support, and pricing plans are other factors you should consider when evaluating a sales intelligence tool.
While there’s no shortage of sales intelligence solutions out there, it can be challenging to pick one that aligns with your requirements and budget. The following article reviews the top 8 sales intelligence tools for your consideration.
Sales Intelligence - Account Level
Depending on the nature of your business, your total addressable market may be very, very large. Especially for SMEs with limited resources, it wouldn’t make sense to go after each and every account in your TAM. Instead, it's important to identify and prioritize those ICP accounts that showcase the most buying intent with your brand.
Account intelligence tools use reverse IP-lookup to do just that: identify and qualify anonymous, high-intent companies that are already engaging with your brand but are yet to convert. Account intelligence tools deanonymize traffic to reveal account names, firmographics, technographics and more.
With account intelligence tools, you may target warm accounts as opposed to cold, brand-unaware ones. This, unsurprisingly, results in more conversions than ever before. Here are 4 robust account intelligence platforms for your consideration:
1. Factors.AI

Factors is an AI-fuelled account intelligence solution built upon strong analytics and attribution foundations for B2B teams. Factors provides a wide range of features including account identification, account scoring, workflow automations, multi-touch attribution and more.
Features
- Account identification - discover anonymous accounts interacting with your brand
- Account enrichment - enrich accounts with firmographics and technographics
- Analytics & attribution - KPI reporting, funnels, path analysis, multi-touch attribution and more
- Journeys & scoring - Bird’s eye view of customer journeys and account scoring based on cross-channel engagement
- Workflow automations - Configure real-time alerts, trigger-based emails, CRM updates and more based on intent signals
Benefits
- Data-accuracy - Factors works with industry-leading data partners including 6sense and Clearbit to deliver accurate account identification match rates of up to 64%. This includes firmographics and technographics such as geos, industry, revenue range, employee headcount, etc.
- Holistic scoring - Deep-rooted collaborations with LinkedIn and G2 in addition to website engagement ensures that accounts are scored holistically across the most common channels
- Robust analytics - Given that Factors is built upon strong analytics and attribution foundations, it provides unmatched granularity in terms of reporting and reporting techniques — so you can make data driven decisions, effortlessly
Limitations
- Contact-level data: At the moment, Factors does not provide contact-level data such as email IDs or phone numbers. Instead, users will have to integrate this data from a contact database provider like Apollo or ZoomInfo.
- Native integrations: At the moment, Factors provides native integrations with the most popular B2B ad platforms, CRMs, MAPs, CDPs, and more. That being said, it misses out on integrations with lesser used platforms like Zoho. Note that data may still be pushed from Factors to nearly any other tool in the webhooks (Zapier, Make.com, etc).
Pricing
Factors pricing is based on the number of accounts identified (or volume of monthly website traffic). Factors does offer a free trial and a free plan. Learn more about Factors pricing here: www.factors.ai/pricing
2. Clearbit

Clearbit is an industry-leading sales and marketing intelligence platform that helps teams gain deeper insights into their customers, enhancing marketing efforts and sales strategies. Through a suite of APIs, Clearbit integrates with existing systems, providing real-time identification and enrichment data.
Features
- Reveal - Clearbit identifies anonymous website visitors using IP-lookup. Given that every tool on this list does this, data accuracy and pricing are two important considerations when differentiating between alternatives.
- Enrichment - Clearbit also provides firmographics from over 250 data sources. This includes technologies, headcount, revenue, location, contact information, and more.
- Capture - like Leadfeeder Contacts, identifies best-fit contacts from companies visiting your website to reach out to with retargeting campaigns or outbound efforts
Benefits
- Intuitive UI - Clearbit is a well-established platform with an intuitive, accessible user interface making it easy to plug and play for most teams.
- Strong integrations - Clearbit provides deeper, two-way integrations with CRMs, Internals comms, and other everyday GTM platforms as compared to other tools on this list.
- Contact database - In addition to account level data, Clearbit also provides a contact database to streamline the outreach process by recommending relevant people to get in touch with.

Limitations
- Pricing - While Clearbit boasts an impressive database, it’s definitely a more premium product. Pricing starts at around $12,000 annually for its more basic plans. This might be inaccessible for early-stage SME teams.
Pricing
Clearbit does not openly reveal its pricing but estimates place it starting at about $12,000-$20,000 a year. Learn more about Clearbit pricing by connecting with their sales team.
3. Leadsquared

LeadSquared CRM is a sales and marketing automation platform to boost sales productivity and revenue outcomes. Salespeople can sell a lot faster and smarter by using LeadSquared's customizable workflows, reminder systems, and lead scoring features. The tool also provides complete visibility into the prospects activities and preferences in a single view, for a more personalized selling experience.
Features
- Automated Lead Management: Capture, distribute, and track leads at every stage of the sales funnel.
- Reports and Analytics: In-depth reports for managers to analyze sales performance, forecast sales, and manage the team's targets.
- Segmented User Lists: Assign customers to lists based on various parameters such as demographics, preferences, etc. Businesses can set up trigger-based communication for every list to personalize communication.
- Mobile CRM: Track field sales activities and interactions as your sales reps get through the day. The Mobile CRM also allows them to upload documents and lead data from their phone.
- Built-in-dialer: Set up one-click calls to prospects, manage call logs, recordings, and notes by integrating with IVR solutions.
Benefits
- Completely customizable: LeadSquared is a good fit for businesses of all sizes, no matter how complicated their workflows are. The product and workflows can be customized to solve specific business challenges.
- Integrations: All your data can be centralized on the CRM because it can be easily integrated with most of the popular tools.
- Security: LeadSquared is compliant with all the laws and regulations related to data security. So, businesses never have to worry about the data they add on the platform.

Limitations
Initial training: Users who are new to using a CRM might require training while setting up complex automation and reporting.
Pricing
LeadSquared offers three plans based on the features businesses may require. Here are the specifications of these plans:

4. Leadfeeder/Dealfront
Leadfeeder [Now Dealfront] is another popular account intelligence solution that’s been around for quite some time. It has recently rebranded itself as Dealfront — a Europe-centric GTM intelligence platform. This has resulted in several former customers looking for Leadfeeder Alternatives. That being said, it’s still a comprehensive solution depending on your use-case.
Features
- Account identification - As with other tools on this account intelligence list, Leadfeeder identifies the names of the companies visiting your website.
- Leadfeeder Contacts - As with Clearbit, Leadfeeder also provides contact-level data based on the accounts visiting your website
Benefits
- Europe-centric data - If you’re looking for Europe-focused sales intelligence, Leadfeeder may be the best choice for you, given that it especially specializes in European geographies.
Limitations
- Shacky integrations - While Leadfeeder provides a wide range of integrations, users often find discrepancies and inaccuracies in terms of data synchronization.
- Poor customer success - Several users complain about Leadfeeder’s poor customer success, claiming it to be pushy and unhelpful.


Pricing
As with most other tools on this list, Leadfeeder pricing is based on the volume of data consumed. Leadfeeder does offer a free plan. Leadfeeder pricing starts at about $150.

5. Albacross

Finally, we arrive at Albacross. Albacross is another leading sales intelligence tool. The Sweden-based platform works with 10,000+ companies to provide data enrichment, sales alerts and intent signals.
Features
- Account Identification: Albacross identifies anonymous accounts, firmographic information and visitor intent. Albacross features one of the largest proprietary first-party databases in the world.
- Personalization: Albacross natively integrates with popular personalization tools such as Optimizely and VWO to customize website content based on who’s visiting the site.
- Display ads: Albacross can also launch and monitor display ads within the platform itself. The software partners with several publicists such as The New York Times and Daily Mail to distribute account-level targeted ads.
Benefits
- Experimenting: Albacross offers the unique benefit to experiment and run A/B tests in conjunction with visitor identification and intent data.
- Customer success: Several reviews rave about Albacross’s stellar customer success management. Given that Albacross is considered to be an involved, enterprise-level tool, it’s essential to have this level of support to get the most value out of the product.

Limitations
- Rigid firmographics and filters - Albacross lacks agility when it comes to filters and breakdowns. Reviews reveal that, unlike other tools on this list, Albacross is currently unable to filter identified companies based on firmographics such as name or size. As a result, users seem to find sorting and reporting somewhat challenging.
- Buggy integrations: Multiple reviews claim that Albacross’s integrations, especially with CRMs like Salesforce, could do with some work. Given that visitor identification is primarily used to support ABM, this can be a major drawback to B2B teams.
- Limited documentation and resources make users overly reliant on customer success teams

Sales Intelligence - Contact Level
Identifying in-market accounts is a fantastic start to optimizing GTM performance. But once you have a set of target accounts, you also need to know who to reach out to within those accounts for the best chance of conversions. You need phone numbers, email IDs, and LinkedIn profiles to get in touch with the relevant stakeholders and move forward with outreach and targeting.
This next set of sales intelligence tools helps with just that: Identifying relevant contacts and their contact information from your target accounts using enormous contact databases.
6. Apollo
Apollo is a sales intelligence and engagement platform. It is an end-to-end sales solution platform with over 265 million contacts. It provides access to rich buyer data, analytical insights and automated and personalized workflows for outreach.
Features
- Enrich: Apollo helps search and enrich lead data leveraging their extensive B2B database.
- Prospect: Using over 65 data attributes, Apollo helps you build lists and filter leads with precision
- Engage: automated sequencing across channels like LinkedIn, SMS, email, etc with AI-powered hyper personalisation.
Benefits
- Powerful Search Tool: The search capabilities are robust, allowing you to fine-tune our searches for targeted sales prospecting.
- Great Support: The customer support team has been responsive and helpful whenever we've had questions or needed assistance.

Limitations
Surface-level LinkedIn Integration: No cross-platform automation available with LinkedIn
Steep learning curve: The numerous customizations and variables can be overwhelming for beginners
Pricing
Apollo.io has user based pricing model with a basic plan that starts at $49 dollars/user per month:

7. Slintel
Slintel is an advanced sales intelligence software that provides valuable technographic data and helps enhance leads by offering precise details about prospects, including email addresses and contact information.
Features
- Buyer enrichment: rich database which provides additional information about their leads and prospects, such as company size, location, and industry
- Buyer intent tracking: Slintel has a valuable indicator to signify a lead’s readiness to purchase.
- People Profiles: Slintel’s database also provides detailed information about the individuals within a company, including their job titles, responsibilities, and contact information.
Benefits
- Technographic filtering: Slintel features unique filters based on understanding the technologies that their leads and prospects are using.
- API suite: Slintel’s API offers range of integrations that help connect with your teams’ current operating system, workflow, and technological infrastructure
Limitations
No mobile credits: Slintel has overlooked an important outbound channel by not providing mobile credits in any of their plans.
Pricing
Slintel has tiered pricing and prices for each plan vary based on the number of leads and users, as well as the duration of the subscription.

8. LinkedIn Sales Navigator
LinkedIn Sales Navigator is a popular sales intelligence that enables professionals to expand their network, find potential customers, and engage in effective lead generation. It offers advanced search capabilities, personalized insights, and seamless integration with other sales tools for enhanced prospecting and relationship building.
Features
- Search Feature: The Sales Navigator advanced search function gives reps the power to more narrowly target their ideal leads and discover relevant connections.
- Automated Lead Generation: The Lead Recommendations feature suggests relevant leads based on your sales preferences, search history, profile views, and past saved leads.
- Real-time updates: Sales Navigstor provides real-time updates on their leads and accounts, including job changes, company updates, and news mentions.
- Customized Lists: Users can create and save customized lead and account lists for targeted outreach.
Benefits
- Lead Tracking and Notes: Users can save leads and accounts, add notes, and track interactions, helping them stay organized and keep a record of their sales activities.
- InMail Credits: users get a certain number of InMail credits with a sales navigator subscription, which allow them to send direct messages to LinkedIn members even if they are not connected.
Limitations
- Cost: LinkedIn Sales Navigator is a premium service and can be relatively expensive, especially for individual users or small businesses. The cost may be a barrier for some users.
- Learning Curve: The platform has a steeper learning curve and it may take time to fully understand and utilize all its features effectively.
- Limited InMail Credits: While Sales Navigator provides limited InMail credits. If users exhaust their credits, they may need to purchase additional ones, which is costly.
Pricing
LinkedIn Sales Navigator offers three pricing tiers: Core, Advanced, and Advanced Plus:

9. Lusha
Lusha is a lead generation and data enrichment tool that aims to help companies generate qualified leads and maximize conversions. It helps manage business leads, company contacts, and B2B databases fo better sales prospecting.
Features
- Team: Lusha lets you add team members and create different groups within the application to facilitate collaboration.
- Technology Filter: Lusha's Technographic filters that give businesses the ability to target companies based on the technology stack they are using.
- Salesforce Data Enrichment: Lusha's Salesforce Data Enrichment feature automatically enriches Salesforce records with accurate contact and company data.
- Intent: Lusha allows you to filkter prospects based on their behavioral signals
Benefits
- High Accuracy: Lusha claims the highest accuracy rate in the entire industry, claiming 81% accurate emails and phone numbers to their users for cold outreach.
- User-friendly interface: The platform interface is intuitive and easy to navigate for beginners.
- Chrome extension: Lusha’s chrome extension is a value add that makes it easy to get the contact information from the browser directly.
- Responsive customer support: The customer support team is extremely responsive and friendly, helping improve the user experience.
Limitations
Data Security: there are reports of outrage from customers that accuse Lusha of selling their personal information to third parties.
Pricing
Much like most softwares on this list, Lusha has a usage based pricing model with 4 plans- free, pro, premium and scale:

10. SDRx
SDRx is an AI SDR that builds targeted lists, conducts account research, and crafts personalized emails with follow-ups tailored to the prospect's journey. SDRx works like a 24/7 sales assistant, managing your outreach activities so you can dedicate your time to meaningful prospect interactions.

Features:
- List Building: Identifies and generates precise account and prospect lists matching Ideal Customer Profiles (ICPs).
- Comprehensive Account Research: Collects actionable insights from internal and external data sources.
- Personalized Email Creation: Leverages 25 proven email frameworks to maximize response rates.
- Multi-Channel Outreach: Automatically customizes follow-up frequency and messaging based on the prospect's buying stage.
- 24/7/365 Continuous Operation: Eliminates ramp time and burnout associated with traditional sales development.
Benefits:
SDRx's claims to combine deep account research, end-to-end email deliverability, and the use of 25 copywriting frameworks to conduct multi-channel outreach.
Pricing:
Pricing details are available upon request.
In conclusion, your ideal sales intelligence tool should offer a comprehensive suite of features that empower you to not only identify potential customers but also to understand their buying decisions. It should automate workflows, personalize communication, and enable more effective outreach. The tool should be dynamic, relying on real-time data and signals to connect with the right buyers at the right time.
As you pick your sales intelligence tool, understand the role of technology in your broader GTM strategy. Look for a tool that can seamlessly integrate with your existing systems, enabling a cohesive and efficient approach to lead generation and customer engagement. Let your sales intelligence tool become a strategic partner in your business's success- schedule a demo with Factors.ai

