
Heading 2
Pipeline Velocity: Definition, Formula & Strategies
Learn what pipeline velocity (aka sales velocity) is, the formula to calculate it, SaaS benchmarks, and 5 proven strategies to speed up your sales pipeline in 2026.
Written by
Edited by

Subiksha Gopalakrishnan
Growth Marketer
Summarize this article


.svg)

TL;DR
- Pipeline velocity measures how fast qualified opportunities move through your sales pipeline and convert to revenue.
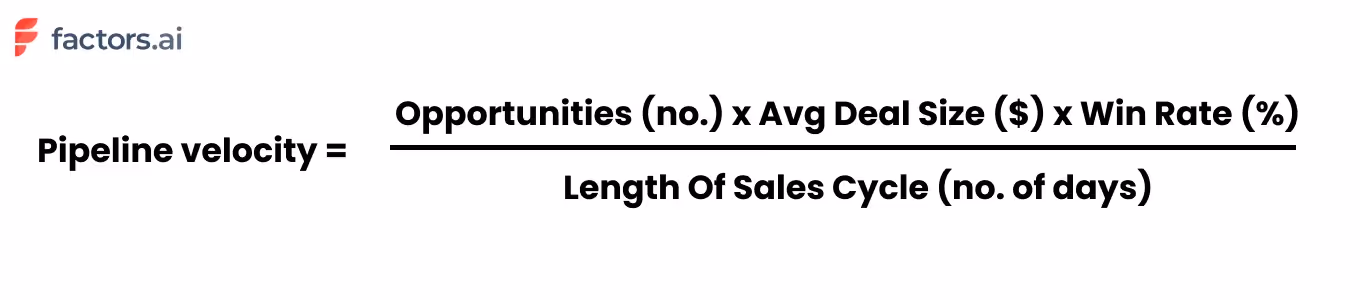
- Formula: (Number of Opportunities × Average Deal Size × Win Rate) ÷ Sales Cycle Length (in days).
- Why it matters: It provides a real-time, data-driven revenue forecast and uncovers pipeline bottlenecks.
- How to improve it: Increase qualified opportunities, raise deal size, boost win rates, or shorten sales cycles.
- Key benchmark: SaaS win rates typically range from 5–20%; sales cycles range from 14 days (<$2K ACV) to 9 months (>$100K ACV).
There's no doubt that B2B sales is increasingly being conducted in a methodical, scientific manner. Using a wide range of metrics and KPIs, this data-driven sales process ensures minimal revenue leakage and optimized pipeline performance. You may have heard of a few common sales metrics: customer acquisition cost, customer lifetime value, average revenue per user, etc.
This article focuses on a lesser known, yet enormously important metric to monitor & improve the overall health of sales: pipeline velocity (also known as sales velocity or sales pipeline velocity). Let's explore everything you need to know about pipeline velocity; what it is, how to calculate it, and most importantly, how to improve it.
What is pipeline velocity?
In short, pipeline velocity is the speed at which qualified opportunities move through the sales pipeline.
In other words, pipeline velocity is used to measure how quickly leads are being converted into paying customers. This helps understand the efficiency of the sales process and identify areas of improvement.
Think of a literal pipeline: if it's chock-full of debris and leaks, the flow of water will be limited and inefficient. On the other hand, if it's squeaky clean, a large volume of water can flow uninterrupted at maximum speed.

Similarly, a high-velocity sales pipeline results in a consistent, voluminous flow of leads and ultimately, revenue. You can see why it's so important to keep track of this metric.
Pipeline Velocity vs. Sales Velocity: What's the Difference?
You'll often see pipeline velocity and sales velocity used interchangeably — and in most cases, they refer to the same metric. Both measure how quickly deals move through the pipeline and generate revenue using the same formula.
However, some teams draw a subtle distinction:
- Pipeline velocity focuses on the speed of opportunities moving through pipeline stages — from qualified lead to closed-won.
- Sales velocity emphasizes the dollar value of revenue generated per unit of time (e.g., $2,000/day).
For practical purposes, you can treat them as synonyms. The important thing is to measure consistently and use the metric to identify bottlenecks and forecast revenue.
How to calculate pipeline velocity?
Pipeline velocity is calculated using 4 other metrics:
- Opportunities - how many qualified opportunities are in your pipeline?
- Deal size - what is the average contract value of deals in your pipeline?
- Win rate - what percentage of opportunities will likely convert successfully?
- Length of sales cycle - on average, how many days does it take to close a deal?
Here's the most commonly accepted pipeline velocity formula:
Pipeline velocity = (Opportunities x average deal size x average win rate) ÷ length of average sales cycle (in days)
Let's take an example. Say we have 60 qualified opportunities at various stages along the pipeline. The average deal size of these opportunities is $5000. Historically, we've observed a win rate of 20% and sales cycles of around 30 days. Accordingly, our pipeline velocity may be calculated as follows:

Extrapolating this, we arrive at a figure of $2000/day x 30 days for $60,000 per month.
Pipeline Velocity Calculator
Want to calculate your own pipeline velocity? Use this simple framework:
- Count your qualified opportunities — only include deals that have passed your qualification criteria (e.g., BANT or MEDDIC).
- Find your average deal size — pull this from your CRM's closed-won deals over the last 90 days.
- Calculate your win rate — divide closed-won deals by total closed deals (won + lost) over the same period.
- Measure your average sales cycle — average the number of days from opportunity creation to close for deals closed in the last 90 days.
- Apply the formula: (Opportunities × Deal Size × Win Rate) ÷ Sales Cycle Days = Your Pipeline Velocity
Example: 50 opportunities × $8,000 deal size × 15% win rate ÷ 45 days = $1,333/day (or approximately $40,000/month).
You may notice from the pipeline velocity formula that there are a few ways to improve pipeline velocity:
- Increase number of opportunities
- Increase average deal size
- Increase win rate
- Decrease length of sales cycle
Each variable is a lever that may be pulled to ramp up pipeline velocity. Of course, the most obvious way is to increase the number of opportunities/leads and deal size (easier said than done!). That being said, improving the buyer experience is a low-hanging fruit that results in dramatic improvements in win rates and quicker sales cycles.
But what makes improving the pipeline velocity so important anyway? Here are a few benefits of tracking and optimizing pipeline velocity:
Why is pipeline velocity important?
As HubSpot's director of sales, Dan Tyre, puts it:
"Sales managers live in fear that their pipeline is a bunch of fluff. In today's world of instant gratification, uncovering a sense of urgency and establishing sales pipeline velocity is important because it uncovers a slow-moving, or worse, stagnant pipeline".
1. Understand the overall health of the sales pipeline
Understanding your pipeline velocity helps keep tabs on the overall health of your sales pipeline. By knowing what works and what needs improvement, you can bring iterative, targeted changes to the sales engine. More revenue, less costs — win, win!
2. Ensure accurate sales forecasting
Measuring your pipeline velocity on a regular basis helps with accurate sales forecasting. For instance, taking the previous example, we have a pipeline velocity of $2000 per day, which can be expanded to $60,000 per month or $180,000 for the quarter. Using pipeline velocity is accurate as it's based on real-time sales data, not estimates.
3. Improve attribution & ROI
A powerful use-case is realized when pipeline velocity is used in tandem with attribution modeling. Picture this: each of your pipeline sources, broken down by qualified opportunities, deal size, win rate, and of course, pipeline velocity:
In combination with attribution, pipeline velocity can provide valuable insight into the most effective channels — which in turn can help guide marketing decisions and resource allocation. In this case, we see that even though paid social brings in more opportunities, it's paid search that results in the most ROI given its larger deal size and better win rate.
Sales cycle benchmarks for SaaS
Pipeline velocity itself varies significantly based on the nature and size of the company in question. Instead, here's a breakdown of the benchmark of length of sales cycles in SaaS
Length of sales cycle:
- Deals < $2000 ACV: 14 days
- Deals < $5000 ACV: 30 days
- Deals < $25,000 ACV: 90 days
- Deals < $100,000 ACV < 90-180 days
- Deals > $100,000 3 - 9 months
Depending on the nature of your business, your win rate should be anywhere from 5-20%. Of course, the number of opportunities and deal size is specific to your product, marketing & sales efforts. It wouldn't make sense to maintain or refer to benchmarks in this case.
How to Track Pipeline Velocity in SaaS
For SaaS companies, pipeline velocity is especially critical because of recurring revenue models and the compounding impact of faster deal cycles. Here's how to set up effective tracking:
1. Define Your Pipeline Stages Clearly
Map each stage from MQL → SQL → Opportunity → Proposal → Closed-Won. Ensure your CRM reflects these stages accurately so velocity calculations are meaningful.
2. Segment by Deal Size and Segment
Track velocity separately for SMB, mid-market, and enterprise deals. A $2K ACV deal closing in 14 days and a $100K deal closing in 180 days will produce very different velocity figures — combining them masks actionable insights.
3. Set Up Automated Reporting
Use your CRM (HubSpot, Salesforce, etc.) or a revenue intelligence tool like Factors to automatically calculate pipeline velocity weekly. Manual tracking introduces errors and delays.
4. Monitor Trends, Not Snapshots
A single velocity reading is just a snapshot. Track velocity weekly or monthly to spot trends — a declining velocity over 3+ weeks signals pipeline health issues that need immediate attention.
How to Identify Pipeline Bottlenecks
Before you can improve pipeline velocity, you need to diagnose where deals are getting stuck. Here are the most common pipeline bottlenecks:
- Long time-in-stage: If deals spend 2x the average time in a particular stage, that stage needs attention — whether it's slow follow-ups, missing stakeholder buy-in, or unclear next steps.
- High drop-off at specific stages: A sharp decline in conversion between stages (e.g., Demo → Proposal) indicates friction in that transition.
- Stale deals: Opportunities that haven't had activity in 14+ days are often dead weight. Regularly audit and remove or re-engage them.
- Qualification gaps: As one Reddit user noted, "Velocity slows when pipeline reflects interest rather than intent." If unqualified deals enter the pipeline, they inflate the denominator without contributing to wins.
How to improve pipeline velocity?
In short, improving pipeline velocity involves eliminating points of friction along the customer journey and aligning workflows and stakeholders to ensure smooth sailing. Here are a few tactics and strategies to do so:
Here's a quick-reference table showing the impact of improving each lever:
1. Make the most of existing traffic
Your website is a goldmine of hidden opportunities in the form of yet-to-be-converted accounts. Use an IP-based account intelligence tool (like Factors) to reveal anonymous accounts already engaging with your website, review pages, and ad campaigns.
Given that these accounts are already familiar with your brand, they're far more likely to convert: thereby increasing your "number of opportunities" and "win-rate".
2. Let visitors experience your work
As companies increasingly move towards product-led growth, it's becoming all the more important to show, not tell. While not all products (especially those at early stages) can adopt PLG models, it's really quite simple and effective to put up an interactive product tour on your website. This gives visitors a chance to know a little more about your work before choosing to book a demo, rather than having to go in blind.
{{CTA_BANNER}}
Again, this likely increases the number of opportunities, reduces average sales cycle length, and improves your win rate.
3. Document. Everything. Always.
There's no doubt that sales demos and discovery calls are important. But more often than not, buyers don't have the time to sit through another 30-min. Make life easier for your sales reps, CS team, and of course, the customers themselves by introducing comprehensive documentation on everything they might need to know.
Use-cases, How-tos, Implementation, etc, etc, etc should be easily accessible to anyone interested in your work — to mitigate the risk of unnecessary back-and-forth friction. This will certainly help reduce the length of the sales cycle.
4. Align relevant stakeholders
A vital, yet often overlooked step is ensuring alignment across marketing, sales, CS, and the customers. This involves timely handoffs, relevant communication, straightforward pricing and product details, and clear PoCs across every stage of the customer journey. This helps both the customer and internal departments streamline the sales process end-to-end.
5. Stay on top of data & metrics
The accuracy of your pipeline velocity metrics (and any other metric, really) relies heavily on the quality of your data. Ensure you're regularly maintaining numbers on qualified opportunities, deal size, and length of sales cycle in your CRM so the same may be leverage for pipeline velocity measurement.
What Sales Teams Actually Say About Pipeline Velocity
Pipeline velocity is widely recommended in sales literature, but what do practitioners think? Here's what real sales teams are saying:
The Good
- "Sales velocity helps forecasting in that you base it off actual historical data" — r/SalesOperations. Unlike gut-feel forecasts, velocity is grounded in real CRM data.
- Revenue leaders on LinkedIn consistently call pipeline velocity "the single metric that tells you how fast money is moving through your revenue engine."
The Challenges
- "The one thing that kills pipeline velocity is when everyone thinks they're aligned on lead definitions, but they're actually working off different criteria." — r/b2bmarketing. Marketing-sales alignment is critical.
- Data quality is the #1 blocker. If your CRM data is messy, your velocity calculation will be unreliable.
Pro Tip from the Community
Many experienced RevOps professionals recommend tracking stage-by-stage velocity rather than just overall pipeline velocity. This gives you granular insight into exactly where deals slow down — making it much easier to take targeted action.
How Factors help monitor & improve pipeline velocity
As important as it is, it can be a tedious, unintuitive chore to measure pipeline velocity — unless you have the right analytics solution, of course :)
Factors is an AI-fuelled intelligence & analytics platform that helps teams identify, score, and track accounts across the customer journey. We're talking about automated sales velocity calculations, flexible conversion funnels, IP-based account identification, multi-touch attribution, and more — everything you need to kickstart and refine your ABM process and…pipeline velocity!
Accelerate B2B Sales with Pipeline Velocity Optimization
Pipeline velocity is a crucial metric that measures how quickly qualified leads convert into customers, enabling businesses to refine their sales process.
It's calculated using four key factors:
1. Opportunities: The number of deals in your pipeline.
2. Deal Size: The average value of each deal.
3. Win Rate: The percentage of deals successfully closed.
4. Sales Cycle Length: The time it takes to close a deal.
Improving pipeline velocity enhances sales forecasting, boosts ROI, and ensures a healthy pipeline. Strategies include optimizing existing traffic, effectively showcasing products, and aligning stakeholders for smoother deal progression. AI-driven tools like Factors streamline tracking and analysis, making it easier to refine your sales process and drive faster conversions.
Frequently Asked Questions on Pipeline Velocity
Q1. What is a good pipeline velocity?
A "good" pipeline velocity depends on your industry, deal size, and sales cycle. Rather than chasing an absolute number, focus on trending your velocity upward over time. If your velocity is $2,000/day this quarter and $2,500/day next quarter, that's a 25% improvement regardless of what competitors achieve.
Q2. What is the pipeline velocity rate?
The pipeline velocity rate is the dollar amount of revenue your pipeline generates per day. It's calculated using the formula: (Number of Opportunities × Average Deal Size × Win Rate) ÷ Sales Cycle Length. For example, if you have 60 opportunities, a $5,000 average deal size, a 20% win rate, and a 30-day sales cycle, your velocity rate is $2,000/day.
Q3. How do you calculate pipeline velocity?
Pipeline velocity = (Number of qualified opportunities × Average deal size × Win rate) ÷ Average sales cycle length in days. Multiply the number of deals in your pipeline by the average deal value and your historical win rate, then divide by how many days it typically takes to close a deal.
Q4. What does sales pipeline velocity mean?
Sales pipeline velocity (also called sales velocity) measures how quickly qualified leads move through your sales pipeline and convert into paying customers. It tells you how much revenue your pipeline generates per day, helping with forecasting, resource allocation, and identifying bottlenecks.
Q5. What is deal velocity?
Deal velocity is closely related to pipeline velocity but focuses on individual deals rather than the entire pipeline. It measures how quickly a specific deal progresses from one stage to the next. Tracking deal velocity helps sales managers identify which deals are progressing normally and which are stalling.
Q6. How does pipeline velocity differ from pipeline coverage?
Pipeline velocity measures speed — how fast deals move through the pipeline. Pipeline coverage measures volume — whether you have enough pipeline to hit your quota (typically 3-4x coverage is recommended). Both are important: high coverage with low velocity means you have lots of deals but they're not closing fast enough.

See how Factors can 2x your ROI
Boost your LinkedIn ROI in no time using data-driven insights
Try AdPilot Today


.avif)

.avif)
See Factors in action.
Schedule a personalized demo or sign up to get started for free
LinkedIn Marketing Partner
GDPR & SOC2 Type II

.svg)