
.webp)
Intuition can only take us so far: Fun with Factors (Part 1)
“Trust your intuition; it never lies.”, a saying most of us have heard and might strongly agree with. But at Factors this week, things were quite different when we had a session on “Intuition can only take us so far”. The idea was to relook at known concepts -- concepts we use more often than not -- and reimagine their implications from different perspectives. This article is an account of the one-hour discussion. We associate the word “factors” with different concepts at different times. Here, we associate it with maths!
Mathematics: Sturdy yet fragile
We started with the following story from “How Mathematicians Think” by Willian Byers:
A mathematician is flying non-stop from Edmonton to Frankfurt with Air Transat. The scheduled flying time is nine hours. Sometime after taking off, the pilot announces that one engine had to be turned off due to mechanical failure: "Don't worry -- we're safe. The only noticeable effect this will have for us is that our total flying time will be ten hours instead of nine." A few hours into the flight, the pilot informs the passengers that another engine had to be turned off due to mechanical failure: "But don't worry -- we're still safe. Only our flying time will go up to twelve hours." Sometime later, a third engine fails and has to be turned off. But the pilot reassures the passengers: "Don't worry -- even with one engine, we're still perfectly safe. It just means that it will take sixteen hours total for this plane to arrive in Frankfurt." The mathematician remarks to his fellow passengers: "If the last engine breaks down, too, then we'll be in the air for twenty-four hours altogether!"
Well, from basic math knowledge, you might find the next number in the sequence 9, 10, 12, 16 to be 24. Here’s how you find it. The first four numbers could be broken down as follows:
9 = 9
10 = 9+2⁰
12 = 9+2⁰+2¹
16 = 9+2⁰+2¹+2²
Pretty clearly, the next number in the sequence has to be 9+2⁰+2¹+2²+2³ = 24.
But does that mean the plane will stay in the air for 24 hours? No. It has only four engines. And if the last one breaks down too, the pilots would either perform an emergency landing or, in the unfortunate case, it would lead to a fatal crash. This shows both the strength and the fragility of maths. While in the first four cases, we could accurately measure how long the journey would take, as soon as the conditions are changed (i.e., gliding into the air instead of being thrusted by engines), the dynamics of motion change too.
Intuition could misdirect
Following is an example the “professor of professors”, Prof. Vittal Rao had given in one of his talks: Imagine you have some identical coins you are supposed to distribute among some identical people. How would you do that? Or more mathematically: In how many different ways P(n) can you distribute n identical coins to any number of identical people? Let us understand the problem by taking cases:
n = 1
- The only way to do that is to give it to a single person: o. Hence, P(1) = 1.
n = 2
Distribute 2 coins. Here are two different ways:
- You either give both coins to one person: oo
- Or you take two people and hand them a coin each: o|o
Hence, P(2) = 2.
n = 3
Distribute 3 coins. What do you think P(3) should be? If P(1) = 1, P(2) = 2, we could expect P(3) to be 3, right? Let’s see.
- ooo
- oo|o
- o|o|o
And 3 it is! Hence, P(3) = 3.
n = 4
Now this drives our intuition even further. The sequence we have seen until now has been 1, 2, 3. So it’s natural to assume P(4) to be 4. Let us enumerate all cases again.
- oooo
- ooo|o
- oo|oo
- oo|o|o
- o|o|o|o
We have 5 ways to distribute 4 coins -- this beats our intuition. We get P(4) = 5.
n = 5
With new information in hand (i.e., the sequence being 1, 2, 3, 5), we could update our intuition and say this matches the Fibonacci sequence, and expects it to follow 1, 2, 3, 5, 8, 13, ... Let’s see what happens with 5 coins in hand:
- ooooo
- oooo|o
- ooo|oo
- ooo|o|o
- oo|oo|o
- oo|o|o|o
- o|o|o|o|o
We get P(5) = 7 (not 8 as we had expected).
n = 6
Now what? We could now turn to a different logic: They are either odd numbers (barring the extra ‘2’) following 1, 2, 3, 5, 7, 9, 11, …, or prime numbers (barring the extra ‘1’) following 1, 2, 3, 5, 7, 11, 13, ..., giving P(6) to be either 9 or 11 respectively. Taking n = 6, we have:
- oooooo
- ooooo|o
- oooo|oo
- ooo|ooo
- oooo|o|o
- ooo|oo|o
- oo|oo|oo
- ooo|o|o|o
- oo|o|o|oo
- oo|o|o|o|o
- o|o|o|o|o|o
That’s 11 ways! The prime-number logic worked.
n = 7
Going by the same logic, we would expect P(7) to be 13 (the next prime number). Now, if you would go on and calculate it, we would have P(7) to be, in fact, equal to 15 (please go ahead and enumerate them).
In fact, it turns out that the sequence P(n) expands as follows: 1, 2, 3, 5, 7, 11, 15, 22, 30, 42, 56, 77, 101, 135, 176, 231, 297, 385, 490, etc. You could take a moment and think about it intuitively, but chances are rare that you would come up with the following formula:
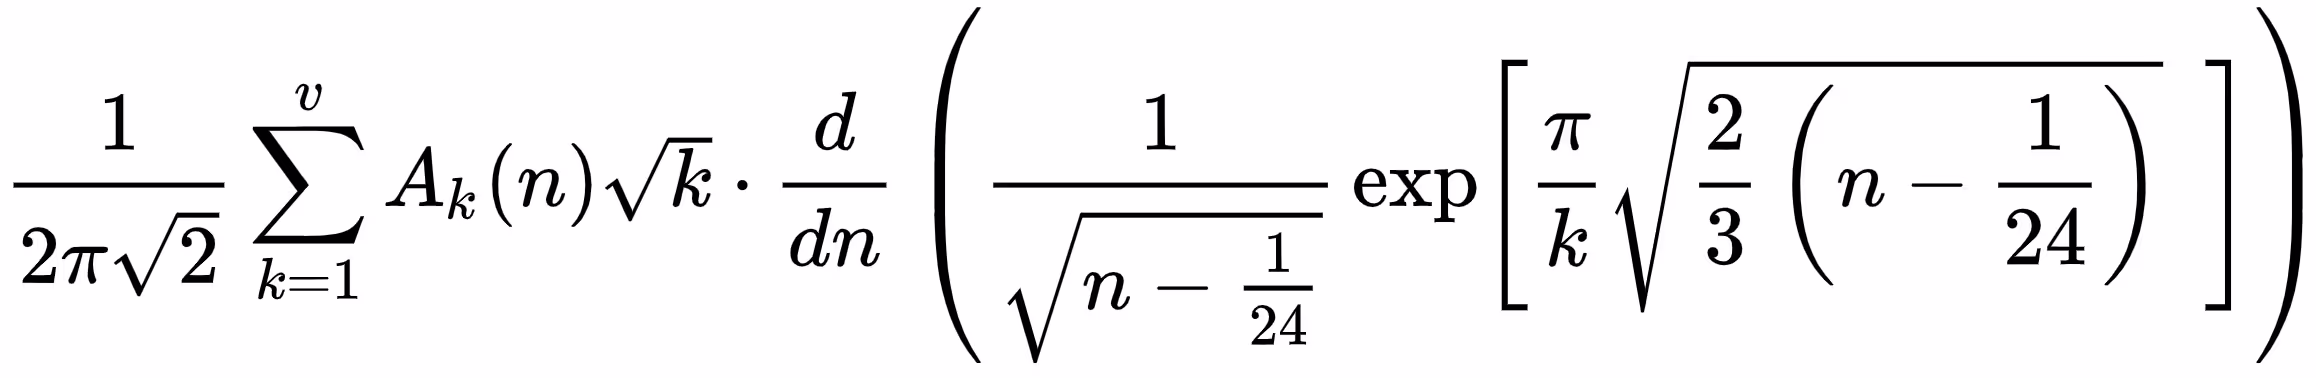
approximating P(n), where we have:
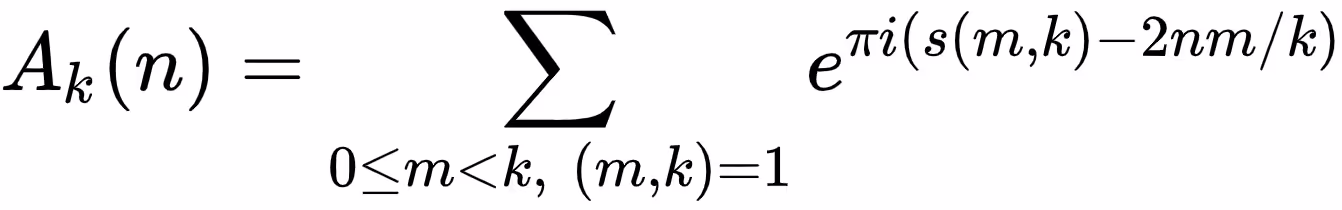
The foregoing formula was derived by the well-renowned mathematician Srinivasa Ramanujan (along with G. H. Hardy). This illustrates the fact that intuition could take us only so close to the solution, and formal maths might have to be invoked in some cases.
At Factors, we support the philosophy of crunching numbers (rather than intuition) to provide intelligent marketing insights, which are only a demo away for you to experience. To read more such articles, visit our blog, follow us on LinkedIn, or read more about us.
Find the next article in this series here.
.webp)
Intuition can only take us so far: Fun with Factors (Part 2)
Continuing with our series on “Fun with Factors” (please find the first part here), we had another session on “Intuition can only take us so far”, wherein we discussed how non-intuitive concepts such as irrational numbers are very much real. Furthermore, we established the importance of grounding ideas to their bare-bones structure, lest we confuse ourselves and fall into paradoxes.
The Irrational Route
For a number to be rational is to possess the ability of being expressed in the form of a fraction -- or the well-known p-by-q (p/q). Now, just for completeness, recall that ‘p’ and ‘q’ should be integers. And ‘q’ should be non-zero.
That said, is it not easy to see that every number is rational? What’s the big deal? Wait, prepare to be challenged! You need to prove (or disprove) that the square root of 2 (i.e., √2) is a rational number. Oh, I heard you! You say √2 an "imaginary" concept with no practical existence. Smart; you took the challenge to another level! So let’s first see how √2 looks like, and how it’s very real!
Take a square piece of cloth ABCD, each side of which measures 1 m. Now cut it into two pieces along one of its diagonals (say, AC). What you get are two right-angled triangles ABC and A’DC’. Let’s take one of them -- ABC. How much do its sides measure? We know AB = 1 m and BC = 1 m; but AC = ?.

Following Pythagoras’ advice, we could compute AC = √(AB² + BC²) = √(1+1) = √2. Bingo! We have a triangular cloth with one side measuring √2 metres. But you might object! “Why √2? I used a ruler and measured it to be 1.414 m.” Are we in a fix? Not yet. Analytically, we have AC = √2, but on measuring it using a ruler, we get 1.414. One can deduce that the value of √2 is 1.414. That is a smart move because if you could prove that, you would have √2 = 1.414 = 1414/1000, a rational number indeed! Let us see.
So what sorcery is this entity called √2? Simply speaking, it’s the number whose square should be 2. So, we should expect the square of 1.414 to be 2. Alas! It turns out that 1.414² = 1.999396, a little short of 2, isn't it?
Never mind, you procure a better ruler with more precise scale markings and measure the diagonal side of the cloth (AC) to be 1.41421356237 m. But on squaring it, we get 1.41421356237² = 1.9999999999912458800169, again, short of 2.
The fact of the matter is that no matter how precisely you measure the value of √2, it’s inexpressible as a fraction. But how do I convince you of that? You should demand a proof. A proof that √2 is not a rational number.
Let’s see what we could do:
Assume √2 to be a rational number; and let’s give this assumption a name: "The Rational Root Assumption" (TRRA). Now, if TRRA were to be true, we should be able to find two integers p and q such that √2 = p / q. In addition, let us demand p and q to meet a condition: that they have no common factors except 1. Let us call this the “no common factors” condition (NCFC). Now, “√2 = p/q” simply means that p = q√2, or p² = 2q². As soon as you multiply something by 2, the product becomes an even number. So we have 2q² to be an even number, and hence p² is an even number as well. This leads to our first conclusion: that p is an even number (because if it were not, then it would be odd, and if it were odd, then p would be equal to 2k+1 for some integer k, and this would mean (2k+1)² = 4k²+4k+1 = 2(2k²+2k) + 1 would be odd, and so would p² be, which is not possible since we showed p² is even). Let’s call it the “p is an even number” conclusion (PENC). But what does PENC mean? That p could be written as 2m for some suitable integer m. Let’s replace this in the equation p² = 2q². We get (2m)² = 2q², or 4m² = 2q² or q² = 2m². Oh, we have seen this before. This means q² is even, and hence q is even (for reasons made clear above). Let us call this the “q is an even number” conclusion (QENC).
The summary of the foregoing discussion is this: [TRRA and NCFC] implies [PENC and QENC]. In other words, if √2 is a rational number with numerator p and denominator q, and p & q have no common factors, then both p and q are even numbers. Wow, isn't that hard to believe, because how could p and q be even and not have any common factors? If they are even, they would have 2 as a common factor. Now, this is what we call a contradiction! And since the logical flow was flawless, there is only one explanation to the contradiction: the TRRA assumption -- that √2 is rational. Hence, we have proved that √2 is irrational. Period!
Was this discussion easy to follow? Yes.
Was it easy to write? No, because we had used wholesome English words to express the proof.
In fact, proofs are best expressed using shorthand symbols. To illustrate, the following would be a shorter version of the same argument:
To prove √2 ∉ ℚ.
Proof: Assume √2 ∈ ℚ.
⇒ ∃ p, q ∈ ℤ with p⊥q and q ≠ 0 s.t. √2 = p/q.
⇒ p² = 2q² ⇒ p²|2 ⇒ p|2 ------------------> (1)
⇒ m ∈ Z s.t. p = 2m ⇒ (2m)² = 2q² ⇒ q² = 2m² ⇒ q²|2 ⇒ q|2 ------> (2)
Now from (1) and (2) above, we have p|2 and q|2.
⇒ p⊥q is not true. Hence, we have a contradiction.
So, √2 ∉ ℚ. Hence, proved.
So √2, after all, is an irrational number and hence could not be written as a fraction of two integers.
Impossible Probabilities
To find the probability of an event is to measure something. And the prerequisite to make measurement possible is to define what to measure. Imagine what happens if what you want to measure is not well-defined. When asked to compute the conversion ratio of a campaign, your first question is to seek what the definition of a conversion event is. Let us understand the importance of defining concepts explicitly and clearly with the following example from the book on Probability and Statistics by Vijay K. Rohatgi et al, referred to as one of Bertrand’s paradoxes.
Question: A chord is drawn at random in the unit circle. What is the probability that the chord is longer than the side of the equilateral triangle inscribed in the circle?
To understand the question more clearly, consider the circle as follows.

We have a circle (in red) centered at C with radius r = 1. Inscribe into it an equilateral triangle PQR (blue). If we now randomly draw a chord on this circle (call it chord AB), what is the probability that it is longer than the side (say s = PQ = QR = RS) of the triangle PQR?
Do you see any problem in the question formulation? If no, then you might be surprised to know that there are at least three solutions depending on how one defines the concept “a chord at random”.
Solution 1: Every chord on the circle could be uniquely defined by its end-points. Let us fix one of the end-points -- A -- on the circumference of the circle. This also defines a unique inscribed equilateral triangle APQ. The choice of the other end-point (B) dictates the length of the chord AB.
If B lies on the arc between A and P (Case 1 below), we get a chord shorter than the side of the triangle. Similar is the case when B is chosen on the circumference of the circle between A and Q (Case 2 below). But when we choose B to be somewhere on arc PQ (Case 3), we get a longer chord.

Hence, we have the favourable points that could act as B (i.e., in a way that AB is longer) to be points on the circumference between points P and Q (Case 3). Now, since points A, P, and Q divide the circumference of the circle into three equal arcs AP, PQ, and AQ. We have length(arc AP) = length(arc PQ) = length(arc AQ) = 2𝜋/3. Hence, we get the desired probability as length(arc PQ) / circumference = (2𝜋/3) / 2𝜋 = 1/3.
Solution 2: Another way in which the length of a random chord is uniquely determined is by the distance of the chord’s midpoint from the circle’s centre. If we fix a radius OC, we would have an equilateral triangle PQR cutting OC at S. Moreover, length(OS) = length(SC) = length(OC) / 2 = 0.5. Our problem could be solved by picking a point X on OC and drawing a perpendicular line AXB as a chord.

Now, where that X is picked decides how long the chord would be. If X is picked on line SC, we have a shorter chord; and the same done on line OS gives a longer one. So our favourable region to pick X is line OS. In other words, the desired probability would be length(OS) / length(OC) = 0.5 / 1 = 1/2.
In conclusion, we have that the same question has two solutions -- 1/3 and 1/2 -- based on our interpretation of the concept of a “random chord”. If you refer to the book, there is another solution that gives a probability of 1/4. This shows how important the exercise of “defining” a concept could be.
At Factors, we support the philosophy of crunching numbers (rather than intuition) to provide intelligent marketing insights, which are only a click away for you to experience: click here to schedule a demo with us. To read more such articles, visit our blog, follow us on LinkedIn, or read more about us.

Measuring Marketing With Change Science (Part 1)
We all have heard the saying: “Change is the only constant,” which translates to the fact that everything changes, every time. While that is too philosophical, and since marketers – more so data-driven B2B marketers – are not really fans of philosophy, there is a need to “measure” change. And not just that, a business needs to “attribute”, “rank”, “predict”, “explain”, and hopefully even “bring about" change using data analytics. Since statistics is the mother of all real-world measurements, and probability is the grandmother thereof, the science of measuring change too lies somewhere close by.
Since surface (i.e., not deeply thought-out) definitions are easy to make but difficult to follow with real-world data, the real challenges are solved by taking support from the well-researched areas of data science and probability. One extreme is to discuss the topic of change with its extreme roots, but that could easily fill-up a book (which is under way), but we stick to measuring change w.r.t. marketing analytics.
The questions
The main questions from a marketing perspective are: “What main factors changed from last week to this?”, and “By how much did these main factors change?”. But before that, let us understand something even more basic.
Why to measure?
Marketers take various targeting decisions on a daily basis – which audience to target, how frequently, and with what kind of marketing campaigns. They also have to keep track of various prospective customers, their journey, their overall statistics, and most importantly, reasons why a particular technique worked (or didn’t work) – be it a campaign or a strategy. And there are various goals when it comes to marketing. While some techniques could be motivated towards increasing reach (where it’s important to maximize the number of eyeballs a webpage could get), others increase conversions (at various points in a funnel – form-fills, email cold/warm calls, prospects, pre-sales, sales, etc.).
The foregoing marketing goals are achieved by measuring both static marketing performances (i.e., what happened today / this week), and also more dynamic, time-aware ones. While analyzing performance over time is a comprehensive view of marketing goals’ achievements / shortcomings and hence makes it cumbersome to digest multiple metrics of interest in a single frame, summaries of the same are preferred. And one of the summaries of a dynamic measurement of marketing performance comes in the form of change – that is, what changed, by how much, and why. In this article, we would focus on measuring overall changes, and would dig deeper into measuring the causes for the same in a follow-up blog.
What to measure?
Based on the business requirements, marketers focus on tracking and eventually improving relevant KPIs (key performance indicators). For the scope of this article, we would explain change analysis taking the example of one important metric marketers are concerned about – the number of leads they generate every week. They achieve this by driving relevant visitors to their website every week. Any change in the number of leads that they get as compared to what they expected calls for an investigation on the reasons for the difference between expected and actual metrics.
Since the first step into any such investigation is to measure and compare (with last week) some global performance indicators measuring the reasons for change, the same is the focus of the current article. Hence, keeping a webpage in mind, we take the example of measuring the number of visitors (those who reached the website), the number of leads (visitors who reached target), and the conversion rate therefrom (leads per visitor).
When we perform these measurements for two given periods of time (say consecutive weeks), we could compare them. Let V1, L1, and C1 represent the number of visitors, number of leads, and conversion rate of week 1 respectively, and let V2, L2, and C2 represent the same measurements from week 2.
How to measure?
The four simple change measurements one could perform are the following:
- Total change: This is the most basic measurement of interest that preserves both the “unit” and the “sign” of change. For example, if the number of website visitors who filled out a form changed from 50 last week to 75 this week, we get an absolute change value as +25 form-fillers. In short, it answers the question: “How much more/less?”.
More formally though, one could measure absolute change in visitors (𝚫V = V2-V1), leads (𝚫L = L2-L1), and conversion rates (𝚫C = C2-C1). - Relative change: While absolute change remembers the unit of the entity one is measuring, it is – more often than not – more convenient to adopt a normalized change score. Taking the same example as before, change in the number of form fillers from 50 to 75 means a change value of +25, but the same is true if form-fillers had increased from 150 to 175 (viz., +25). What separates the two cases is relative change (i.e., how much did the unit change per unit original), which is +0.5 (=25/50) for the former (50→75), and +0.17 (=25/150) for the latter (150→175). The specialty of this score is that it remains a fraction between -1 and +1, and helps in comparing two “changes”. In a day-to-day language, a “percentage” variant of this metric is used by marketers.
Again, a formal representation of relative change in visitors (𝚫rV = 𝚫V / V1), leads (𝚫rL = 𝚫L / L1), and conversion rates (𝚫rC = 𝚫C / C1) would also help engrave the idea. - Percentage change: As described earlier, it’s easier to understand when one says “the number of visitors saw a 50% increase” (as opposed to saying the relative change of visitors was +0.5). Therefore, as a human-friendly change metric, the percentage variant is more popular than its math-friendly counterpart (relative change).
A notable caveat is as follows. “From X to zero” would mean a “100% decrease” (and vice-versa), but “from zero to X” turns out to be an “infinite% increase”, which is absurd. One workaround to rectify this is to call “from zero to X” as “from min to X”, where min could be set based on the metric of interest (e.g., min could be just 1). Another workaround is to call “from zero to X” as a “100% increase”. Another interesting point is that “no change”, it’s called a “0% change” – even if it is “from zero to zero”.
From the perspective of our current example, percentage change in visitors (𝚫pV = 100 x 𝚫rV), leads (𝚫pL = 100 x 𝚫rL), and conversion rates (𝚫pC = 100 x 𝚫rC) could be computed by simply multiplying the relative change by 100. - Factor change: Some marketers (and sometimes marketers) like to express change in percentage differences, and sometimes in factor increments/decrements (and some do both), and this is purely a personal/company-wide choice. Picking the same example from above, whether it is convenient to say “the visitors increased by 50%” or “this week’s visitors are 1.5x last week’s” differs from use-case to use-case, but is only a different way of expressing relative change.
Although one has to be cautious, however.
- “1x” means no change (a “0% change”). For example 100→100, 1→1, 0→0, etc.
- “0x” means a “100% decrease”, from, say 100 to 0, 5 to 0, but not from 0 to 0 (since we choose to call it a “1x” change.
- “2x” means a “100% increase”.
- “1.5x” means a “50% increase”.
- In general, “kx” means a “100*(k-1)% increase/decrease”, where it’s an increase when k > 1 and a decrease when k < 1.
- When saying “kx”, k never goes negative.
Going by the earlier example of website visitors, we could be interested in the factor change in number of visitors, (𝚫fV = V2 / V1), leads (𝚫fL = L2 / L1), and conversion rates (𝚫fC = C2 / C1).
Measuring overall change
Depending upon the business and the audience, there are multiple combinations of possibilities. We only cover some of them, summarizing overall (global) change. And as mentioned earlier, our next article on this topic would dive deeper into digging up the “reasons that drive this overall change.”
No change
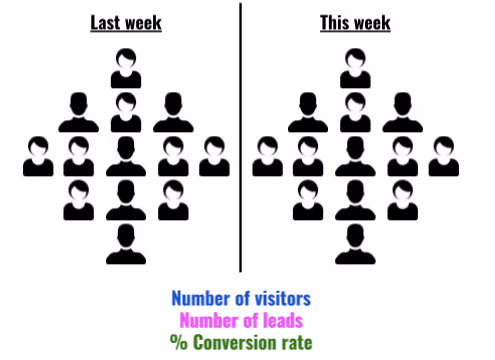
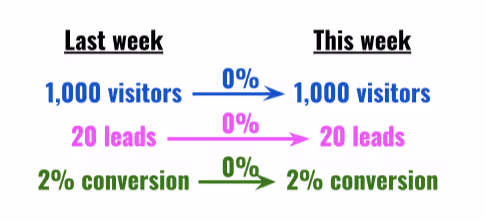
Let us start with a simple world, and slowly drift towards complex scenarios. Suppose our website had 1,000 unique visitors last week, and 1,000 new unique visitors this week (i.e., there was no change in the number of visitors). Of the 1,000 users last week, 20 signed-up for our newsletter, and the same trend continued this week as well. In other words, both last week’s and this week’s conversion rate was 2% (20*100/1,000). What does this tell us about this week’s performance over last? That it remained the same! In other words, there was a 0% increase/decrease in both reach and lead conversion rate.
Proportionate increase in visitors & leads
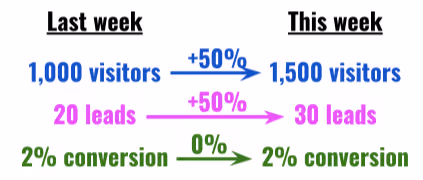
Now, if we had more visitors (say 1,500) this week as compared to the last, with a proportionate increase in leads so as to maintain the 2% conversion rate, it would amount to a 50% increase in visitors and leads, but a 0% change in conversion rate.
Increased leads, retained visitor count
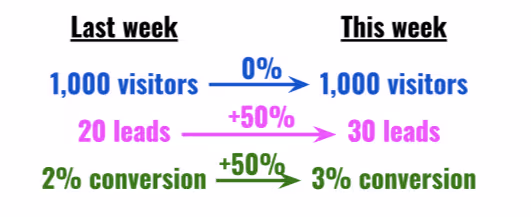
On the other hand, if the total number of visitors had remained the same, and leads would have increased by 50%, this would increase the conversion rate by 50%.
Increased visitors, no change in leads
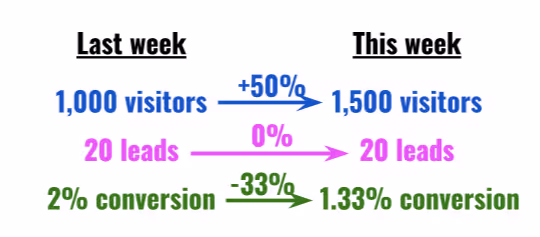
If, however, the number of leads would have remained the same despite an increase in visitors (by, say, 50%), we would see a 33% fall in conversion rate.
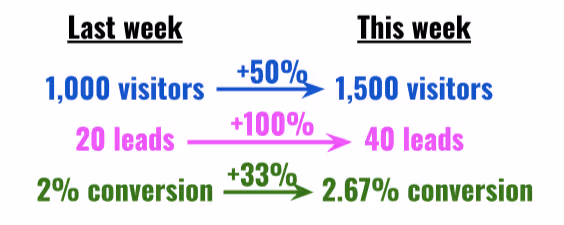
Disproportionate increase in visitors & leads
It is also possible that the number of leads increased by a disproportionate amount, which led to an increase in conversion rate.
Measuring change factors
We just discussed how measuring overall change is straightforward: simply report the signed/relative/percentage difference or factor change in visits, leads, and conversion ratio between the two weeks. But this is only half battle won. What is ideal is to measure the “causes” for the change. For example, we know that a 2x increase in visitors (V2 = 2V1) and 1.5x increase in leads (L2 = 1.5L1) – and hence a 25% drop in conversion rate (C2 = L2/V2 = 0.75L1/V1 = 0.75C1) – happened. But why it happened is one of the most important questions change science has to answer.
What causes change?
A seasoned marketer can quickly understand the main factors that led to a drop or a rise in scale (#visitors) or conversion (leads/visitor). But where data analysis comes in is in short-listing such factors from the rest, and hence help the marketer with her weekly (or periodic) decisions. In this article we only give an intuitive idea of what causes change (and how we measure it). In part 2 of this series on Change Science, we discuss the exact procedures and methods to measure factors that cause change periodically.
The more we know about our customers, the more our analysis benefits. While measuring change, as it was mentioned above, we usually track the number of visitors (V), the number of leads (L), and the respective conversion ratio (C). Along with mere counts, one ought to measure the profiles of such visitors and leads – in both weeks. For example, with a 2x and 1.5x raises in visitors and leads, to know what caused it, one has to track how the properties of visitors and leads have changed. The properties we are referring to are usual user/event based properties – from simple demographic ones such as Location (country, city, etc.), User Agent (browser, OS, etc.), etc. to marketing-oriented ones such as Referrer (domain, campaign, etc.) – along with their values (a “property=value” combination looks like “country=India”, for example). In summary, in addition to tracking overall statistics (visitor and lead counts), we also track counts “grouped-by” their properties.
Needless to mention, such properties are too many to count, and property=value combinations are even more. This is where Factors.AI comes in. We track-down each factor, measure the change attributed to the factor, and surface top insights. And we repeat the process for any event pair combination (in say, a funnel), for every property, and for every consecutive period of interest. We urge you to follow-up with us in the next article that describes how exactly we surface the main change factors via our very own Weekly Insights feature.
Stay tuned.

Bizible vs. HockeyStack: Which Tool Is Right for You
In the B2B industry, it's difficult to measure the impact of GTM efforts or attribute specific marketing touchpoints to revenue. This challenge arises because the B2B sales cycle involves several non-linear customer touchpoints over lengthy periods of time.
Several marketing attribution tools are available to help businesses solve this problem. However, with so many alternatives in the market, picking the right one can be overwhelming and time-consuming.
This article evaluates two of the most popular B2B marketing attribution tools. Bizible and HockeyStack.
We'll compare both tools' features, pricing, and other essential factors to help you decide which tool is the best fit for your business.
TL;DR:
- Bizible is now Marketo Measure - Adobe’s marketing attribution solution.
- Bizible does better than HockeyStack in terms of - Multi-touch attribution, Customer support, and tracking multiple channels.
- The implementation of Bizible could take up to 3 months.
- HockeyStack is better than Bizible in terms of - Intuitive dashboards, Third-party integrations, Funnels, Surveys & Impression Tracking.
- HockeyStack provides extra features like Funnels, Surveys, and LinkedIn impressions.
Table of Contents
- About Bizible
- About HockeyStack
- Bizible vs. HockeyStack: Common Features
- What Bizible does better
- What HockeyStack does better
- Bizible vs. HockeyStack: Pricing
- How to choose the right tool for your business
About Bizible [Now Marketo Measure]
Bizible is a marketing attribution and revenue planning platform for B2B marketers. It helps businesses understand the impact of their marketing efforts on revenue by providing insights into which channels, campaigns, and tactics drive the most income and ROI.
Bizible was acquired by Marketo, which itself was acquired by Adobe in the same year (2018). The tool is now rebranded to Adobe Marketo Measure.
About HockeyStack
HockeyStack is an analytics platform that tracks and analyzes user behavior across websites and mobile apps. It unifies all relevant data in one place, helping companies understand how different factors influence engagement and revenue generation.
HockeyStack offers many features, including event tracking, funnel analysis, and cohort analysis. It also includes a customizable dashboard to visualize and understand data in real-time.
Bizible vs. HockeyStack: Common Features
Since both Bizible and HockeyStack are attribution tools, they're bound to have some similarities.
Here we'll discuss the common features of each and explore how businesses can benefit from them.
Content Analytics
Content is king. Whether you have a blog, service page, or ad, content is key to driving brand awareness and conversions. Therefore, it is important to know how content is performing and how it affects the performance of marketing strategies.
Both tools provide valuable insights into the effectiveness of their content strategies. What distinguishes HockeyStack from Bizible is its ability to track and understand the traffic source’s MRR.
Otherwise, the common use cases are as follows:
- Identify the traffic to each content piece.
- Evaluate the engagement rate, CTR, and conversion rate of each content.
- Calculate the time spent on each web page.
- Pinpoint the influential content driving more prospects and conversions.
Suggested read: Measuring the ROI of your B2B Content
Customer Journey Mapping
Customer journey mapping is a crucial element when it comes to marketing, and both tools provide this feature.
Bizible’s robust multi-touch attribution models help pinpoint all key touchpoints and can aid in mapping the customer journey. Similarly, HockeyStack’s attribution and account-level journey features visualize all pre- and post-conversion journeys with all relevant touchpoints.
Custom Reporting
Users can create and access their reports using inbuilt templates in both tools. They also enable users to customize reports based on their needs.
How is it helpful?
A custom report can be modified to provide detailed insights into various marketing performance metrics, such as website traffic, conversion rate, and ROI. These metrics help understand which marketing efforts are working and which are not.
Conversion Tracking
Both tools can track and measure valuable user interactions such as page views, form submissions, newsletter subscriptions, and button clicks.
It is important to track conversion as it provides insights into what's working and what's not. This further helps businesses make data-driven decisions to improve their marketing campaigns.
Both tools allow marketers to track and measure conversion rates across channels and touchpoints. It further helps with the following:
- Identify high-performing channels that drive more conversion and revenue.
- Understand what prompts the customer to convert by tracking conversion at each customer journey stage.
- Identify campaigns and channels that don't perform well and optimize them.
- Associate revenue data with corresponding campaigns to prove ROI.
What Bizible Does Better
Multi-touch Attribution
Bizible is one of the best tools for multi-touch attribution and provides insights into online and offline touchpoints.
It provides users with various attribution models and is customizable to meet specific goals. It also can run multiple attribution models in parallel, which is absent in HockeyStack.

Though revenue attribution is one of the key features of HockeyStack, some users have found it complex to use. Therefore, Bizible remains the best choice in terms of multi-touch attribution.

Tracking Multiple Marketing Channels
Bizible is an excellent option for companies that use various marketing channels to attract potential customers. However, while HockeyStack can help track user interaction with social media platforms, they still need to catch up on offline touchpoints.
With Bizible, companies can pinpoint the channels that are driving qualified traffic. Then, by allocating marketing budgets and optimizing channel performance, companies can increase the likelihood of sales.

Customer Support
Both Bizible and HockeyStack provide good customer support. However, based on G2 and Capterra reviews, Bizible seems to have the upper hand.

Bizible’s customer support team works closely with customers to assist and solve any problems they experience with the software. They even attend to generic requests quickly.

What HockeyStack Ds Better
Intuitive Dashboards
HockeyStack provides a simple and customizable dashboard that allows users to identify critical data about website visitors on one screen.

Though Bizible claims to provide dashboards that are intuitive, reviews say otherwise.

Integrations
Integrations are crucial as they help collect and analyze data from different sources in a centralized platform. As a result, these integrations help businesses understand their marketing performance better and make data-driven decisions to optimize them.
Though both tools provide integrations, HockeyStack has more integration capabilities than Bizible. Moreover, according to the HockeyStack website, they provide custom integration. This means that if a user can't find a necessary integration, the HockeyStack team will build one for them.


Implementation
HockeyStack provides faster onboarding than Bizible. With HockeyStack, companies need to add just one code to their website. In contrast, the implementation process in Bizible can take up to 3 months and would require extensive IT support services, which Bizible does not provide.

Funnels, Surveys & Impression Tracking
HockeyStack offers some additional features that Bizible doesn't provide.
Funnels
This is one of the most valuable features of HockeyStack. It is a powerful analytical feature that helps users visualize the various stages of the sales cycle using graphics. Users can configure these stages to track how website visitors move from the home page to the pricing page, to a blog, and to schedule a demo.
Surveys
This allows users to create their own surveys for self-attribution and to understand the NPS score. Using these survey responses, a business can identify which channels influence the pipeline - from their users.

LinkedIn Impression Tracking
Linkedin Impression Tracking allows users to identify the companies that view their LinkedIn campaigns.
Bizible vs HockeyStack: Pricing
Bizible Pricing
Bizible (Marketo Measure) doesn't provide transparent pricing information on its website. Contact its sales team for more details.
Also, Bizible customer reviews often indicate that the pricing is higher than other tools.

Free Trial - Not available
Free Version - Not available
HockeyStack Pricing
HockeyStack also doesn't have pricing information on their website. According to their website, plans start from $949 per month.

Free Trial - Available
Free Version - Not available
How to Choose the Right Attribution Tool for Your Business
Choose a scalable tool that can be customized to address your business's unique needs and challenges. The scalability feature ensures that the tool will remain relevant even as the business scales and grows.
Apart from scalability and customization following are a few other points to consider before selecting a tool.
- Identify and understand the business requirements; this will help choose a tool that provides the insights you need.
- Marketing analytics tools are costly in general. So, ensure the tool solves your essential features and falls within your budget.
- Ensure the tool you choose enables third-party integrations with CRM, Ad platforms, etc.
- Select the tool that provides an intuitive UI.
- Make sure that the tool offers adequate customer support.
Still On The Fence About What B2B Attribution Tool To Go With?

If you feel Bizible nor HockeyStack is the right fit for your business, then why not consider Factors?
The tool is purpose-built for B2B SaaS marketers and has the best following features:
- Easy no-code implementation
- Effective touchpoint tracking [Online & Offline]
- Accurate path analysis
- Multi-Touch Attribution
- Website visitor identification
- ABM analytics
- Customizable reports, events, and dashboards
- Custom funnel analysis with selected KPIs
- Dedicated customer success management
And more, read about each Factors’ features


Our users love us, you can read more wonderful reviews on G2 and on Capterra.
Factors Pricing

Free Trial - Available
Free Version - Available
Factors provide various pricing plans, including customizable options. The pricing is as follows:
- Starter - $399 per month
- Growth - $779 per month
Contact the Factors team to learn more about the Custom and Agency plan.

