

Content Reporting: Tips and Best Practices to Create the Right Dashboards
Content managers spend the bulk of their time drawing up content briefs, editing email newsletters, and collaborating with marketing teams to ensure they set the right tone. Detailed content reporting on key metrics is essential for content managers to iterate and curate effectively going forward. This blog highlights the importance of content reporting as well as a few best practices to create relevant content dashboards.
What is content reporting?
Content marketers use content reporting to analyze the performance of their assets across website, organic channels, social media, syndication and more.
Modern content reporting eliminates the need for manual analysis. Instead of juggling between several unintuitive tools, marketers can use a unified, interactive dashboard to reflect holistic information about content performance.
This has the benefit of centralizing all your reporting and getting relevant insights to you in real-time. Metrics that content marketers keep track of to optimize their content performance include clickthrough rate (CTR), bounce rate, time on page, and website traffic through the identification of unique visitors.

Why is content reporting important?
It’s imperative for your content marketing team to create high-value content for your target audience. In order to do this, you have to understand how your target audience is responding to the content you’ve already put out. Once you figure out how different content resonates with different personas, you can create more content that is relevant to their journey at each stage of the funnel. Ultimately, this improves the customer experience and drives more conversions.
In a nutshell, content reporting helps marketers:
1. Understand which content performs well
Content makes up a significant proportion of any B2B company’s expenses. It’s important that you get the best results from the time and money your company puts into its marketing efforts. Dedicated content reporting based on metrics such as engagement (including time spent, scroll depth, bounce rate, and pageviews) or conversions (such as influenced demos and pipeline) gives you a keen idea of the type of content your target audience is looking for.
2. Measure the impact of content across the sales funnel
Marketing teams are increasingly being asked to tie their efforts back to pipeline and revenue. With comprehensive content analytics and reporting in place, marketers can connect the dots between distribution channels, assets, and bottom-line metrics.
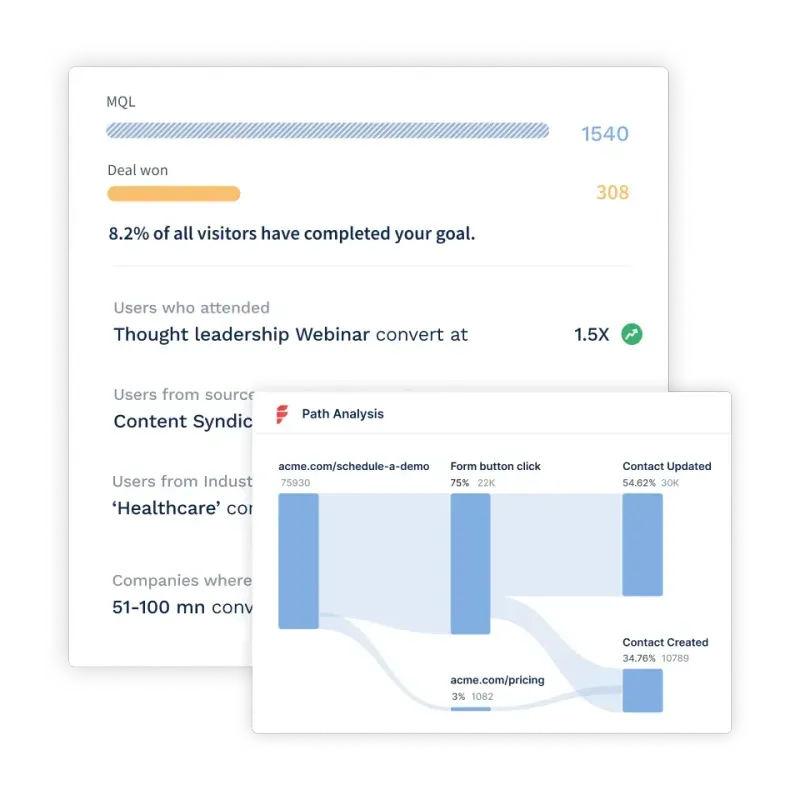
With path analysis and account journey mapping, marketers can pin-point how prospects are interacting with blogs, case-studies, white papers, etc before turning into MQLs, SQLs, and pipeline. With multi-touch attribution, marketers can determine which assets initially bring in top-of-the-funnel leads and which assets help influence the final conversion to paying customers.
Content analysis and reporting at this level helps prove content marketing’s impact on high level business objectives and improves content strategy by shedding light onto what works and what doesn't.
3. Streamline content production, distribution, and repurposing
Content reporting allows you to see what content provides value to your prospects when they’re at the bottom, middle, or top of the funnel respectively. You’ll therefore be able to streamline content production and offer prospects and clients content that’s relevant to them.
Your target audience’s needs are constantly evolving, though–which means your content also has to do the same. Dedicated content reporting will help you assess whether certain channels or posts are underperforming with respect to crucial content metrics. This information helps you know when you need to refresh your content. You can also see which content is performing well, so you can repurpose it for further use.
4. Optimize the process and minimize overheads
When you know which channels and content help to bring the most leads and conversions, you eliminate any shots in the dark about the conversion process.
You’ll be able to make more educated guesses about which marketing channels to invest in based on past trends. This allows you to cut down on marketing expenditure that doesn’t bring in results, and focus your energies towards high-value content creation and distribution on channels that will resonate with your target audience.
5. Understand what type of audience engages with each content piece
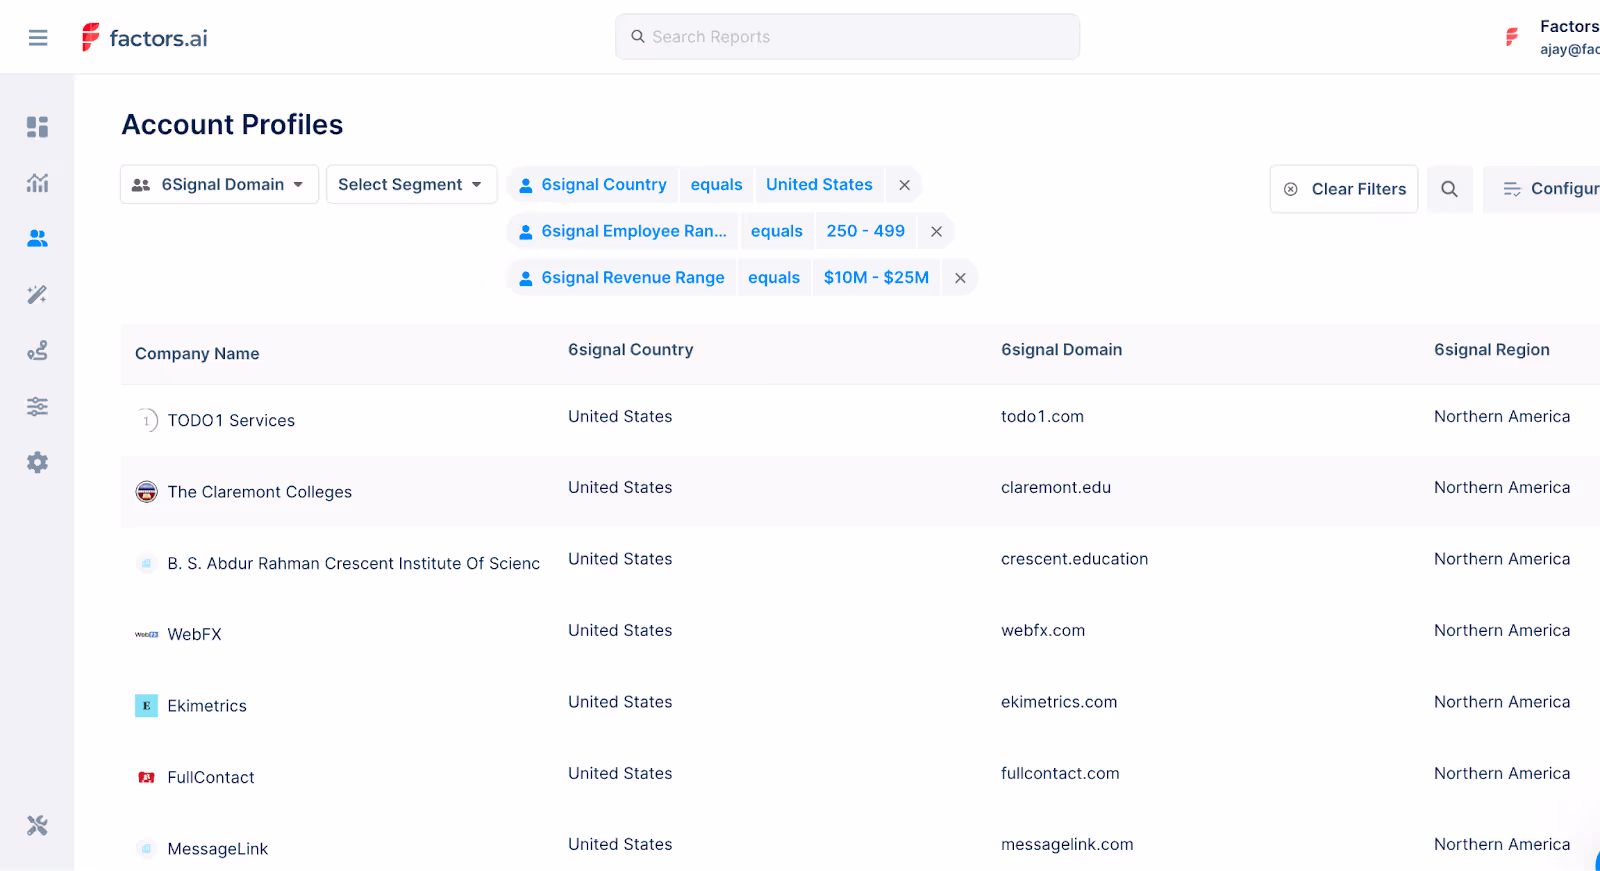
Content marketing teams often produce loads of ungated assets without actually knowing who the final consumer of their content is. Visitor identification tools like Factors.ai help identify anonymous accounts visiting the website — along with firmographics such as the visitor’s industry, employee headcount, and revenue range.
This provides unprecedented visibility for content marketers to gauge who their audience really is and what types of content appeal most to them. For example, maybe visitors from enterprise-level companies prefer content around security and privacy compliance. Early-stage start ups, on the other hand, may find content around pricing more relevant.
Visitor identification helps content marketers tailor assets towards their ideal audience and promote relevant content going forward.This, in turn, helps improve the odds of conversion along the customer journey.
What should you include in a content report?
Some metrics are more valuable than others when it comes to content reporting. Most free tools such as Google Analytics only provide the bare minimum to track content performance. This includes clicks, impressions, social-shares, and bounce rates. No doubt, these are useful metrics — but only when used in conjunction with other, granular KPIs, filters, and breakdowns.
For example, aggregate bounce rate on Google analytics is a metric that measures the number of visitors who drop off from a website after visiting a single page. In B2B, this is a remarkably ineffective metric unless broken down by B2B segment such as industry, revenue range and so on. Only then can marketers compare variations in bounce rates to discern how different assets influence different sets of audiences.
Your content team should employ tools that are able to measure metrics that industry experts recommend keeping track of for detailed content analysis. This includes:
- Scroll depth: The scroll depth is an engagement metric that encapsulates how deep a user scrolls down your landing page or blog content. Typically, a scroll depth of 50% or more means that your content is resonating with visitors.
- Conversion rate: The conversion rate represents the number of users who converted as a ratio of the total visitors to your website. If your product interests prospects, or your content addresses website visitors’ pain points, they are more likely to convert. Another version of this is the Marketing Qualified Lead (MQL) to Sales Qualified Lead (SQL) conversion rate.
- Impressions: Your impressions indicate how much engagement your content generates. This content could be anything: an article, a blog, or one of your web pages. The impressions metric helps you understand the performance of your social media and search engine marketing campaigns.
- Time on page: Like the scroll depth, the time a prospect spends on a web page or blog post indicates their interest in your service.
- Unique users: The number of visitors to your website can be challenging to calculate, since it’s essential that each unique visitor be counted only once, regardless of how often they visit your website.

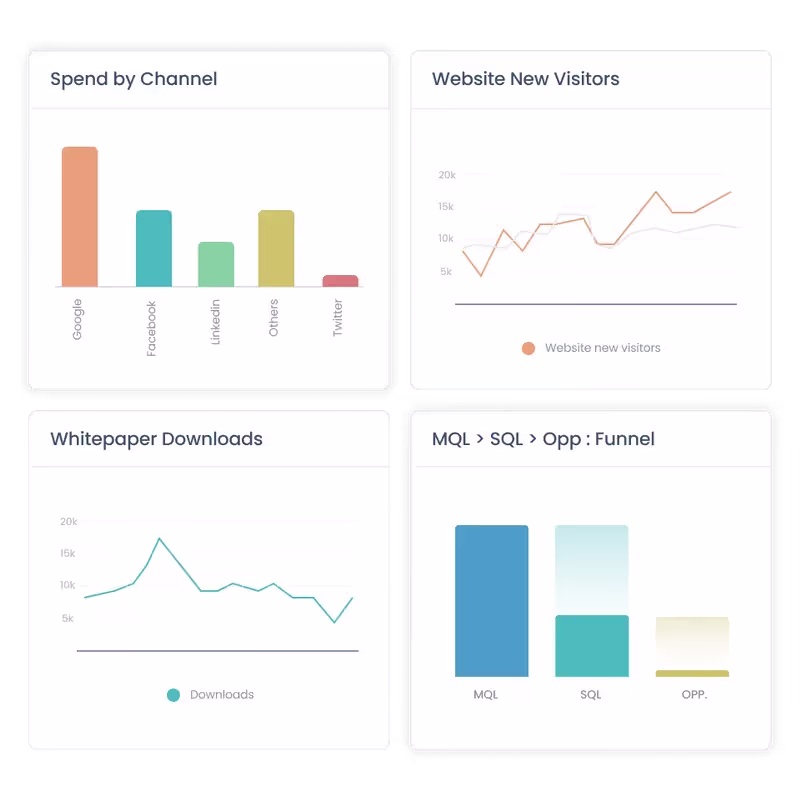
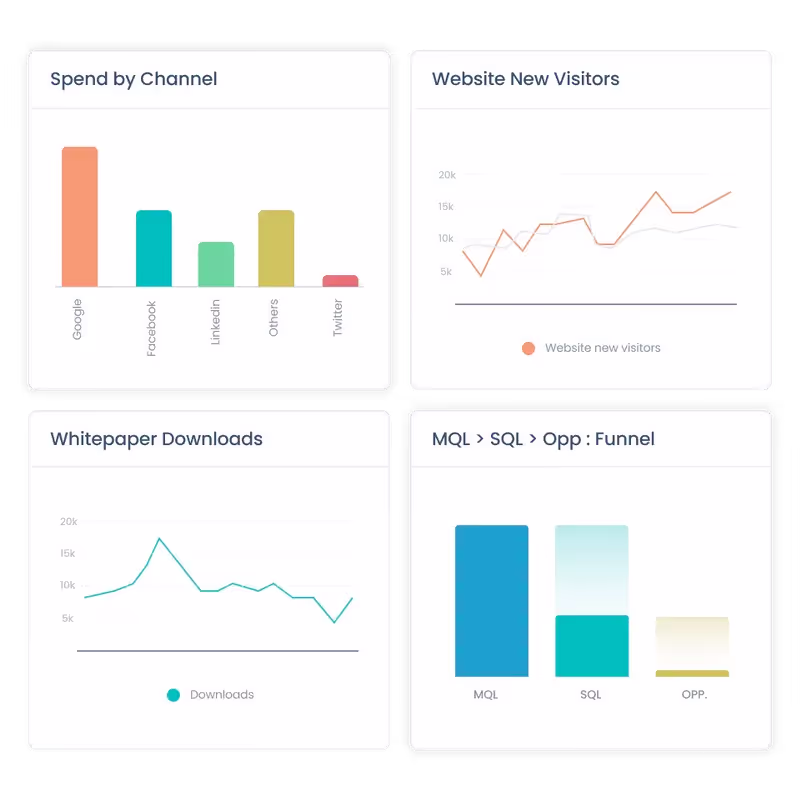
Your content reports also need detailed but easily understandable visualizations that allow you to make beneficial decisions at a glance. A content marketing dashboard should immediately help you grasp how key metrics are changing to drive efficient decision-making related to content and attribution.
Best practices to create effective content dashboards
Your content dashboard should show you everything you need to create an effective content strategy on the same page. Here’s how your marketing team can ensure it has the best possible content dashboard:
1. Understand the metrics you’re using
How is each metric connected to your strategic goals or overall revenue? Asking this question helps to streamline the information on your dashboard so it only shows you relevant metrics. Your marketing team needs to understand how each metric displayed corresponds to the company’s goals to effectively adapt the marketing strategy accordingly.
2. Set the right goals
Not all your goals have to be connected to revenue–some of them can be associated with your company’s strategic goals, such as acquiring prospects in a certain industry sector or locality. Metrics such as the influenced pipeline, for example, are not associated with revenue but with the success of your marketing efforts. Tracking the right metrics while keeping company goals in mind allow you to focus on growth.
3. Make data easy to consume
While deciding which metrics to include in your visualizations, ask yourself the following questions:
- Who/what is this visualization for?
- Does a specific metric help you make quicker and better marketing decisions? If the answer is yes, include it.
- Which visualizations are easiest to understand for each metric?
- How can each piece of data be connected to your company’s overall revenue?
4. Include comparison data
Comparison data is crucial for keeping track of progress. A dashboard incorporating comparison data will often employ graphs and charts that display how certain metrics have changed over selected quarters, for instance. This data helps you see how much closer you are to achieving company goals than before.
5. Don’t forget about influenced pipeline
Measuring how marketing has influenced pipeline helps you see what marketing content influences a lead’s decisions and how. Essentially, the influenced pipeline shows you the real impact of your marketing efforts, and informs you about the channels that most contribute to conversions. It helps you understand the buyer’s journey in greater detail.
Are there any tools to help with content reporting?
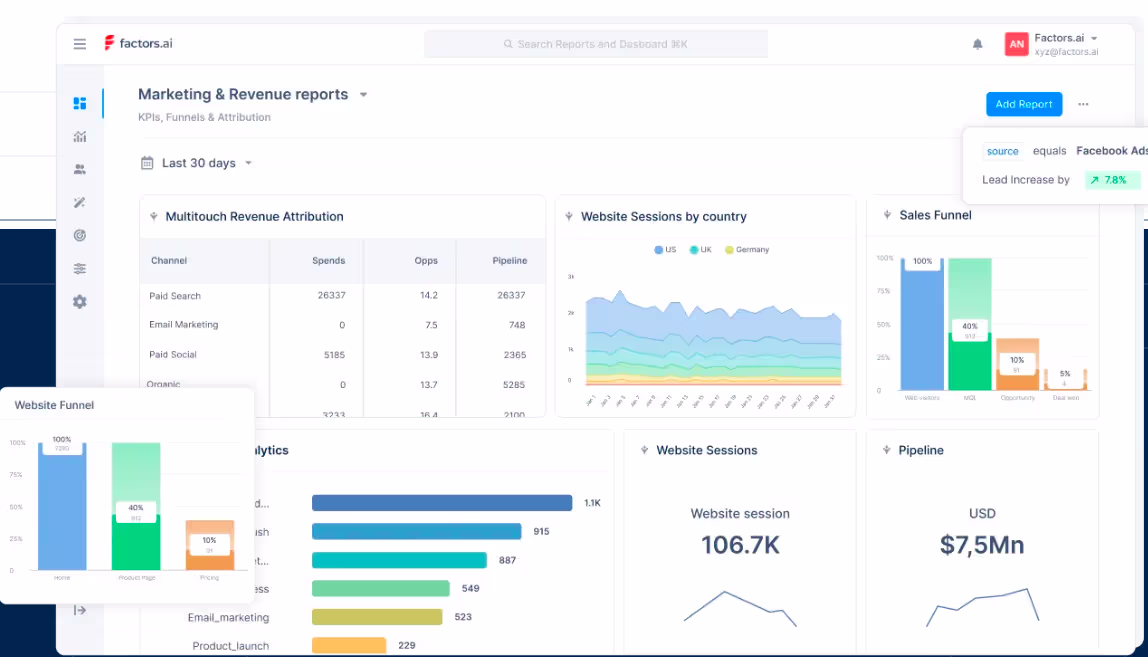
Tools like Factors offer analytics and multi-touch attribution dashboards, along with dedicated content reporting. You’ll be able to see all of your important metrics in one place, along with detailed, comprehensive visualizations that allow you to easily understand your company’s marketing strategy performance at a glance.

Factors’ attribution features also help combine all this information with your customer relationship management (CRM) software entries. This allows you to have a holistic understanding of each buyer’s journey, complete with the touch points that encouraged conversion and the content they found most useful.
Conclusion
Effective content reporting is a critical aspect of developing and adapting your content marketing strategy to current trends in the market. Book a demo with us today to find out how Factors can help your company with effective analytics, attribution, and reporting.
FAQs
1. What does a good content report look like?
A good content report includes key metrics for content marketing and visualizations that allow you to make quick and important marketing decisions on a single dashboard. Visualizations involving comparison data are also important, as they help you understand progress in performance.
2. What’s in a content report?
A content report displays changes in engagement and conversion metrics, and detailed analyses of how different types of content are performing across the various marketing channels your company employs. It should connect each metric to specific company goals, and also include easily understandable visualizations for quick decision-making.

6 Tips to Align your Sales and Marketing Teams
Sales and marketing are like twins that don’t get along. Teams often confuse the two because they work along similar lines. In fact, both teams are often given a shared budget to divide amongst themselves.
In a study conducted by Harvard Business Review, when sales and marketing teams were asked to describe each, the two had nothing but negative comments. “Paper pusher” and “irrelevant” were the top terms used to describe the marketing team. On the other hand, some words that the marketing team used to describe the sales team included “incompetent” and “simple-minded” (Source).
Of course, this rift between sales and marketing has existed since the beginning of, well, sales and marketing.
But what if…what if…both sales and marketing could join forces to work together?
What can sales and marketing teams achieve when tightly aligned?
Well, organizations that have their sales and marketing teams on the same page enjoy the following:
- 36% higher customer retention rates
- 38% higher win rates (Source)
- 67% improvement in deal closures
- 209% more revenue from marketing (Source)
- 20% annual growth rate (Source)
- Save 30% Customer Acquisition Costs (Source)
Then the next question is—How can you get your sales and marketing teams on the same page? Here are a few tips that will help!
6 strategies to align sales and marketing
1. Align Goals to ROI
Sales and marketing teams have different ways of looking at their goals. While sales teams have monthly, quarterly, and annual deadlines, this concept is foreign to the marketing team that has never been linked to revenue performance.
Since both teams work in different styles, confining either one to follow the other process will result in unnecessary friction.
But the one thing that doesn’t change is their goals.
In the end, both their goals should be improving ROI. Taking the focus away from the journey and putting it on the result can even both the teams’ paces and unite them.
2. Employ Lead Qualification
Another area where both teams find themselves at odds is when a successful campaign from the marketing team does not translate into higher conversions for the sales team.
The culprit behind this is lead quality.
If the leads being generated are not interested in buying the company’s product, no matter how many prospects flow into your sales funnel, the end conversion rate will be the same.
One way to improve lead quality is by qualifying them.
Apart from this, lead qualification offers three other benefits: it help the marketing team understand whom they’re supposed to target, get both teams on the same page, and reduce the sales team’s efforts.
Then, how does one employ lead qualification?
One way to qualify a lead is to get both teams to sit together and build an ideal customer profile (ICP). An ICP is basically a customer profile of the business’s ideal buyers. It answers questions like how much they would be willing to spend, where they are more likely to live, what communication channels they are more likely to use, and what they are looking for.
The next step involves setting up a presales team that sorts the leads into invalid, uninterested, partly interested, and interested, before sending the leads forward. The invalid and uninterested leads get discarded.
The marketing team’s goal is to reduce the number of invalids and uninterested leads, whereas the sales team’s job is to convert the remaining two categories into clients.
These two steps can result in smoother operations between sales and marketing.
3. Use a CRM
Lack of communication is the biggest reason for disconnected sales and marketing teams. Since sales and marketing teams are usually swamped with their own work, it can get tricky to find time to interact with each other.
A Customer Relationship Management Software solves this problem by centralizing information. This allows different teams to access resources and monitor each other’s activities, keeping everyone on the same page.
CRMs also help nurture leads, track journeys, decrease duplication of efforts, provide deeper insights and analytics about customers, and score leads, all of which allow better decision-making and harmony between teams.
And if that isn’t enough, the software also provides sales and marketing automation, speeding up the groups’ efforts and saving them time.
4. Invest in Sales Enablement
Sales enablement is one of the most common methods companies employ to align their sales and marketing teams. How it helps companies is by:
1. Encouraging marketers and sales reps to interact
The marketing team needs to notify the sales team whenever they update new content. This forces them to reach out and interact with the sales reps. Similarly, sales reps must provide feedback on how the content helps them and what improvements can be made, thus, improving communication between the two.
2. Giving marketers and sellers an idea of what content resonates with customers the most
Once marketers create new content, they understand which content the sales team uses more and which is used less, thus helping them make better content to enable the reps.
Sales reps can also understand the type of prospects they are interacting with through the marketing team’s enablement content. This allows them to change their pitch according to the customer segment they are dealing with, which results in more closures.
3. Ensuring that the content remains on brand
When sellers have difficulty finding the right content, they might modify the material they already have to suit their sales purposes. This saves them time, but it might not necessarily be brand compliant.
Sales enablement allows representatives to modify materials on the fly using only pre-approved content. Furthermore, it gives marketers access to each modification made by each seller. This allows the marketing team to analyze what sellers are looking for in the material and which ones they are finding difficulty in navigating. This will be really beneficial for future asset optimization and improvement.
5. Attend Each Other’s Meetings
For companies that haven’t yet employed a CRM or an update tracking software, the best way for sales and marketers to keep tabs on each other’s updates is by actually attending their meetings.
Or better still, holding a dedicated joint meeting weekly or monthly can bring both teams on the same page. This ensures everyone is on the same page regarding that quarter's goals, tactics, expectations, strategies, and performance progress.
Here are some tips for holding a fruitful sales and marketing meeting
1. Set a proper agenda
Collect the agendas to be discussed beforehand and allot specific times for them to ensure all the topics are discussed. Remember to keep buffer time in case the topics drag on and the time taken to finalize a decision on that agenda.
2. Keep changing the themes
One way to avoid having complicated agendas with broad topics is by grouping them under different themes. Keeping one theme per weekly meeting can simplify the agenda and burden both teams less.
Some popular sales and marketing themes include:
- Strategies Discussion – Held to discuss the strategies that have been working and the strategies that need to be changed or dropped.
- Performance Reviews – How the teams’ efforts contribute to achieving goals and how much they have progressed.
- Buyer Behaviour – Held to discuss any changes and improvements that can be made regarding buyer engagement or to discuss the results of an already published campaign.
- CCC review – Held to review and discuss marketing and sales content, campaigns to be published or made, and any notable moves competitors have made.
And since there is a theme for each meeting, all members of both teams need not have to attend. Instead, they can look at the meeting minutes later, saving them time to do other work.
3. Share the agenda beforehand and assign representatives to speak
The last way to ensure fruitful meetings is to share the topics to be discussed beforehand. This gives both teams time to prepare in advance. Furthermore, assigning representatives saves time for reps and marketers who must sit through the entire length of the meeting to discuss minute topics.
6. Talk out the discrepancies
It’s common to have disagreements between sales reps and marketers over different issues. However, while they might seem trivial, these conflicts must be dealt with utmost care to not give the illusion that one team is favored over the other.
Another common issue is that both teams might not say out loud whether they agree or not with each other for the fear of retaliation or confrontation.
One solution to these problems is encouraging both teams to provide constructive criticism. Sales and marketing employees can be taught how to provide feedback without sounding rude.
And to ensure that the feedback is formalized and the interactions stay respectful, it can be organized on dedicated venues like forums or a weekly critics session.
The final step is to rinse and repeat these 6 steps. But remember, like all other strategies, they will soon become obsolete and ineffective if your business doesn’t regularly revisit and update them.
Ultimately, aligning both sales and marketing teams is always important, no matter how big or small a business is. While these are very effective strategies, each company knows its employees the best and, thus, should also consider additional custom methods apart from these as well.

The Complete Guide to Building A SaaS CMO Dashboard
Tracking campaign performance across marketing channels can be a tedious and unintuitive process. CMOs often have to rely on individual department reports to gather a summary of how the team is performing – an endeavor that leaves many gaps and relies heavily on guesswork.
In addition to the time it takes to compile reports, derive actionable insights, and chart next-steps, the traditional way of doing things is prone to several manual errors.
The solution? The perfect CMO dashboard that helps streamline your work based on relevant analytics and metrics under one roof.
This article shows how powerful CMO dashboards can be used to drive data-driven business decisions.
TL;DR
- CMO dashboards offer a holistic view of customer data-related metrics and KPIs through intuitive visualizations.
- The benefits of SaaS companies using CMO dashboards include rapid decision-making, sensible use of time and resources, improved ROI, and unified visibility of marketing performance.
- Before you build a comprehensive CMO dashboard, pay close attention to user-friendly design, use helpful visualizations, integrate platforms to consolidate data, and measure the right metrics/KPIs.
- SaaS businesses must track metrics/KPIs such as conversions, leads, traffic, conversion rates, acquisition cost per channel, retention and churn rates, customer lifetime value, and revenue and pipeline velocity by channel source. A CMO dashboard helps visualize these metrics and KPIs with clarity.
What is a CMO dashboard?
A CMO dashboard is a tool that reports and visualizes KPIs and metrics related to a company's marketing activities across demand gen, content, paid, events, and more. It is a centralized, bird’s eye view that helps marketing executives monitor and analyze marketing initiatives and performance in real-time.
There is no hard and fast rule to building a CMO dashboard for your SaaS company. That being said, there are certain elements that are essential for marketing leaders to identify patterns, track progression, and optimize strategies to drive bottom-line business objectives.
We’ll explore these essential ingredients in later sections of this blog.
Why do CMOs need to use dashboards?
Here’s a look at the top benefits of using a well-designed CMO dashboard:
1. Improves decision-making
When making expensive business decisions, relying on guesswork can cost you heavily. CMO dashboards help marketing leaders make well-informed and accelerated decisions based on data-driven insights.
For example, a CMO dashboard can help you identify which channels and marketing campaigns are not performing if you're making budget-related decisions. It also enables you to identify the reason behind poor campaign performance and the following steps to be taken.
Let's say you have the company blog, paid advertising, and podcasts as key marketing channels. A deep dive into the dashboard will help you uncover how much revenue each channel can generate, the cost of leads from each touchpoint, and how long it typically takes them to convert.
2. Offers a quick overview of data without wasting time and resources
A CMO dashboard lets you save hours of work and wasted resources on collecting and processing raw data from scratch.
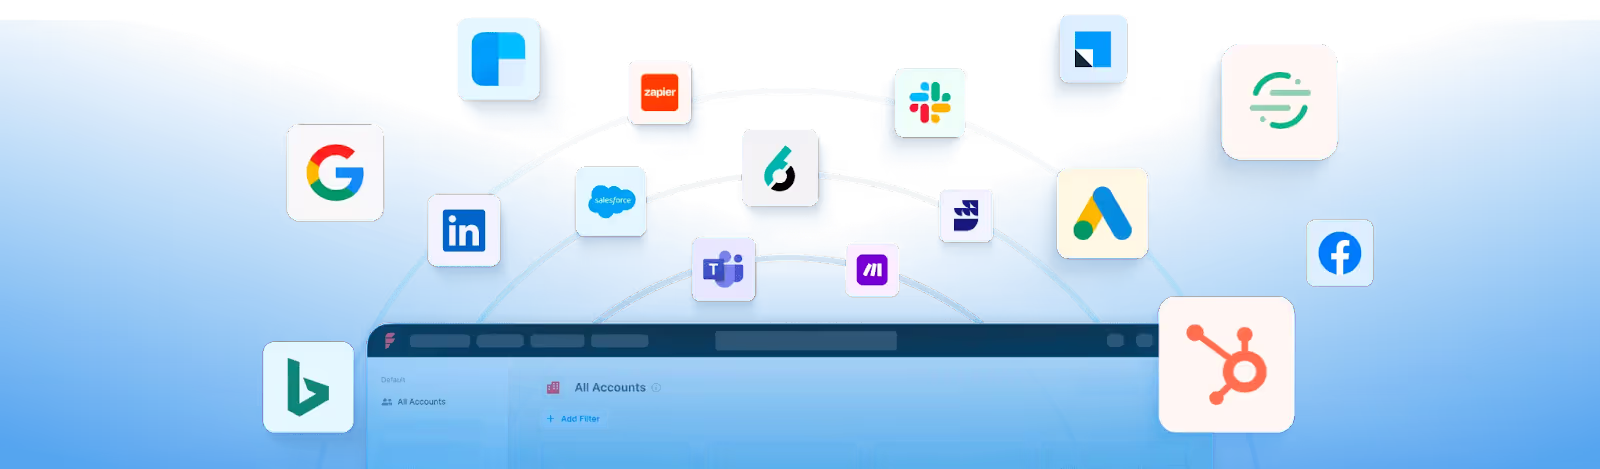
CMO dashboards extract and present an accurate overview of essential data from platforms or sources such as LinkedIn, Facebook, YouTube, articles, Google Ads, and more.
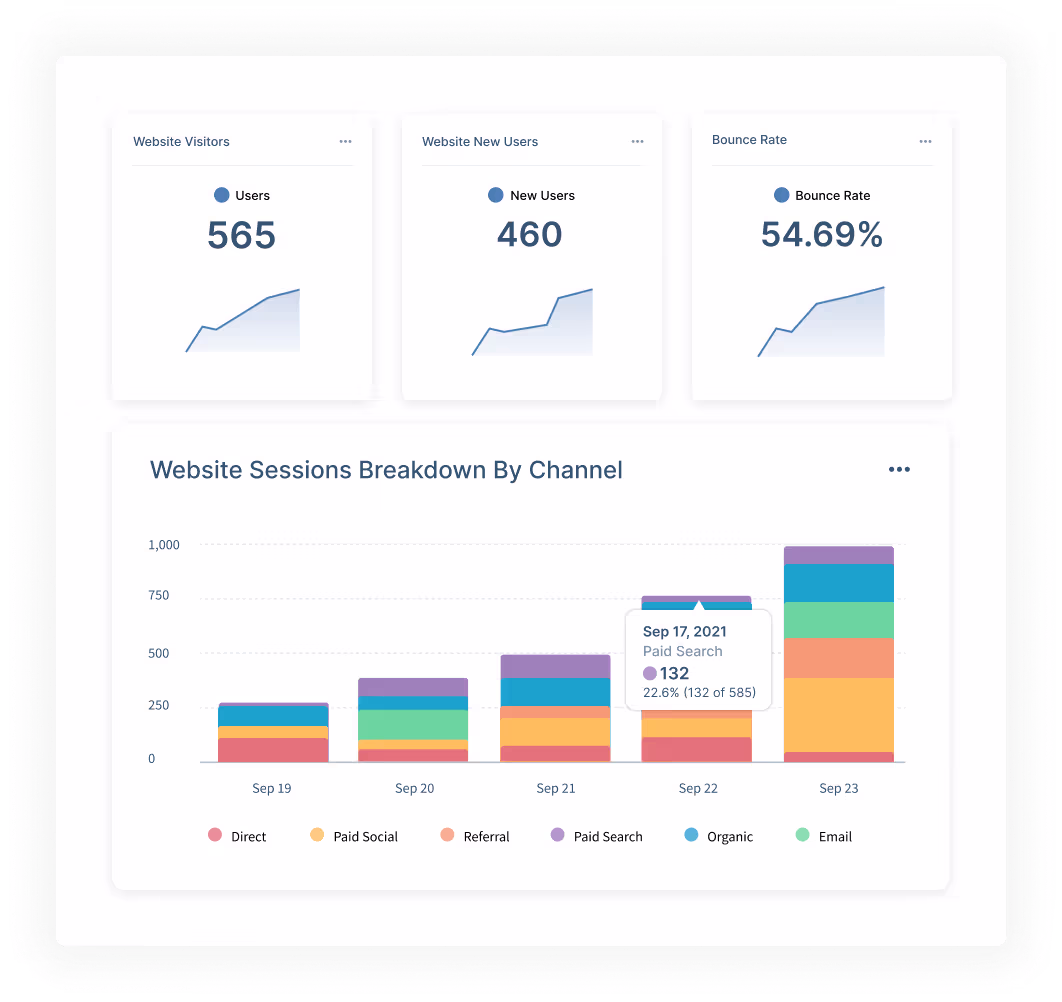
For example, let’s say you’re calculating the number of sessions on your website that come through various channels. A CMO dashboard will gather the data from all the channels, creating an easy visual for you to see which has driven the most sessions.
3. Helps identify trends and patterns
With all the data condensed onto one dashboard, CMOs and their teams can collectively take note of repetitive patterns in their target audience. This helps them further understand which type of campaigns work well on what channel and when leading to the ability to adapt campaign resources on the go.
For example, the company publishes a blog on the website every Tuesday. But they also post a video on LinkedIn on the same day. Over time, a CMO dashboard can display which content formats perform better on Tuesdays, helping the team double down their focus on that channel alone.
Key considerations when building a CMO Dashboard
An effective CMO dashboard is the central hub for monitoring marketing performance, aligning teams, and driving data-backed decisions. When designed thoughtfully, it becomes an invaluable strategic asset.
1. Intuitive and action-oriented design
A CMO dashboard is defined by its ease of use and ability to drive decisions. A cluttered, text-heavy layout overwhelms users with data but does not provide enough context to make decisions.
In contrast, a clean, visual interface tells a straightforward performance story that connects insights to actions and helps make data-backed decisions. Here are a few considerations for an insightful dashboard.
Prioritize key metrics
Prioritize the most critical metrics and add impactful visualizations like charts, graphs, gauges, and indicators to showcase them. For instance, use:
- Line charts to display trends over time for metrics like web traffic, conversions, etc.
- Comparison charts or pie charts to show channel effectiveness, campaign ROI, and more
- Funnel visualization to showcase drop-offs across the customer journey
- Alerts and gauges to highlight metrics nearing goals or thresholds
Optimize Information Absorption
Use color coding, alerts, and trends to highlight priority areas at a glance. Make sure that your dashboards have ample white space for better data absorption.
Also, include explanatory captions and annotations to provide essential context.
Offer Intuitive Interactions
Offer intuitive interactions like drill-downs, filtering, and segmenting to customize views on demand. For instance, help users:
- Filter data by categories, campaigns, regions, or date ranges
- Drill down from aggregate metrics to detailed data breakdowns
- Isolate underperforming categories and campaigns
Such flexibility allows slicing and dicing data along different dimensions for deeper analysis.
Streamline Navigation
Create tabs or dropdowns to switch between views, campaigns, time frames, and other dimensions. Optimize compatibility across devices so users can access the dashboard anywhere conveniently.
Most importantly, align terminologies and visualizations to thought processes familiar to users through day-to-day work. Simplicity and intuitiveness accelerate adoption.
2. Unified Data Foundation Across Teams
Marketing cannot drive impact alone. Close alignment across teams provides comprehensive visibility into the end-to-end customer journey.
Break Departmental Silos
Integrate your CMO dashboard tightly with essential systems like CRM, sales analytics, web analytics, finance systems, etc. Automatically sync campaign data, lead status changes, deal progress, and other cross-functional data flows.
For instance, pull web visitor profiles from analytics platforms to enrich lead records. Or, pass lead quality assessment and scoring metrics from marketing to sales for better follow-ups.
Shared Visibility Through Attribution
Compare the performance of marketing-generated vs. sales-generated pipelines on metrics like lead quality, sales cycle times, win rates, and deal sizes.
Conduct multi-touch attribution to understand marketing's influence at each buying stage. Such unified visibility bridges departmental silos with shared goals and metrics, steering coordinated priorities across teams.
3. Flexibility to Highlight Strategic Focus Areas
While cross-functional data consolidation provides tremendous value, a one-size-fits-all dashboard rarely meets specialized business needs fully. You need the dashboard to be customizable and dynamic.
Customizable Templates
Empower users to highlight metrics aligned to their goals—broad awareness or targeted account-based sales—without relying on IT.
Provide pre-built templates for different personas and use cases that showcase industry-specific benchmarks more relevant to their context.
Dynamic Filtering and Segmentation
Offer easy-to-use customization options such as an intuitive template builder interface. Let marketers filter data views dynamically by parameters like region, customer persona, product line, etc.
Such flexibility allows teams to analyze performance through different lenses—whether for the leadership team or campaign managers. As business objectives evolve, custom-tailored dashboards stay focused on what matters most.
4. Ongoing Optimization and Iteration
No dashboard gets designed perfectly right from the beginning. As marketing campaigns and strategies adapt in response to market dynamics, your dashboards also continuously realign to maintain relevance.
User Testing and Feedback Analysis
Monitor usage patterns and user feedback to identify navigation, metric, or visualization enhancements: track clicks, hovers, and other interactions to uncover usability issues. Conduct user surveys and interviews to gather feedback.
Maintain Flexibility
Maintain flexibility for adding new datasets from emerging sources and channels. Continually experiment, test, and optimize to fulfill ever-changing information needs most effectively.
Through an intuitive and action-oriented design backed by an integrated, flexible data foundation, the CMO dashboard becomes a powerful nerve center driving shared visibility, coordinated execution, and data-informed decisions across the business.
CMO Dashboard KPIs and Metrics
A CMO dashboard can include tons of KPIs and metrics depending on what you’re trying to track. However, below are the ones that are of topmost priority:
1. Top-of-the-funnel metrics such as engagement, traffic, leads
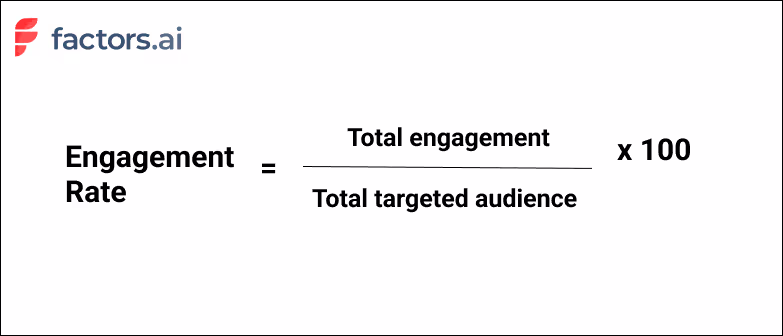
Top-of-the-funnel metrics are brand awareness metrics like the engagement rate, traffic, and leads generated. Most SaaS marketing executives track these to attract the target audience and turn them into long-term subscribers.
1. Engagement rates are metrics used to measure and track the active involvement of your target audience for the content you produce. The engagement rate formula is:
2. Traffic for SaaS companies is the volume or the total number of visitors their website gets over a certain time period.
3. Leads generated is a mandatory sales KPI every SaaS company must track. Measuring leads lets you uncover issues and nurture prospects further.
Why do these metrics matter?
Top-of-the-funnel metrics help measure the overall exposure of the target audience to your marketing efforts. Tracking and measuring them gives insight into what can help minimize roadblocks that stop prospects from signing up.
2. Conversion rates and efficiency
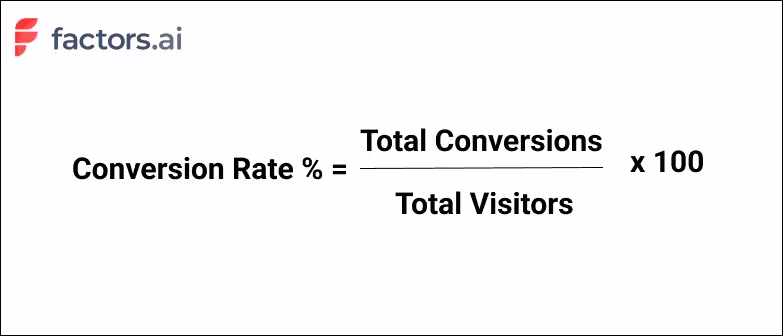
1. Conversion rates: measure the number of targeted users who converted from unknown prospects to engaged contacts. The higher the conversion rate, the more impact your marketing strategies have. The formula to calculate the conversion rate is:
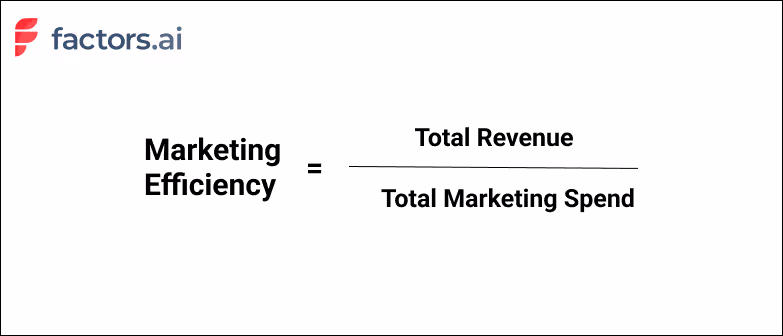
2. Efficiency: In marketing, the ROI measures the overall performance of your marketing efforts, and conversion rates directly indicate the performance. That means increasing conversion rates while reducing acquisition costs promises a better ROI and shows better strategy efficiency. The formula to calculate marketing efficiency is:
Why do these metrics matter?
Conversion rates and efficiency directly reflect how well your SaaS marketing activities are executed and determine the overall effectiveness of your business campaigns.
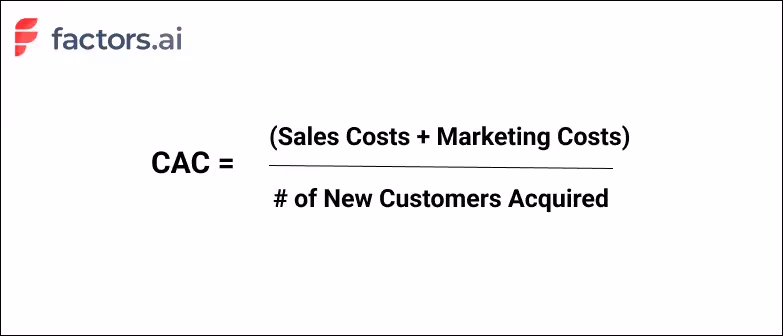
3. Cost of acquisition by channel
It’s best to track certain KPIs by marketing channels, such as social media, emails, ads, organic search, etc. Calculating the cost of customer acquisition (CAC) for each channel is one such KPI that indicates the marketing expenses spent on obtaining customers.The formula to calculate CAC by channel is:
Why does this metric matter?
Measuring CAC lets you decide whether or not to pursue marketing for a particular channel and demonstrates high-performing marketing channels having low CAC.
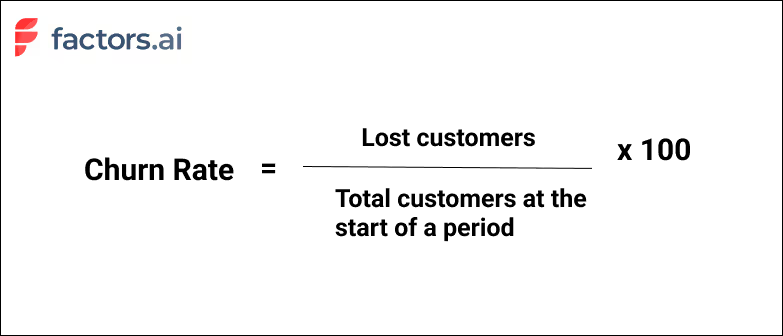
4. Retention and churn rates
Customer retention and churn rates are opposites that indicate the number of customers retained or lost over a time period. The formula to calculate churn rate is:
Why are these metrics important?
Customer churn and retention rates are one of the most important metrics for SaaS CMOs. Measuring churn rate can help shed light on why subscribers are refusing to renew your service, and based on high or low retention rates, you can decide whether to pursue the same strategies or refresh them.
5. Customer lifetime value
Customer lifetime value, or CLV, indicates the average pay throughout a customer’s relationship with your company. It is a critical SaaS KPI to showcase revenue as it conveys a customer’s worth on average. The formula to calculate CLV is:
Why does this metric matter?
CLV is a critical SaaS business viability measure. It is essential for understanding the business value each customer brings and your SaaS company’s long-term potential.
6. Revenue and pipeline velocity by channel source
1. Revenue by channel source tracked by CMOs indicates how well their ads, campaigns, and other marketing efforts perform based on their source. Additionally, it tells you the aggregate revenue earned from successful conversions from each outlet.
2. Pipeline velocity by channel source is a key KPI indicating the speed at which leads move through your sales pipeline for each channel source.
Why do these metrics matter?
A high pipeline velocity means smoother onboarding processes and better conversions. So tracking this and revenue by channel source over various periods lets you improve conversions from each source.
7. Revenue Growth Percentage
Revenue growth percentage indicates how rapidly total company revenue increases over a set time, typically month-over-month or year-over-year. It shows the overall momentum and health of the business.
The formula to calculate revenue growth is straightforward—take the revenue difference between the current and past periods and divide that by the one-time period revenue.
For example, for year over year revenue growth, use the formula:
((Current Yearly Revenue - Last Year's Yearly Revenue) / Last Year's Yearly Revenue) x 100.
Why does this metric matter?
Monitoring rapid or declining growth % signals how well marketing and sales efforts are faring and hitting targets. When coupled with cost metrics, it also showcases profitability trends. Understanding growth by revenue streams also enables executives to double down on the highest traction channels.
8. Customer Lifetime Value
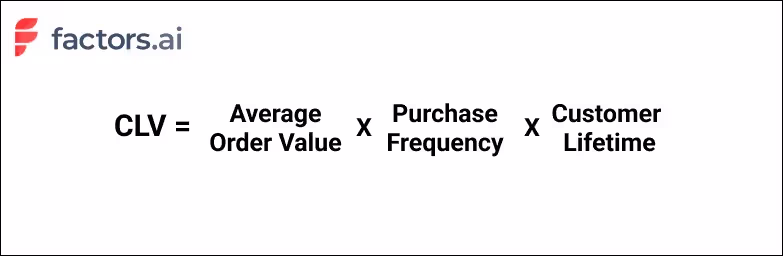
Customer lifetime value totals the likely earnings a business can generate from customers throughout their tenure. In essence, it conveys an average customer's worth.
The formula factors average order size, purchase frequency in a given period, and the average lifespan.
For instance, CLV may be calculated as: CLV = Average Order Value x Purchase Frequency Per Year x Average Lifespan in Years.
Why does this metric matter?
Tracking CLV over annual cohorts helps spotlight content, features, or channel innovations that make customers stickier. Comparing CLV vs acquisition cost also determines the breakeven period to recover expenses.
9. Cost Per Lead
Cost per lead signifies the average expenditure to generate a qualified marketing lead. It is calculated by dividing total lead gen marketing spend by the number of leads captured.
CPL can be calculated as: Total marketing dollars spent / Number of leads
If you spent $1000 to get 10 customers, that’s 1000/10 = $100 — Your CPL is $100.
Why does this metric matter?
Monitoring CPL trends determines the influence of brand equity on the sales funnel—a strong brand lowers CPL over time.
Comparing CPL by channel also helps optimize spending by identifying the lowest-cost customer acquisition sources. Analyzing CPL alongside customer lifetime value further ascertains profitable activities.
10. Brand Search Volume
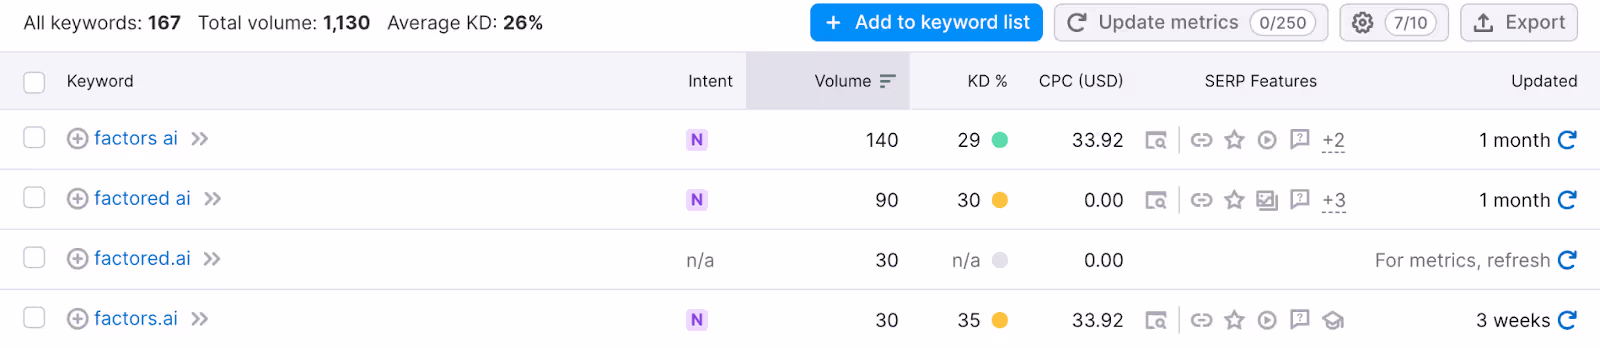
Brand search volume measures monthly search queries for your brand name and keywords. Sudden surges or declines show changing consumer interest.
Why does this metric matter?
Tracks brand visibility gains/losses to correlate awareness-building campaigns and events. Guides keyword targeting and content strategies.
Creating Effective CMO Dashboards in Factors AI
Over the course of this article, we’ve covered what a CMO dashboard is, what its benefits are, and a few common metrics for CMOs to track. But constructing a comprehensive CMO dashboard is easier said than done — unless of course, you leverage a tailor-made dashboarding tool like Factors.
Factors unifies and reports data across complex buyer journeys involving multiple stakeholders, touchpoints, and channels under one roof. What does this mean for you? No more individual tools to analyze campaign performance, website engagement, and pipeline/revenue related metrics.
It’s simply all the metrics you care about as CMO in one, intuitive, customizable dashboard. Here are a few nifty features loved by CMOs:
- Ad hoc filters and breakdowns: Slice and dice metrics and KPIs with a wide range of filters and breakdowns to answer questions like: “How does conversion rate vary between companies with at least 200 employees and smaller teams of less than 50?” or “What’s the difference in sales velocity between leads from paid search and organic social?”
- Automated AI-fueled insights: It’s one thing to have your data in one place — but how can CMOs make sense of the numbers? Factors offers automated insights into what’s helping and hurting a specific conversion goal. What’s driving demo form submissions? Our Explain engine may suggest Linkedin campaigns and the pricing page have a positive influence while Display ads and email outreach is limiting performance. This helps the larger team improve resource allocation and drive ROI.
- Custom funnels, KPIs, and properties: Every business has different requirements. This is no different when it comes to reporting and dashboarding needs. Factors supports limitless customizations to KPIs and properties so CMO dashboards can be tailor-made to the what matters most to you.
Curious to see Factors in action? Schedule a personalized demo here!

How To Use Intent Data To Drive Pipeline (Part I)
All Roads Lead To Revenue
There’s no doubt that top of the funnels like traffic and opportunities remain important indicators to B2B marketers. But increasingly, high-growth marketing teams are held accountable for bottom-line business metrics like pipeline and revenue.
That being said, driving deals is easier said than done. With limited budgets, tight competition, and volatile markets, go-to-market teams need an efficient alternative to make the most of their resources.
Enter: Intent data
Intent data captures buyer intent so you can identify, target, and convert high-fit sales-ready accounts. Here’s what this means for your team:
- Intent-based outreach, as opposed to cold outreach
- Targeted ABM efforts, as opposed to spray and pray tactics
- Deal acceleration for existing or lost accounts in the pipeline
When used efficiently, intent data can wring out every bit of ROI from existing marketing and sales efforts. The following guide highlights how to leverage intent data to drive more pipeline, with less spend.
What Is Intent Data?
Intent data is any data that provides information about customer behavior and buyer intent across campaigns, websites, review sites, or more. There are 4 types of intent data: zero-party, first-party, second-party, and third-party:
- Zero-party intent data: Data that a buyer explicitly shares. (Eg: demo form with Name and Email fields)
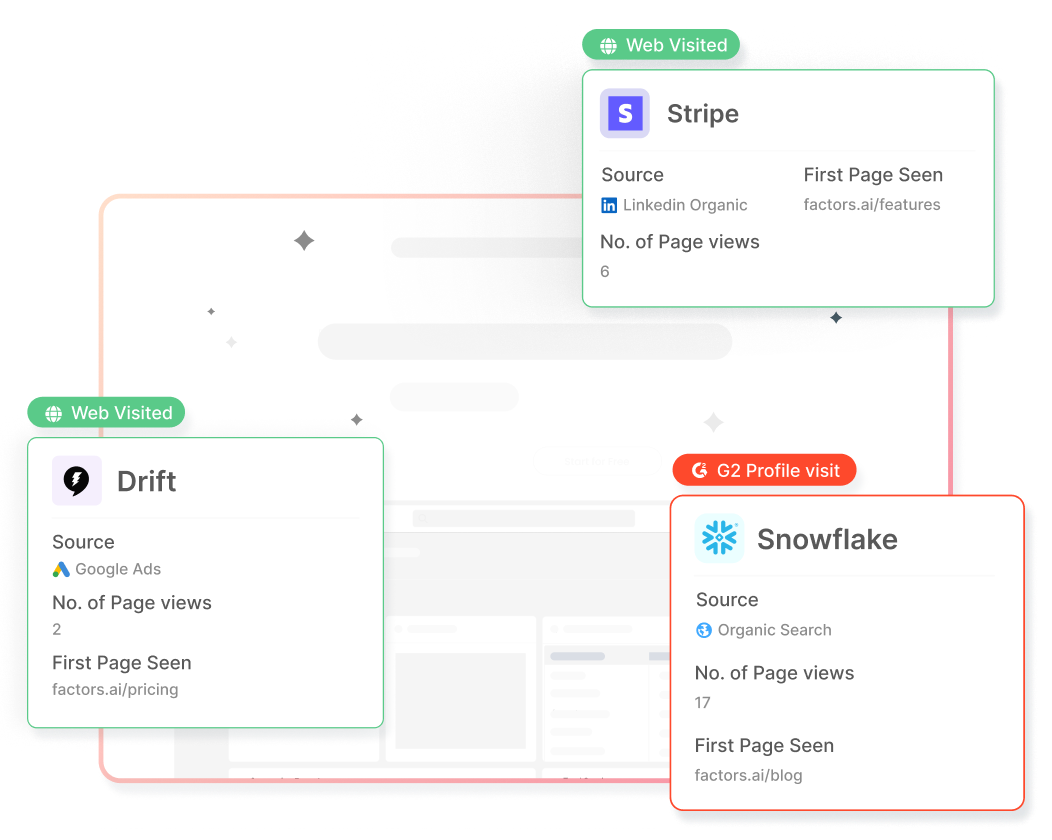
- First-party intent data: Data that’s collected from buyer’s interaction with a business. (Eg: Web sessions, page views, button clicks, etc)
- Second-part intent data: Data collected from another company’s first-party data (Eg: First-party data from review sites like G2 or Capterra)
- Third-party intent data: Aggregated data from multiple sources (Eg Bombora intent data)
Why’s Intent Data Important?
1. Efficiency gains: Just a few years ago, businesses were ready to buy, buy, buy. These days, companies are far more conservative. Longer sales cycles, lower win rates, and shrinking contract values all point towards this.
That's why prospects that are considering your solution are that much more important. However, only about 5% of website traffic actually converts — leaving the remaining 95% of visiting accounts completely anonymous.
Using intent-data in tandem with account identification tools helps discover, qualify, and convert up to 64% of sales-ready companies already visiting your website. Tap into a pool of mid/bottom of the funnel accounts who are yet to convert with zero additional spend. Here are a few questions you can answer:
- Which ICP accounts visited a landing page through a search ad but didn’t submit a demo form?
- Which companies are reading bottom of the funnel product blogs at least 50% of the way?
2. Early-intent detection: Studies find that buyers are 57% along the buyer journey before contacting a sales rep. Fifty. Seven. Percent! By this stage, in-market accounts have done their research and formed a rough idea as to which vendor they’re leaning towards.
Intent data helps identify buyer intent much, much before a form is submitted. This gives teams a significant first mover advantage in establishing the initial evaluation criteria, building relevant relationships, and improving the odds for a higher ACV.
It would mean beating competitors to the sales by reaching out to sales-ready prospects before anyone else does. While getting there first isn’t everything, it certainly helps.
Ingredients To Leverage Intent Data
We’ve established that intent data is pretty valuable. But how to collect intent data? Who should be involved? And what’s a comprehensive way to leverage this data to drive pipeline? This section covers the tools, people & process that make intent data work.
1. Tools
Here are all the tools you’ll need to identify, track, report, and activate intent data.
1. Intent Data Providers
Data is essential to make this work. Start by identifying a handful of sources for various types of intent data. This doesn’t have to be complex or expensive, the following tools are a great starting point:
- First-party data - Factors.ai, 6sense
- Second-party data - G2, Trustradius, Capterra
- Third-party data - Bombora, Leadsift, Contentgine
Factors is a account intelligence tool that delivers industry-leading IP-lookup technology to identify up to 64% of companies visiting your website. This includes company name, firmographics (industry, headcount, revenue-range, etc), and behavioral data (page views, scroll-depth, button clicks, etc)
2. CRM
A CRM acts as a single source of truth to unify intent data for the entire GTM engine across sales, marketing, and customer success. You’re likely already using a CRM such as HubSpot or Salesforce. Other alternatives include Zoho, Pipedrive, and Leadsquared.
3. Enrichment Database
Once accounts visiting the website have been qualified for fit and intent, use an enrichment database to identify the appropriate people to reach out to. A few popular enrichment tools include:
- Apollo
- Zoominfo
- Lusha
- LeadIQ
4. Sales Engagement
The following sales engagement tools help sales reps and marketers automate the outreach process across multiple channels including email, phone calls, and social media:
- Outreach
- Outplay
- Salesloft
- Klenty
- LinkedIn Sales Navigator
5. Internal Communications
Push real-time alerts to internal communication tools like Slack or MS teams when new companies or existing leads from target companies are live on the website.
We’ll cover how each of these tools work in tandem in the process section of this article.
2. People
These are the stakeholders and responsibilities involved in mastering intent data.
- Marketing: Assign a demand gen lead or program manager to stay on top of all things marketing
- Sales: Assign a sales manager to stay on top of all things sales. Onboard a team of SDRs/AEs to activate the intent data by reaching out to high-intent leads and nurturing mid-intent prospects.
- Operations: Given that this is a relatively elaborate, data-heavy workflow, assign a mar/sales ops to setup the initial framework, ensure accurate reporting, and
- Data & research: While several tools can identify accounts visiting your website, it’s impossible to reveal the exact individual visitor. If possible, onboard a researcher to enrich company-level visitor data with the appropriate prospects to reach out to within each company. A researcher to sales rep ratio of 1:4 is recommended, but not necessary.
- Executive sponsorship: Needless to say, it’s important that senior executives are aligned on who’s working on what, and why. There must be clarity in terms of deliverables for each function involved in the process.
3. Process
Bringing it all together, is the following 4-stage, 8-step intent program process to leverage intent data.
.avif)
1. Stage One: Identify & Notify
As previously mentioned, there are several types of intent data. When it comes to setting up an intent-based outreach program, it’s best to start with first-party website IP-to-company identification data. For one, the website is the most voluminous touchpoint in a B2B/SaaS buyer journey. For another, starting with account identification from website traffic is a low-effort, high-impact initiative involving minimal investment.
The remainder of this article zeroes-in on leveraging first-party account identification data. That being said, the process remains largely the same for other types of intent data.
Step 1: Invest in an account identification tool
When it comes to account identification tools, there’s no shortage of alternatives. Here’s why we recommend Factors over others:
- Better data-accuracy: Factors taps-into 6signal — an industry-leading account identification to reveal up to 64% of anonymous website visitors. That’s 27% more than the likes of Clearbit or Kickfire.
- Cost-effective plans: Plans start as low as $99/month including dedicated onboarding support and customer success management. More pricing details here: factors.ai/pricing
- Advance analytics: Given that Factors is built on strong account analytics foundations, users can achieve granular visibility into website KPIs, visitor behavior, and account timelines.
Step 2: Filter accounts based on fit and intent
Of course, not all website traffic will make a great fit for your business. Refine the total set of accounts identified to just those that fit your ideal client profile using firmographic and technographic filters.
For example, maybe you’re only interested in companies visiting your website that meet the following criteria:
- Industry: Software, IT, Education
- Geography: US & Canada
- Employee headcount: Under 500
- Technology: HubSpot, Google Ads
But even still, not every one of these companies may be ready to buy. With Factors, you can filter down the list of ICP companies to high-intent accounts based on their engagement. For example, maybe you’re only interested in ICP visitors that spend at least 60 seconds on high-intent pages such as pricing or features.

Step 3: Notify stakeholders in real-time
Once a criteria for high-intent, ICP accounts has been established, use Factors to push real-time alerts on Slack, MS teams, or Email when accounts that match this criteria are live on the site. This notification may be shared with sales reps to take action while the iron’s still hot.


Phew…this is a pretty involved read so we’ve split the remaining three stages of this intent program here: How To Use Intent Data To Drive Pipeline Part II. Read on to understand how to enrich, engage, and convert sales-ready accounts with intent-data and account identification.

How To Use Intent Data To Drive Pipeline (Part II)
Hey! Have you read part one yet? Check out the first stage of our intent data program here: How To Use Intent Data To Drive Pipeline Part I. We also discuss what intent data is, why it’s important, and the various tools and people you’ll need to get the most out of your intent data.

In part II, we discuss the remaining three stages of the intent program process:
- Stage 2: Enrich & Prospect
- Stage 3:Engage & Convert
- Stage 4: Measure & Report
Let’s jump right in..
2. Stage Two: Enrich & Prospect

Up until this point, we’ve identified ICP accounts visiting the website and notified sales reps with relevant details. But actually reaching out to leads within these accounts involves making an educated guess as to who may have visited. Here’s what we suggest:
Step 4: Enrich relevant contacts
Enrich account-level information with contacts that are likely to be part of the buying committee using the aforementioned enrichment tools (Apollo, Zoominfo, Lusha, etc). Key contact data includes:
- Name
- Job title
- Work email
- Phone number
For example, a martech product likely sells to marketing executives. In this case, it would make sense to find CMOs and Marketing VPs from the companies visiting your website.
Assuming you have a good idea as to what these buyer personas are for your company, identify 3-6 contacts based on their roles in the buying committee: user, champion, decision maker, influencer, and blocker.
Here’s an example of a buying committee for an account identification tool like Factors:

Step 5: Prioritize the right accounts
Based on your website traffic, you may identify thousands of ICP visitors every week. The ability to reach out to every single one of those accounts will depend on the maturity and scale of your intent program and sales team.
Assuming that most early to mid-market companies aren’t in a position to target every account, here’s our F.I.R.E 🔥 framework to help prioritize who to go after first:
1. Fitment: Divide your ICP criteria into 3 tiers (Great fit, Good fit, Poor fit) based on a combination of the following factors:
- Deal size - expected contract value
- Deal velocity - time to customer conversion
- Deal win rate - probability of closure
In general, deal size tends to increase as accounts progress from SMB to mid-market to enterprise. Similarly, the further up-market you go, the slower the deal velocity. Win rate varies based on size and industry. Once divided, it's that much easier to prioritize targeting based on company size, short sales cycle vs long sales cycle accounts, or low-hanging fruits with high win rates.
2. Intent
While a company may fit your ideal client profile, they may not be sales-ready. Some buyers may be aware of the problem but not the solution or the product, while others may be sales-ready and wholly aware of the problem, solution and product.
This is where intent data plays a huge role in determining a prospect’s readiness to buy. Here’s an example:
Gauge prospects based on what stage of the buyer journey they’re in and prioritize accounts based on buying intent.
3. Recency
Research finds that reaching out to prospects quickly dramatically raises the odds of conversion. Recency establishes how recently an account has been looking to solve a problem with your solution. This can be measured by identifying the last active time of a particular account.
For instance, a high-fit account that’s repeatedly visiting your company’s G2 reviews over the past 24 hours should be prioritized over an equally high-fit account that visited your homepage several weeks ago.
4. Engagement
Engagement is complementary to Intent but provides broader insights into where accounts are coming from and what topics they’re specifically interested in.
For example, an account reading a “what-is-xyz?” article may indicate that it is still way up in the awareness stage as compared to a visitor from a search ad on a landing page or a visitor reading a “comparison” article.
Monitoring engagement also helps understand what content appeals most to your target audience. Let’s say that SMB account seem to be especially interested in the pricing page while enterprise accounts are interested in the security compliance page. If your ICP is enterprise firms, then it might make sense to highlight privacy related content more prominently to drive conversions.

Depending on your tech stack and the complexity of processes, the Enrichment & Prioritization steps of the process can be:
- Decentralized - handled by individual sales reps
- Centralized & Manual - handled by the data & research team
- Centralized & Automated - handled by workflows set up by marketing ops & sales ops
Once you’ve prioritized your accounts using the above framework, decide whether it’ll be sales or marketing that’s reaching out to warm up target accounts. Here’s an example of one mix, but feel free to experiment with different approached:
3. Stage Three: Engage & Convert

So far, we’ve identified companies, enriched ICP accounts with relevant contacts, and prioritized target accounts based on fit and intent. Next, marketing and sales do what they do best: reach out and convert sales-ready buyers. Remember to check out the sales engagement tools recommended in Part I for this.
Step 6: Multi-channel engagement
Even though we know we’re reaching out to high-fit, high-intent accounts, we can’t be sure that we’re reaching out to the exact individual who visited our website. And regardless, no one likes a cold, out-of-the-blue sales pitch.
Do not approach contacts from high-intent, de-anonymized accounts like you’d approach inbound hand-raisers. These contacts are yet to submit a form or explicitly communicate with your business.
That being said, these accounts aren’t exactly cold either given that we have context on their intent. Marketing and sales must work in tandem to warm up these accounts with appropriate, multi-channel engagement:
Factors can measure engagement on G2, Linkedin ads, and more. Here’s a quick summary of use-cases:
- Identify which companies are viewing your ads but are yet to convert
- Track the buyer journey at an account level across ads, website, and CRM
- Fine tune messaging, targeting (and retargeting) efforts based on engagement
Here’s an example of a multi-channel sales engagement cadence:
.avif)
Here’s a sample template for prospect that show website intent:

Here’s another one for prospects that show intent from G2:

Step 7: Qualify buying intent
Earlier in this intent program, we qualified accounts based on fit and intent. But once we’ve established contact, it makes sense to qualify accounts again to know where to double down. BANT is an excellent framework for this:
Here are a few more qualifying questions to gauge customer-fit and intent:
- What triggered your search for a solution?
- How have you been solving this up until now?
- Have you explored other alternatives?
- What factors will influence your purchase decision? What are the non-negotiables?
4. Stage Four: Measure & Report
Finally, we’re at the last stage of the intent program — crunching the numbers.

Step 8: Track and optimize the intent funnel
Once qualified accounts start converting and generating pipeline, it’s important to measure every step of the funnel from accounts identified to closed won pipeline. Here’s an exhaustive list of funnel metrics to measure the health of the program:
Make sure you keep track of these metrics across all tiers/priorities of accounts to better understand the quality of conversion. It’s also important to track traditional GTM metrics such as ACV, deal velocity, and win rates so as to be able to compare the intent program against standard inbound and outbound programs.

And there you have it! Intent-data is a powerful tool to accelerate pipeline without significant additional investment. We strongly recommend the program discussed over the course of this two-part series to dramatically improve inbound, outbound, and ABM efforts across the board. Overall, we’ve seen great, real-life success with customers using similar workflows.

Curious to see how Factors in action? Book a demo with us here.

SaaStr 2023: Mixers & Afterparties
Get ready for the hottest SaaStr mixers in and around the Bay Area! SaaStr 2023 is back, and it's the place to be from September 6th to 8th. Join the largest gathering of SaaS founders, executives, and industry leaders for three days of learning, networking, and unforgettable moments. With so many SaaStr mixers to choose from, we've got you covered. Check out our curated list of the must-attend events below. See you there!
Tuesday, Sep 5
1. The State of SaaS: Leaders Drinks

Cledara and ChartMogul have teamed up to bring forth an evening of networking in San Mateo, along with several prominent figures in the SaaS industry. It’s an opportunity for you to exchange ideas, build connections while relishing a wide assortment of cocktails, it’s indeed a great start to the event with a little catch-up to warm yourselves up and get familiar with the settings.
When: Sep 5 | 6:30 PM to 9:30 PM GMT-7
Where: Fogbird, San Mateo
2. Zendesk for Startups has a great pre-SaaStr event “Customers and Capital”

Learn from leaders at startups that have scaled
Two of the most crucial components for startups to scale are customers and capital. In this event, leaders from thriving startups and investors will share their best practices on scaling a customer-centric startup and securing your next round of funding.
When: September 5th, 2023, 4:00pm–7:00pm
Where: Pinstripes, 36 Hillsdale Mall, San Mateo, CA 94403
3. Sip, Snack, and SaaStr: The Ultimate Pre-SaaStr Networking Extravaganza

The Dynamic Duo: Dreamdata and Younium Join Forces!! Join us for the ultimate Pre-SaaStr Meet Up and Mingle Party, the perfect kickoff to the much-anticipated conference! 🎉🥂Get ready to mix, mingle, and make connections with fellow SaaStr enthusiasts before the big event. It's the ultimate icebreaker to meet new friends, catch up with old ones, and expand your network in a relaxed and fun atmosphere.
When: September 5th, 2023, 6:00pm–7:00pm
Where: The Refuge San Mateo Restaurant, 66 31st Ave, San Mateo, Californien, US, 94403
4. Pre-Saastr Huddle: Calling upon all CCOs and their post-sales leaders!

Calling upon all founders, CCOs, and their post-sales leaders
Keeping it Real: Baring Post-Sale Truths and Trials
The best in the business shed light on their post-sale challenges and secrets. Are you ready to dive into the depths of the most challenging post-sale conundrums?
Look no further! The stage is set for an electrifying event where post-sale leaders unite to dissect the toughest hurdles they've navigated over the past year.
When: September 5th, 2023, 4:00pm–7:00pm
Where: 28 E 3rd Ave #101, San Mateo, California
5. The SaaSiest Welcome Bash Pre SaaStr Annual 2023

Come along, mingle with fellow SaaS enthusiasts, and experience a bar transformed into a glamorous experience, perfectly designed for connecting with your peers. Your hosts are Avoma (all-in-one AI Meeting Assistant, Collaboration, Forecasting and Intelligence platform for customer facing teams), Allegrow (the #1 platform for inbox placement) and Modern GTM (the leading SaaS consultants for go to market teams).
When: September 5th, 2023, 4:30pm–8:30pm
Where: San Mateo, California
Wednesday, Sep 6
6. SaaStr’s First Wine and Food Festival

Take some time off to try out some of the best wines in the town while mingling with like-minded people from the industry. Pssst! It also has several food trucks too.
When: On Site
When: Sept 6, Starts 5 Pm
7. SaaStr Annual after-party

This after-party is co-hosted by Greenhouse and HiBob. The event is thoughtfully organised to bring together industry leaders and experts to celebrate the worktech solutions that are empowering today’s hiring teams.
But that’s not all, there is a lot of fun accompanying it and this time it’s even better!
When: September 6 | 7-9 pm
Where: The Academy Social Club | 2166 Market St. | San Francisco, CA | 94114
Save a seat
8. Mission Cloud and AWS After-Party

Possibly the best opportunity for all SaaS professionals to connect with leaders in this industry. In this happy hour, you can mingle with the CEO, CTO, Data Learning and Machine Analytics lead of Mission Cloud.
With a lot of fun packed experience in the waiting, this is a win-win for all!
When: September 6 | 6:30-8:30 PDT
Where: Paul Martin, near Campus
9. SaaStr Annual 2023 After Party hosted by Workato

Join for drinks, light appetizers & bocce ball after SaaStr Annual 2023 Conference & Expo. Space is limited so register today to save your spot!
When: Sept 6th, 2023, 7pm - 9pm PT
Where: Pinstripe, 36 Hillsdale Mall, San Mateo, CA 94403
10. Sundowner for the SaaS Soul

If you are a founder, CCO, or post-sales leader who wants to meet your tribe after the first day of the SaaStr festival, we got you! As the sun dips below the horizon, the SaaS world will come to life at the SaaS Sundowner. Connect with your peers, professionals, innovators, and thought leaders from the post-sale realm with a fusion of delectable refreshments and engaging conversations. Join us to ignite valuable partnerships and meaningful connections, and refuel yourself for the next two days at SaaStr!
Let's raise our glasses to innovation, collaboration, and a sunset that mirrors the brilliance of the SaaS industry.
When: Sept 6th, 2023, 6-9pm PT
Where: C Food Crush
251 S B St, San Mateo, CA 94401, USA
11. Time Capsule SaaStr Afterparty with Toplyne, Paddle, & Common Room

Step into the Time Capsule Afterparty: A realm where art, music, and celebration collide.
Network, mix, and party with Toplyne, Paddle, and Common Room after Day 1 of SaaStr Annual. Your 2023 Time Capsule Party is set among curated exhibits from iconic moments and physical relics of the SaaS Industry's best-kept secrets.
Featuring exhibits from SaaS's biggest companies and names.
When: Sept 6th, 2023, 6.30PM
Where: Pinstripes, 36 Hillsdale Mall, San Mateo, CA 94403, USA
12. Finance Unplugged

Join them for an evening of refreshing conversations and drinks. Build your network, expand your expertise, and discover radical strategies to succeed as a modern finance leader. This is your finance community.
When: Sept 6th, 2023, 7.00 PM
Where: Pausa Bar & Cookery, San Mateo
Save a seat
13. RevGenius X Hubilo, Bits & Bites: SaaS Comedy Roast

Attending SaaStr? Swing by our SaaS comedy roast! Our lineup is packed with top industry names, and no one is safe from the laughter. Make sure you join us for an exclusive night of networking! This event has been designed for marketing and revenue leaders from B2B space. To maintain an intimate atmosphere, all the submissions are subject to approval.
When: Sept 6th, 2023, 6.30 PM
Where: Pinstripes San Mateo
14. Postal and Navan are hosting an Opp-Tober fest

Guten Tag! Join us Wednesday, September 6 for an Oktoberfest extravaganza following SaaStr, Day 1. Get ready for an unforgettable evening at Wursthall - complete with premium hops-pitality and great company.
When: Sept 6, 6pm - 9:30pm PT
Where: Wursthall: 310 Baldwin Ave, 9440
15. Coastal Therapy Yacht Party

You're the happiest when you're near water. It's true (google it!) So...
Come hang with your fellow SaaStrs and a few interesting guests on the Empress, a 90 foot luxury yacht.
🍢 Hors d'oeurves for your stomach.
🍸 Cocktails for your head.
💃 Jams for the soul.
It's all here.
When: Wednesday, September 6th, 8:00 PM - 10:00 PM
Where: Oyster Point Marina 95 Harbor Master Rd, South San Francisco, CA 94080
16. SaaStr After Hours Happy Hour, Rhymetec

When: Wednesday, September 6th from 7:30 - 9:30pm PST
Where: Fieldwork Brewing, 3030 S Delaware St, San Mateo
Sign up here: https://www.linkedin.com/events/saastrafterhourshappyhour7100845320988672000/comments/
Pre-SaaStr morning run with Dreamdata
Get ready for an energizing start to SaaStr as we kick off with a chill morning 5K run. Lace-up your running shoes and join us for a slow-paced jog where we'll explore the sights of San Mateo.
Not only will you get to experience the city, but you'll also have the chance to connect and have a blast with fellow SaaS enthusiasts who are joining this event.
When: Wed, Sep 6, 2023 from 7.30 AM
Where: 974 E Hillsdale Blvd, Foster City, Californien, US, 94404
Memorial | Leo J. Ryan, 974 E Hillsdale Blvd, Foster City, CA 94404, United States
Sign up here: https://www.linkedin.com/events/pre-saastrmorningrunwithdreamda7097643481006780416/about/
Thursday, Sep 7
17. Consensus Hosted After Hours Saastr Event

Join Consensus for a night of bowling, bocce, food, drinks and fun! No presentations, just good old fashioned networking and good times. Join us directly after Saastr’s “Big Party” at Pinstripes, just a mile from the San Mateo Events Center.
When: Thursday, September 7, 2023 @ 8pm - 10pm
Where: Pinstripes | 36 Hillsdale Mall, San Mateo, CA 94403
Sign up: https://goconsensus.com/event/consensus-hosted-after-hours-saastr-event/
18. Women in Sales Happy Hour

They're hosting a happy hour at 5pm PST on 9/7 and it’s the perfect pre-party before the epic Lavender 💜 event happening later that night!
When: Thursday, September 7, 2023 @ 5pm - 10pm
Where: Toy Soldier, 52 Belden PL, San Francisco
19. Mutiny is hosting a Party Like It’s the 90s party

Going to SaaStr? Stop by the 90s throwback happy hour with our friends at Chili Piper, Mutiny, 🔮 Pocus, Navattic and Webstacks!
When: Thursday, September 7, 2023 @ 5.30PM
Where: Pinstripes, 36 Hillsdale Mall, San Mateo
Sign up: https://www.pocus.com/event-party-like-its-the-90s?utm_campaign=SaaStr-2023&utm_source=Mutiny
20. Mutiny is hosting a Party Like It’s the 90s party

Guests will enjoy curated cocktails, great food, and even better networking at Fogbird in downtown San Mateo. The guest list will fill up quickly so please register ASAP; once at capacity we will start a waitlist.
When: September 7, 2023 | 5:00-10:30 PM PST
Where: Fogbird | 144 South B Street, San Mateo, CA
Sign up: https://coda.io/resources/events/saastr-happy-hour-mixer
21. Grow with SAP and Remote are hosting a dinner

Supercharge your global expansion. Join us for an exclusive invite-only dinner to learn new strategies for unlocking global growth.
When: 6pm-9pm sail time | *5:15pm Transportation will be provided to and from the SaaStr conference
Where: The Empress Yacht - San Francisco Pier 40
22. A Glass of SaaS

Join NEA and some of the hottest up-and-coming SaaS companies on Thursday, September 7th, 5:00pm-8:00pm for A Glass of SaaS—an evening of beer, bites, and plenty of SaaSy conversation at Fieldwork Brewing Co. We hope you can make it!
When: Thursday, 7 September, 5:00pm-8:00pm
Where: Fieldwork Brewing Company - San Mateo
San Mateo, California
Sign up: https://lu.ma/aglassofsaas
23. Unusual Ventures is hosting a PLG Happy Hour in Oakland from 5-7

Based in the Bay Area or in town for SaaStr? Come mingle with other PLG leaders in downtown Oakland at a casual happy hour hosted by Dopt and Unusual Ventures!
When: Thursday, 7 September, 5:00PM to 7:00PM.
Where: Oakland, California
Sign up: https://lu.ma/plg-hh-unusual-dopt
Friday, Sep 8
24.Vibramium.VC has an early stage founder and investor party

Join Vibranium.VC and partners for an exciting evening of networking and connections! Whether you're looking for funding, mentorship, or simply want to expand your network, this party is the place to be. Mingle with like-minded individuals, exchange ideas, and discover potential collaborations. Don't miss out on this fantastic chance to connect and grow in a relaxed and friendly atmosphere. Space is limited, so request access now!
When: Sept 8th at 5:00PM
Where: TBD (SAN MATEO)
Sign up: https://saastrearlystagefoundersinve.splashthat.com/

